Expert guide: Adding Likert scales in Microsoft Forms
Summarize with
Measuring human sentiment is tricky, yet capturing nuanced opinions is essential for data-driven decisions. If you are struggling to gauge user attitudes beyond simple "Yes/No" answers, the Microsoft Forms Likert scale is your go-to tool.
Shortcut steps:
1. Open your form
2. Click “Add new question.”
3. Choose “Likert.”
4. Add options or statements
A Likert scale is a psychometric tool designed to measure attitudes, character, and opinions that a simple "yes/no" question cannot capture.
Instead of forcing a binary choice, it presents a series of statements, and asks respondents to select their level of agreement or disagreement along a symmetric continuum. In a Microsoft Forms Likert scale, this is visualized as a grid where rows contain your statements and columns represent the response options.
While the 5-point scale is the industry standard (offering a "Neutral" middle ground), professionals often adapt the scale size to their specific goals:
- 4-point scale: A "forced choice" model that removes the neutral option, ideal for high-stakes feedback.
- 7-point scale: Provides more granular data, often used in academic research to capture subtle shifts in sentiment.
Real-world applications
To build an effective likert chart, you must tailor the statements to your specific field:
- HR & Leadership: Measuring employee engagement with statements like, "I feel supported by my direct supervisor."
- Education: Assessing student confidence post-lesson, e.g., "I can independently solve quadratic equations."
- Marketing & UX: Gauging product-market fit, such as, "The checkout process was intuitive and fast."
Step 1: Access your workspace
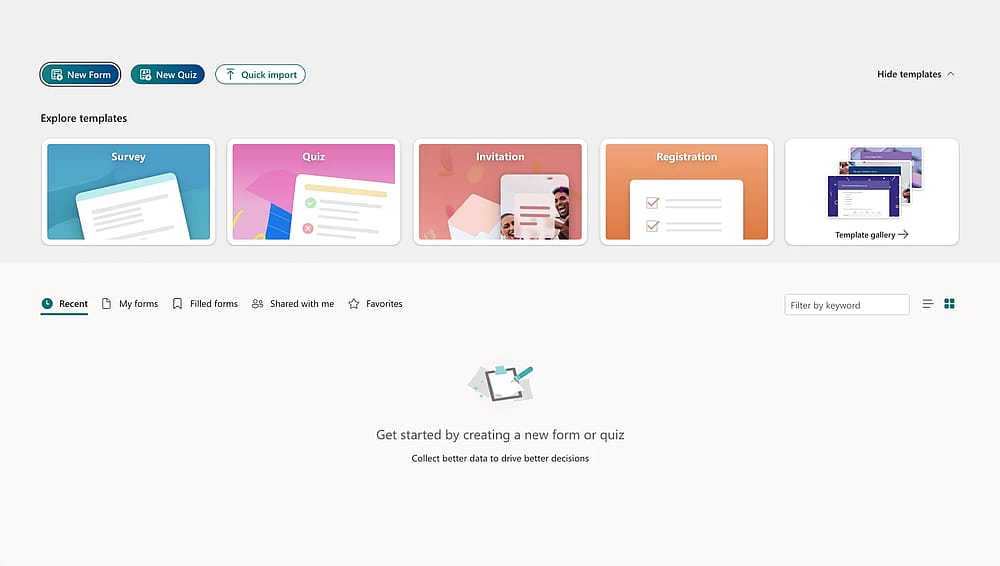
Open your form
Sign in with your Microsoft 365 account. You can either start a "New Form" or select an existing project from your dashboard.
Step 2: Insert the Likert question type
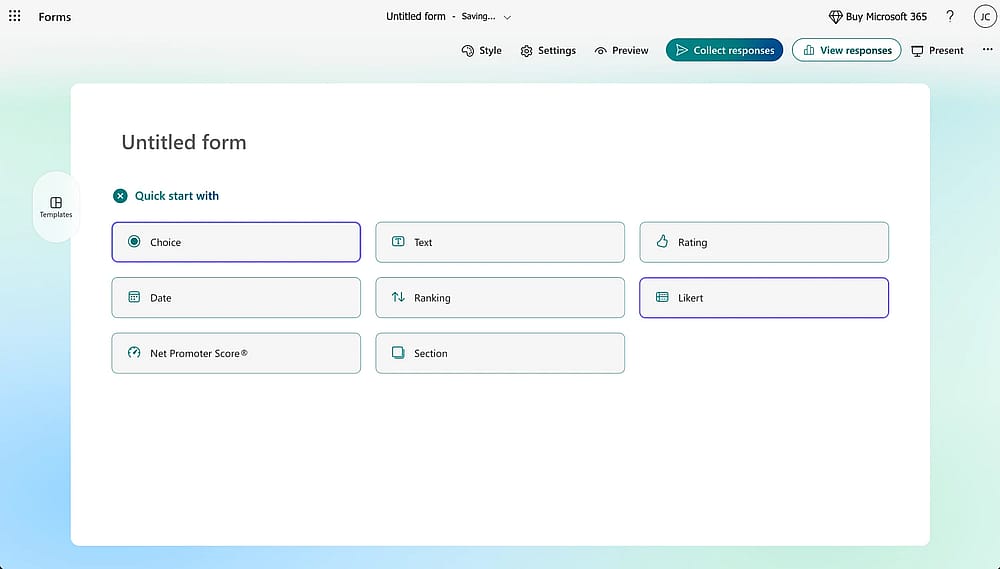
Click the “Likert” button
Click the + Add new button. Microsoft shows lists all the question types here. Click the Likert option.
Step 3: Define your context
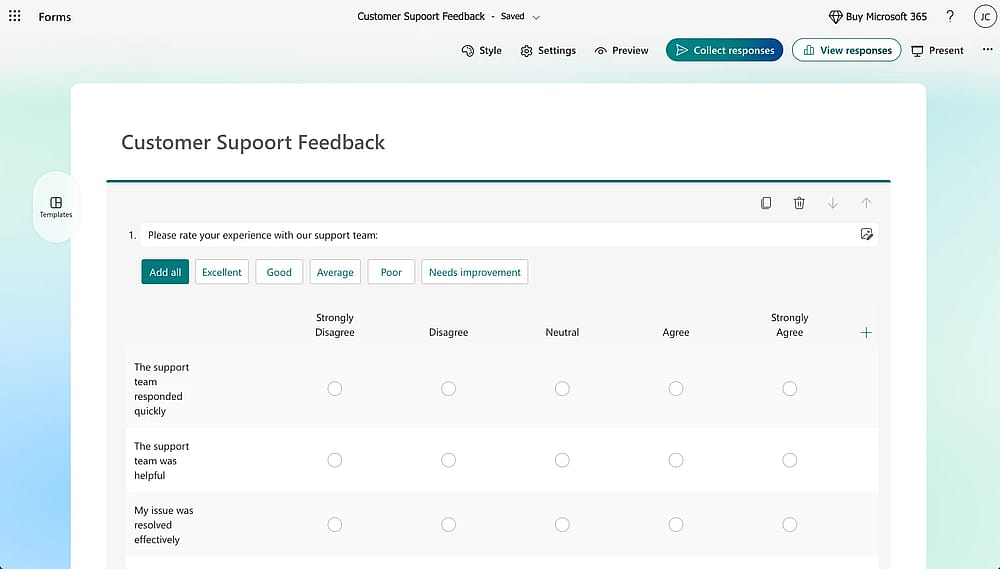
Click the “Likert” button
In the main question field, provide a general instruction or the primary topic of evaluation (e.g., "Please rate your experience with our support team").
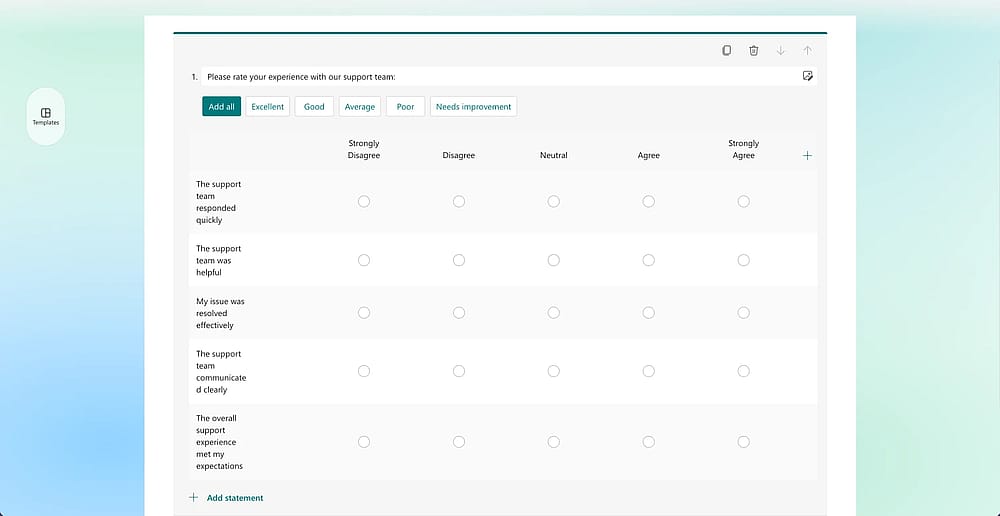
Step 4: Configure rows and columns
Add the Likert question details
This is where you build your likert chart:
- Statement rows: Enter the specific items you want evaluated in the rows. For example: "The representative was knowledgeable."
- Option columns: Define your scale in the columns. Microsoft usually defaults to five options, but you can add or delete columns to fit your 4, 5, or 7-point scale.
Step 5: Finalize and review
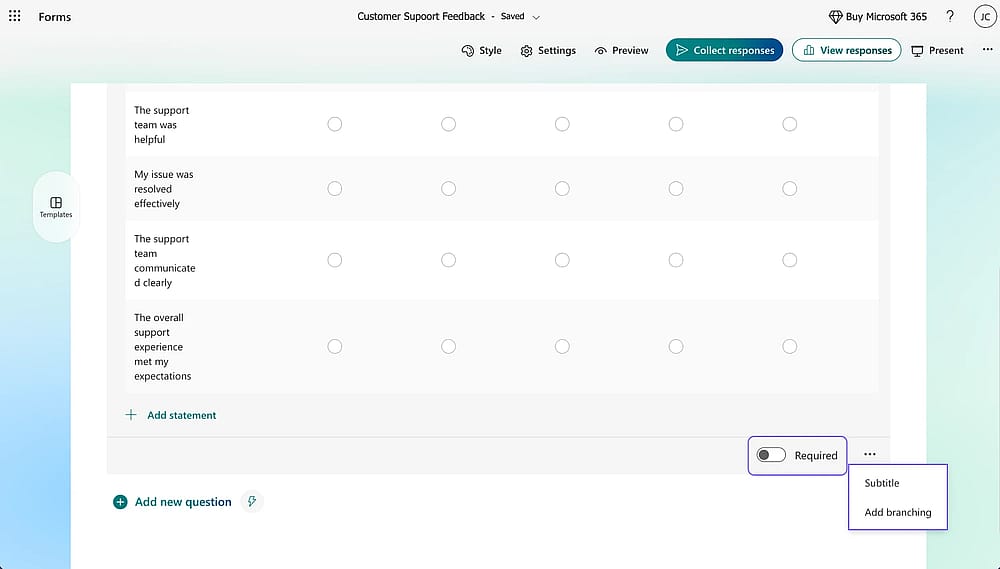
Customize the question
- Required: Toggle the "Required" switch at the bottom if the data is essential.
- Shuffle: Click the three dots (...) if you wish to shuffle the order of the statement rows to reduce bias.
- Preview: Use the Preview button in the top navigation bar. Switch between "Computer" and "Mobile" views to ensure the grid doesn't become too cramped for smartphone users.
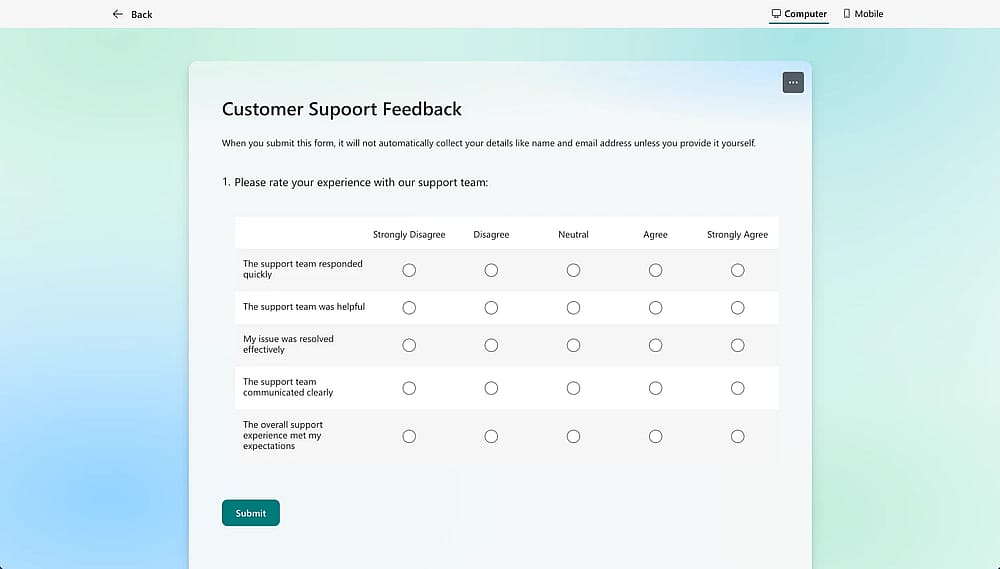
Preview the question
Pro-tips for expert-level surveys
To ensure high-quality data, keep these best practices in mind:
❗ The power of odds: Stick to an odd number of scale points (like 5 or 7). This provides a clear neutral midpoint, which prevents "respondent fatigue" where users feel forced into a stance they don't actually hold.
❗ Consistency is key: Use identical labels for your Microsoft Forms likert multiple answers. If "Strongly Agree" is on the right for one question, keep it on the right for the entire survey to avoid confusing the user.
❗ The "Rule of Seven": Limit your Likert question to 5–7 rows. Any more and the grid becomes a "wall of text," leading to lower completion rates and "straight-lining" (where users click the same column for every row just to finish).
❗ Mobile-first check: Since Likert scales are wide, they can wrap awkwardly on phones. Always check the mobile preview; if the scale looks too busy, consider breaking it into two separate Likert questions.
Limitations of Likert scales in Microsoft Forms
While Microsoft Forms is a convenient tool for those already embedded in the Microsoft 365 ecosystem, it has several "glass ceilings" that power users often hit. Being aware of these limitations is crucial for ensuring you don’t outgrow your tool halfway through a research project.
⬇️ Static design: MS Forms customization is very limited. You cannot adjust the fonts, colors, or column widths of the likert chart independently of the global theme.
⬇️ Ecosystem dependency: Access is restricted to those with a Microsoft 365 subscription, making it less accessible for freelance researchers or small businesses looking for a standalone solution.
⬇️ No templates: Every time you need a Microsoft Forms likert scale, you have to build it from scratch. There are no pre-configured Likert templates to speed up the process.
Creating a Likert scale with forms.app
If you need more control, such as custom scoring, conditional logic, or a polished design, forms.app is a powerful alternative. It bypasses the restrictions of the Microsoft ecosystem, offering a more flexible experience for professional data collection.
1. Log in: Sign up or log in at forms.app.
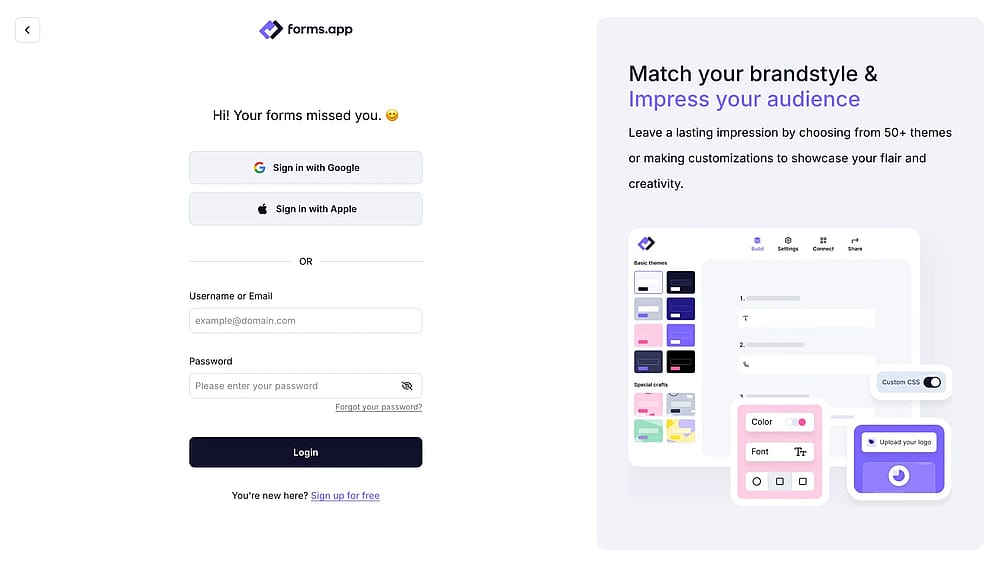
Open your forms.app account
2. Start your form: Choose a blank form or a pre-made survey template.
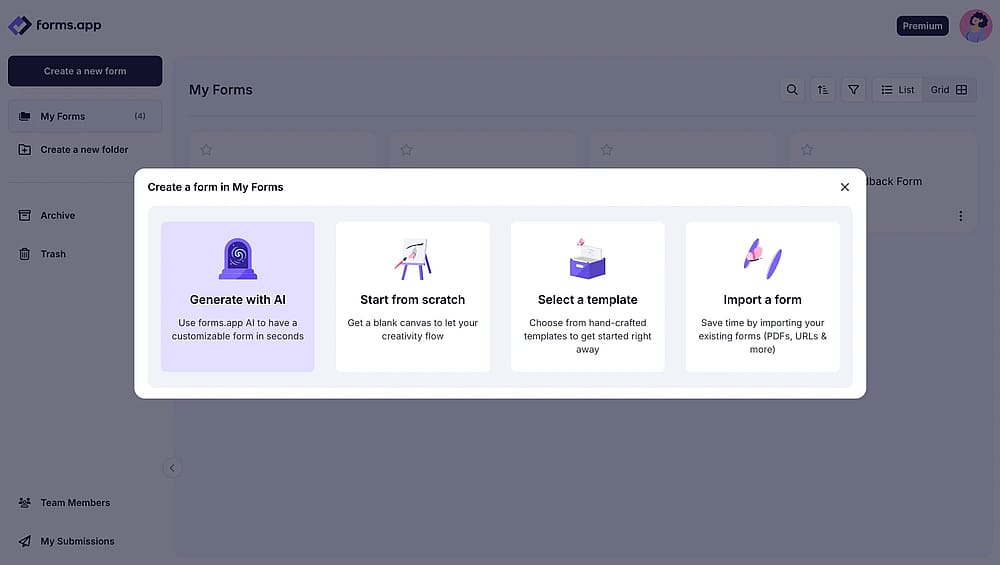
Choose a way to start
3. Add Likert Scale: Select Selection Matrix from the question menu.
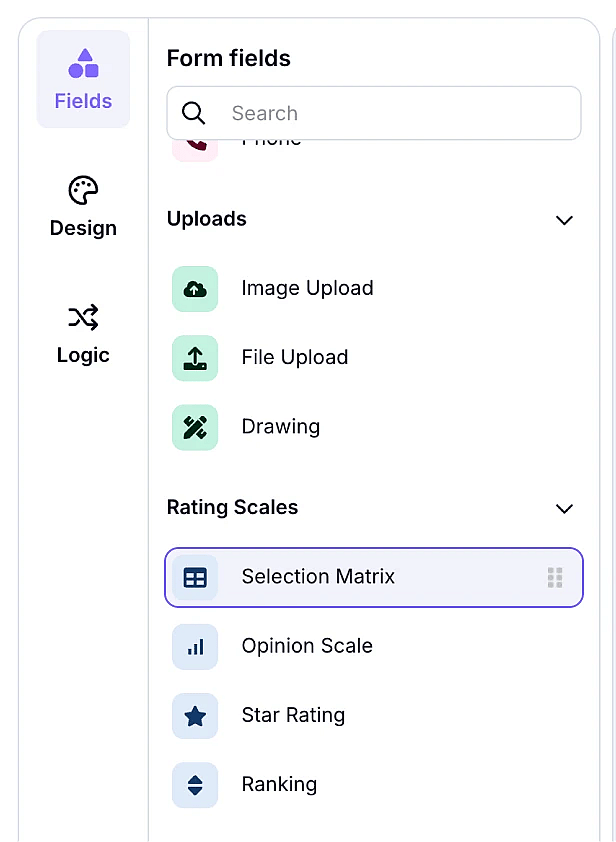
Choose selection Matrix
4. Edit Rows/Columns: Enter your statements and scale labels.
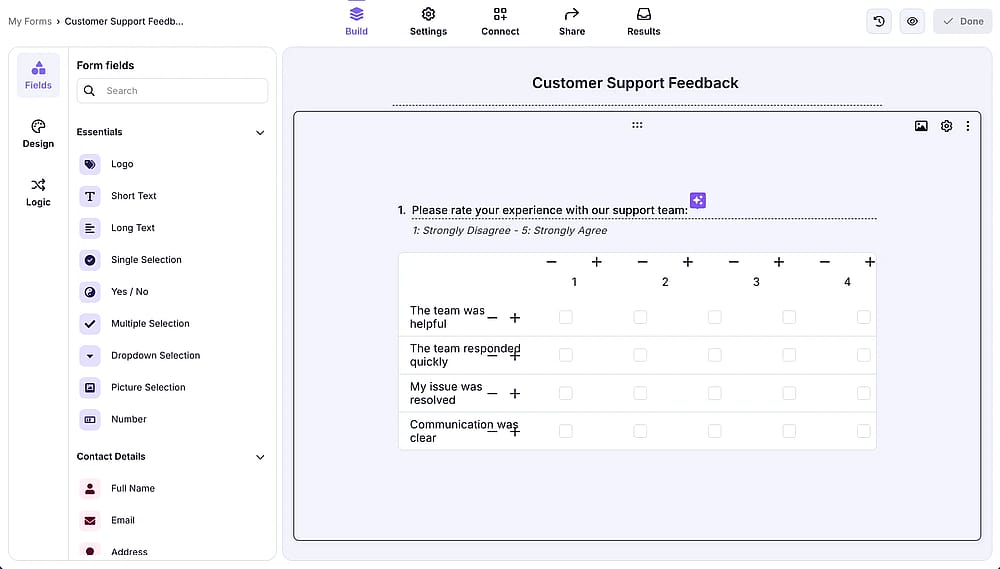
Add details
5. Customize Design: Use the "Design" tab to apply your own branding and colors.
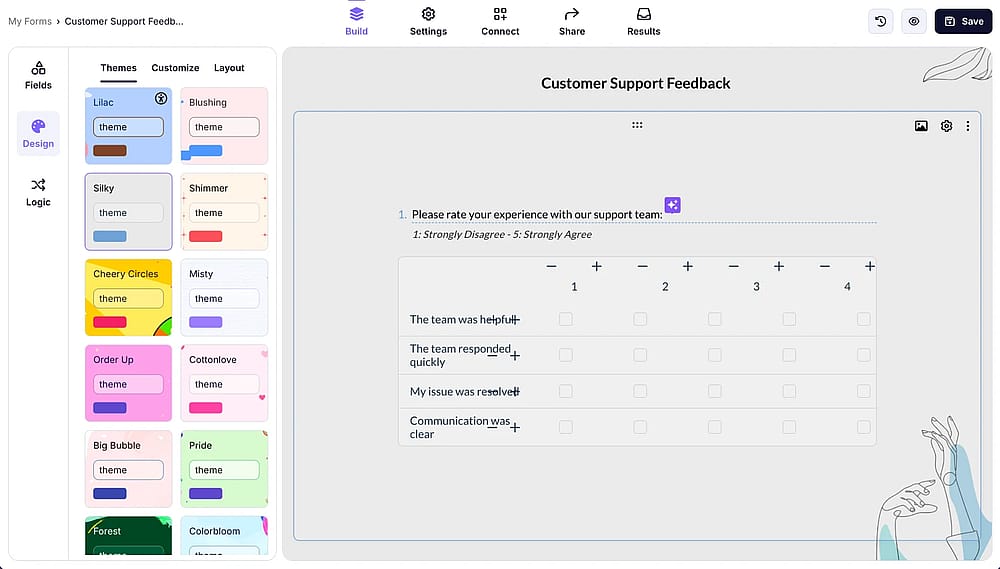
Change the form design
6. Share: Publish and distribute via link, QR code, or website embed.
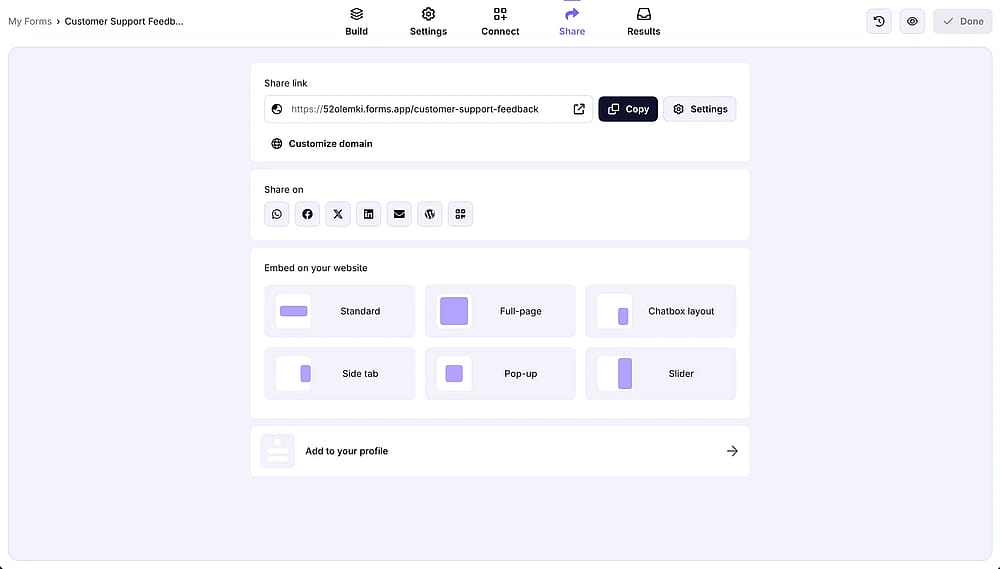
Share the form
Key advantages
Feature | Microsoft Forms | forms.app |
|---|---|---|
Built-in Likert Question | ||
CSS | ||
Integrations | (Limited to M365) | (500+ Apps) |
No Microsoft 365 Required | ||
Advanced Data Analytics |
Conclusion
You’ve now learned how to build the scales, apply design best practices, and navigate the platform's native reporting for your survey questions. However, while Microsoft Forms is excellent for basic internal polls, it has a clear ceiling regarding automated scoring, conditional logic, and the deep analysis of likert scale data.
Unlike a simple rating scale, a Likert grid requires robust tools to be truly effective. If your surveys require more than basic Likert support, forms.app offers the professional flexibility to build exactly what you need and it's free to get started.
Frequently asked questions (FAQs)
Yes, Microsoft Forms automatically generates a visual summary for each question. For Likert scales, it typically uses a stacked bar chart to show the distribution of responses across each statement, allowing you to see sentiment trends at a glance.
A satisfaction type of survey almost always benefits from a Likert scale. Unlike a simple binary (Yes/No) choice, it captures the intensity of a customer's feelings, providing more actionable data for service improvements.
When you see a high volume of negative responses (e.g., "Strongly Disagree"), it is important to look for patterns across different segments. In more advanced tools like forms.app, you can use conditional logic to immediately ask a follow-up question whenever a user provides a negative rating to understand the "why" behind the score.
Generally, a 5-point scale is the standard. Using an odd number provides a neutral midpoint, which helps prevent skewed data that can occur when users feel forced to take a side they don't actually hold.
No. Microsoft Forms provides the count and the bar chart visualization, but it does not assign numeric weights. To calculate a mean score, you must export the survey questions and their data to Excel for manual calculation.
Contributors
Researched & written by
forms.app, your free form builder
- Unlimited responses
- Unlimited questions
- Unlimited team members