Knowing how to create great forms that generate engagement is half of the work to increase your area of success. The other half is knowing how to analyze the data that you have just collected. Whether you would like to know how to view analytics on Google Forms for students or for business, there are several simple steps that you would have to follow.
In this article, we will examine the full guide on how to check the response analytics on Google Forms with a few simple steps and a better way on how to check and receive your analytics with the help of forms.app.
How to check the response analytics on Google Forms (full guide)
The skill of reviewing analytics can be considered the same as learning a new language. Of course, some analytics are easy to read, but the skill of collecting the data and knowing which information you can use and which to discard is what differentiates a good analysis from a bad one:
1. Create your form
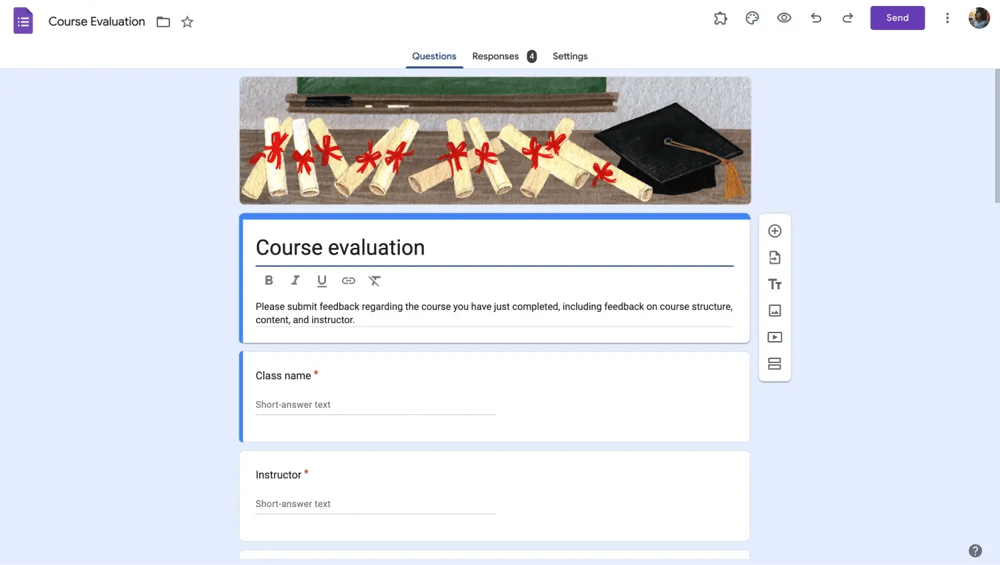
Create your form on Google Forms
The first step in checking your response analytics is creating your form. No matter which topic you are creating a form on, if you are going to collect responses and review analytics, make sure to give enough attention to the contents of the questions and keep the participant as engaged as possible.
💡Try also to have different question types, such as multiple-choice questions and short answer questions. It will come in handy while reviewing your analytics.
2. Share your form and collect your responses
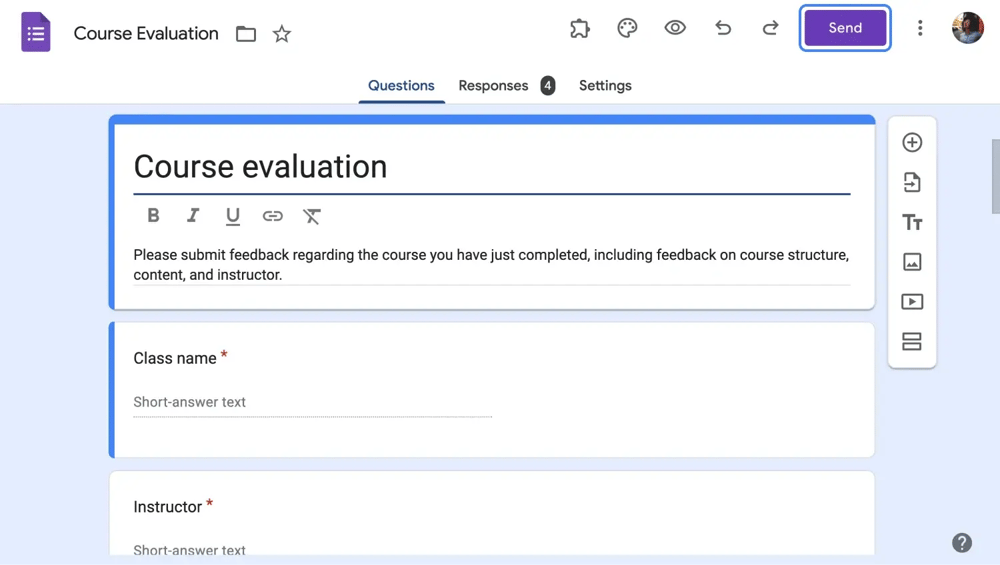
Share your form
After you have completed the creation process of your form, you can share it with the world and start collecting responses. We recommend sending your Google Form responses to multiple email addresses to collect as much data as possible. Collecting enough responses is crucial to checking your response analytics, as it will lead to a more trustworthy data group.
3. Go to the “Responses” tab and view your summary
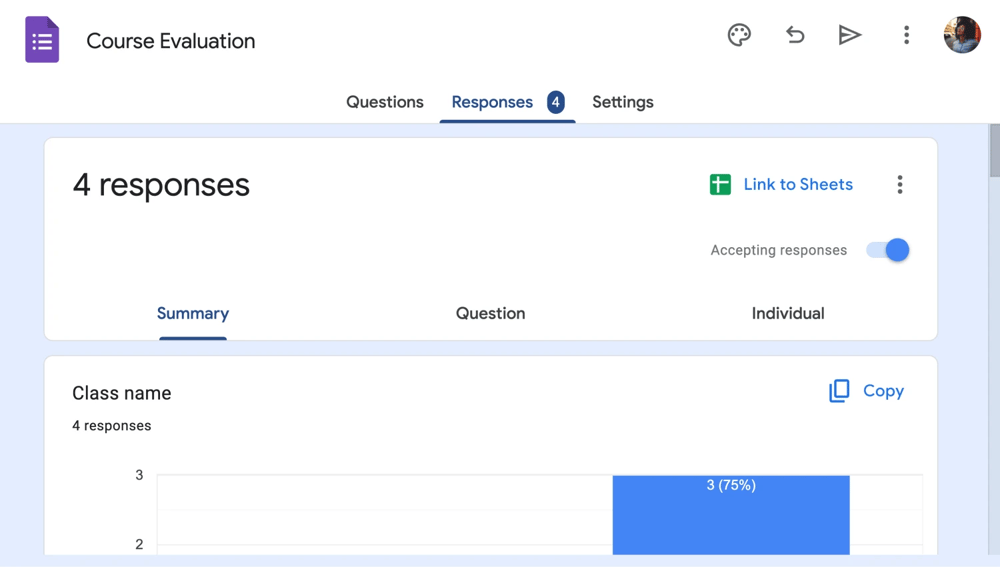
Go to “Responses"
Now that you have created your form, shared it, and collected responses, you can start checking your response analytics. To check your analytics, head to the “Responses” tab and click on “Summary.” The “Summary” section contains a visual list of all of the responses that your form has received until that moment.
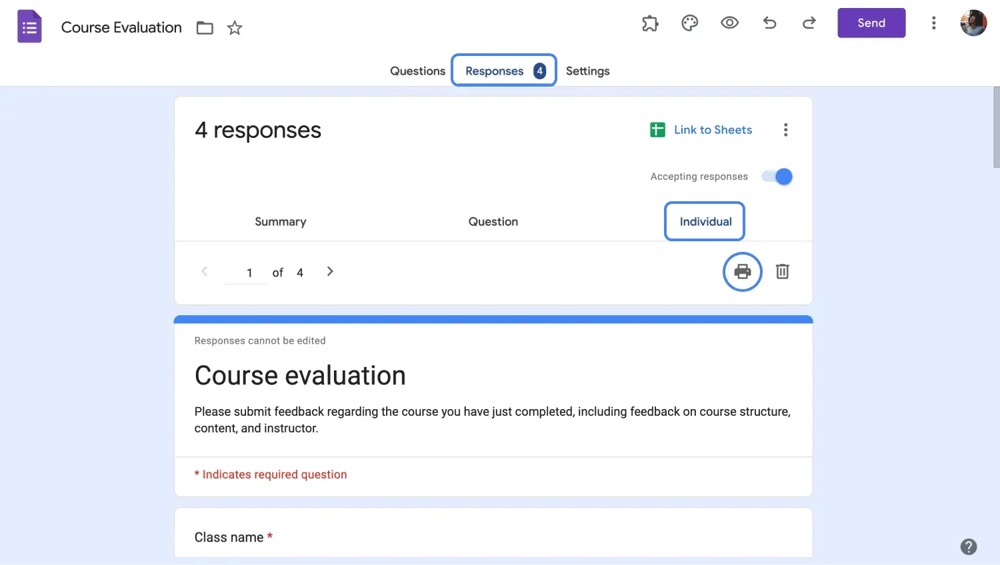
Print the response
You can also view the analysis of results by question under the “Question” tab, view individual responses that you can focus on under the “Individual” tab, or even print responses by clicking the three vertical dots at the top right corner and clicking on “Print all responses.”
4. Review your analytics based on question types
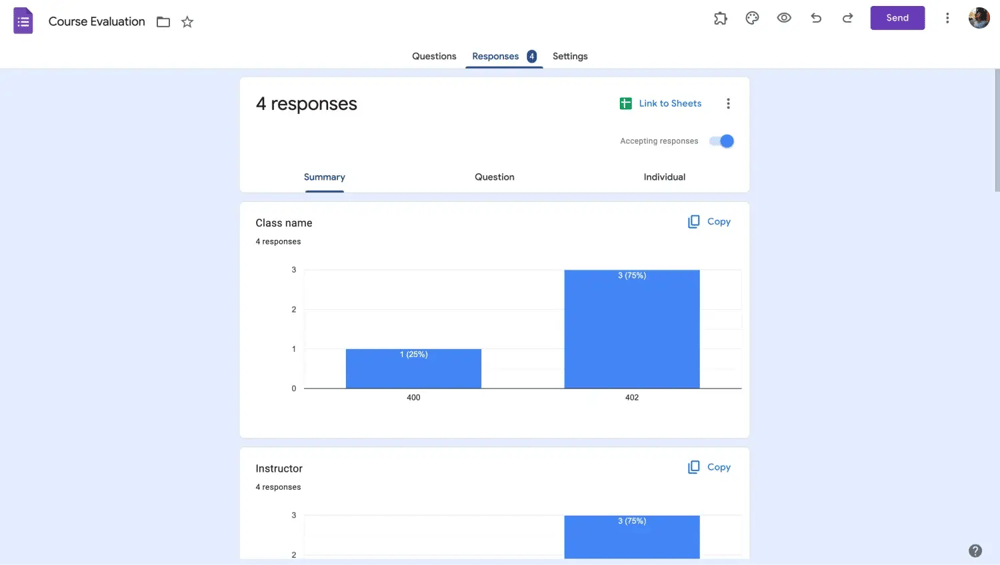
Check the graphs
Every question type has a different visual representation within the “Summary” tab. Therefore, you can differentiate your questions and responses. For example, a multiple-choice question is visualized as a pie chart, and a linear scale format question is visualized as a bar graph.
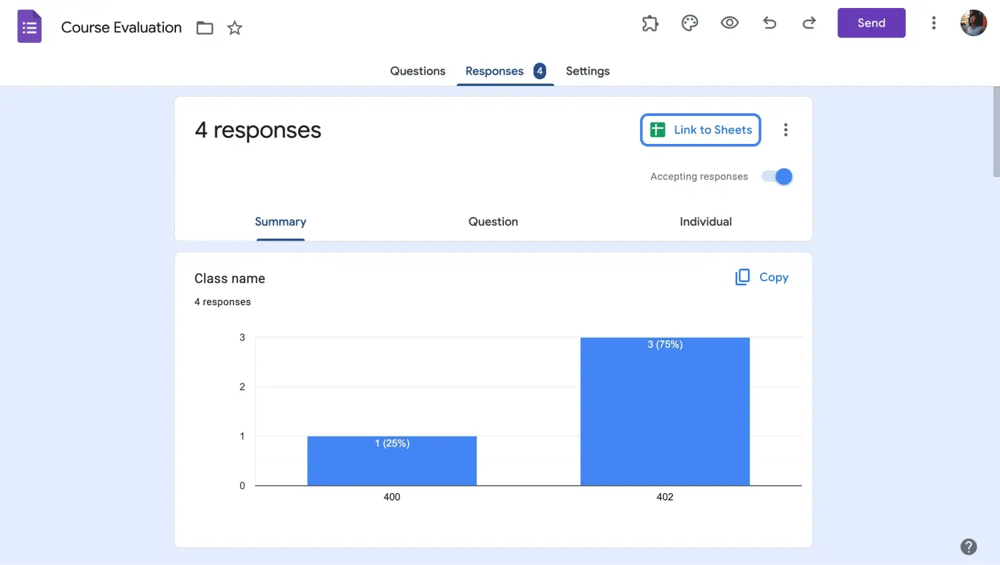
Connect to Google Sheets
However, if you want to create more customized pie charts in Google Sheets, you can import your data and create various charts containing a lot of details, such as color codes for responses and percent representations.
Check the analytics on forms.app
If you would like to have an easier time with checking your analytics, linking your form, and the publishing process, we recommend giving forms.app a try. The accessible interface of forms.app allows you to do everything from one place and eliminate any risk of confusion.
1. The “Results” tab
You can check all of the analytics for the form that you have created from the “Results” tab within forms.app. Within the “Results” tab, you can see the results and responses, how many people have filled it out, and which comments they had about your form and their responses.
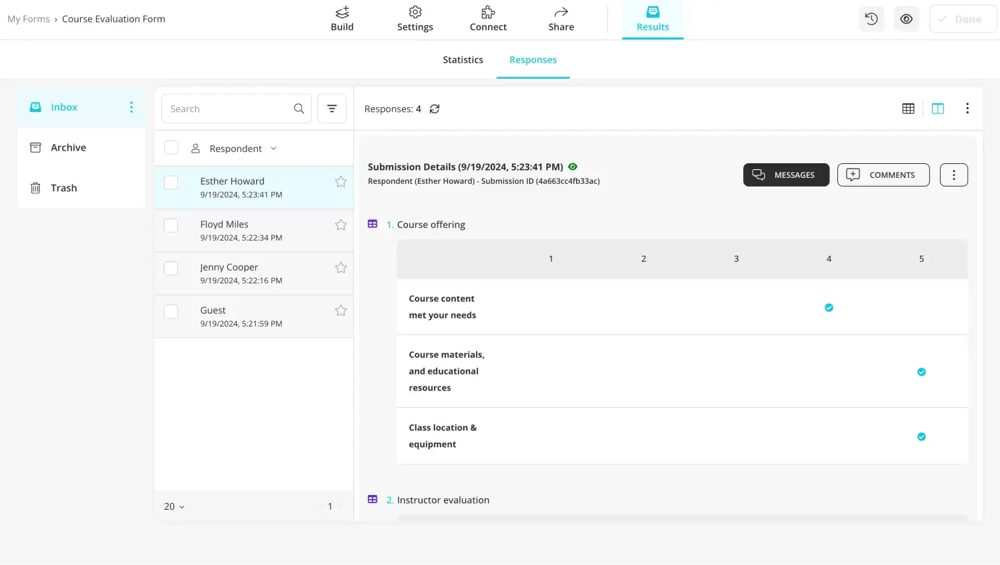
Check the results on forms.app
You can also see the statistics and analytics of your form by going to the “Statistics” tab to see the number of responses, submission percentage, views, and much more. The information about which devices or platforms people have used to fill out your form or where they are from is also available.
2. Linking your form
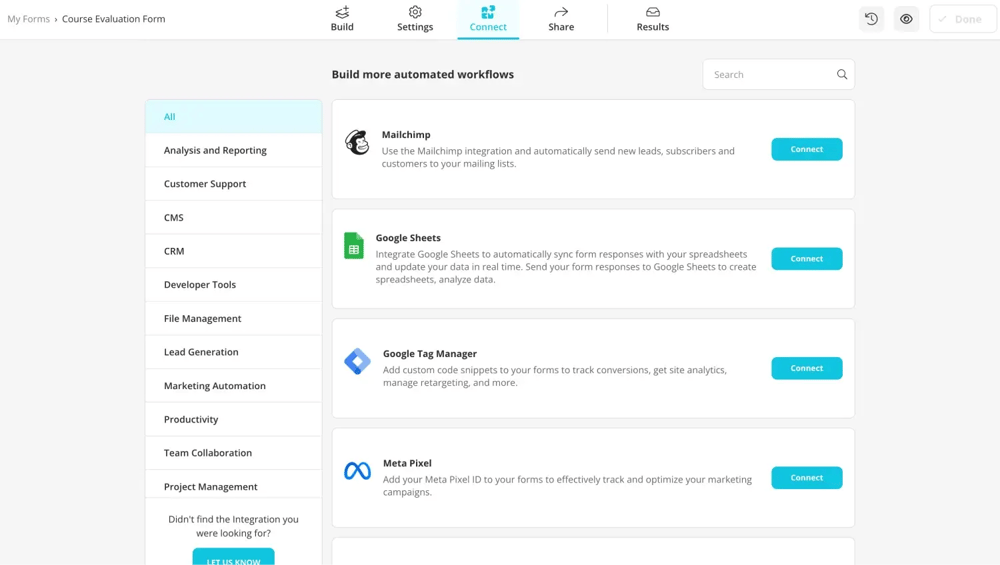
Choose an integration
Linking your form to various databases is also very easy with forms.app. To link your form to whichever database you like, such as Google Sheets, Google Analytics, Google Drive, or Microsoft Excel, head to the “Connect” tab and select the application you would like to connect your form to from various options.
Final words
In summary, the importance of correctly analyzing your results and interpreting the specific meanings of various charts cannot be understated. Therefore, it is crucial to learn how to check a form's analytics, link your responses, and publish your data using Google Forms.
In this article, we have talked about how to check the response analytics of a form, how to review these analytics, how to link your responses, and how to publish them using Google Forms. We have also suggested a better alternative to checking your response analytics, reviewing them, and linking your responses to different databases with the help of forms.app.
Make sure to give the attention that they deserve to your analytics and ensure your success!
forms.app, your free form builder
- Unlimited views
- Unlimited questions
- Unlimited notifications
