How to analyze form responses with ChatGPT & Claude
Summarize with
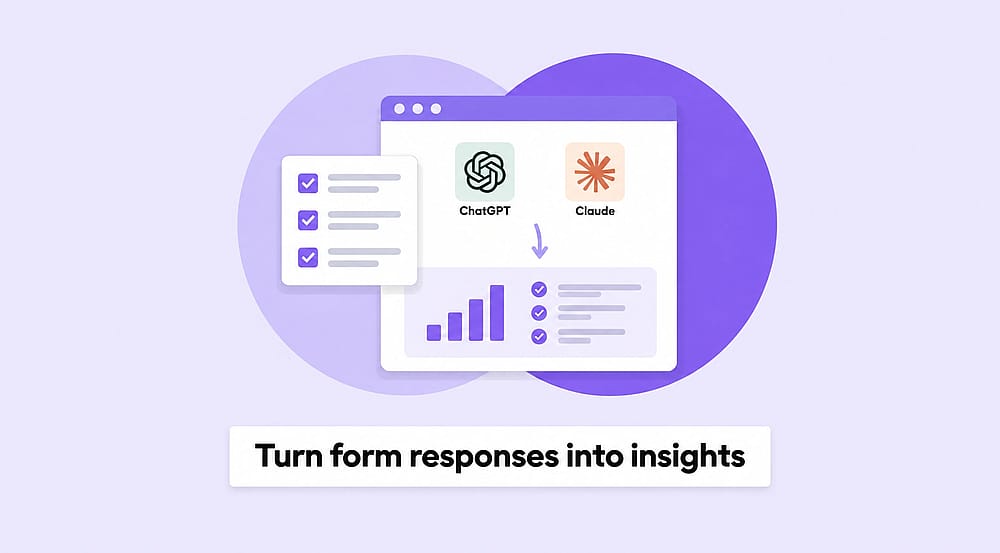
How to turn form responses into actionable insights with ChatGPT and Claude
Collecting data has never been easier. You can create a form, share it with people right away, and start receiving responses within minutes.
But what happens next?
Having hundreds or even thousands of responses doesn't automatically mean you understand your audience, customers, or employees. The real value of data comes from knowing how to interpret it, identify patterns, and turn findings into meaningful decisions.
This is where AI tools like ChatGPT and Claude can make a difference.
Instead of manually reviewing every response or spending hours organizing spreadsheets, you can connect your form data to AI, ask questions in natural language, explore trends, and create reports tailored to your needs.
Let's explore how this works.
Take a look at the guide to learn how to connect forms.app with Claude or ChatGPT.
Data collection is only the beginning
Imagine you've collected 500 customer feedback responses.
You have ratings, multiple-choice answers, written comments, and suggestions. There's plenty of useful information, but finding meaningful patterns across all those responses can take time.
You might want to know:
- What are the most common customer complaints?
- Which aspects of your service receive the highest ratings?
- Are there recurring themes in negative feedback?
- What improvements do customers recommend most often?
- How does customer satisfaction differ across categories?
These are questions your data can help answer.
The challenge isn't necessarily collecting more information. It's knowing what to ask and how to interpret the answers.
Connect your form data to ChatGPT or Claude
With forms.app, you can connect your form workflows to AI tools and work with your collected data through conversation.
There are two ways to explore this workflow:
With forms.app for ChatGPT, you can work with your forms and responses directly through ChatGPT. You can explore your collected information, request analyses, and generate visual representations of your data.
You can also connect forms.app to Claude through its MCP integration. This allows you to interact with your forms and response data within Claude and use natural language prompts to explore your information.
Once connected, you can move beyond simply viewing responses. You can start asking questions about them.
Ask AI questions about your form responses
One of the most useful aspects of connecting your data to AI is the ability to investigate it from different perspectives.
Rather than relying on a predefined report, you can ask questions based on what you actually want to discover.
For example, if you're analyzing a yoga class feedback form, try these prompts:
Understand participant satisfaction
"Analyze the overall class ratings. How many participants rated the class positively, and what does the distribution of ratings tell us about their experience?"
Evaluate instructor performance
"Compare the instructor's clarity ratings with participants' favorite aspects of the class. Identify any differences between how much they appreciate the instructor's style and how clearly they understand the instructions."
Identify areas for improvement
"Analyze participants' suggestions for improving the class. Rank the most requested changes by frequency and recommend which ones we should prioritize."
Discover unexpected patterns
"Explore the relationship between studio comfort, overall class ratings, and instructor clarity. Identify any interesting patterns that could help us understand what influences participants' experiences."
You can also ask follow-up questions to explore specific findings in more detail.
For example, if AI identifies a connection between studio comfort and lower class ratings, you can ask it to investigate this relationship further and suggest what additional feedback we should collect to understand the reasons behind it.
This makes data analysis a more interactive process. You're not limited to a fixed set of charts or predefined questions.
Turn your data into custom charts and tables
Numbers and written summaries are useful, but visual representations can make complex information much easier to understand.
With AI, you can request visualizations based on the questions you're trying to answer.
Depending on your data and the AI tool's capabilities, you can request:
- Pie charts: Understand how responses are distributed across different options.
- Bar charts: Compare ratings, categories, or frequently mentioned topics.
- Tables: Organize detailed findings and comparisons.
- Summary dashboards: Bring key metrics and important findings together.
- Trend visualizations: Explore changes over time when your data includes dates.
The interesting part is that you can decide what you want to see.
Create reports you can actually share
Whether you're presenting customer feedback to your team, sharing survey results with management, or preparing a research summary, a well-organized report can make all the difference.
You can ask AI to bring your analysis together in a structured document.
For example:
"Turn this analysis into a professional report. Include an executive summary, key findings, relevant charts, comparison tables, and actionable recommendations. Organize the information into clearly labeled sections and prepare the document as a PDF."
You can also specify the audience, report length, visual style, and the type of information you want to emphasize.
The result can be a report tailored to your needs rather than a generic overview of your responses. PDF export depends on the capabilities of the AI tool you're using.
A practical example: Analyzing feedback
Let's put everything together. Imagine a company has collected responses through a feedback form created with forms.app.
Here's how the workflow could look:
Step 1: Collect responses
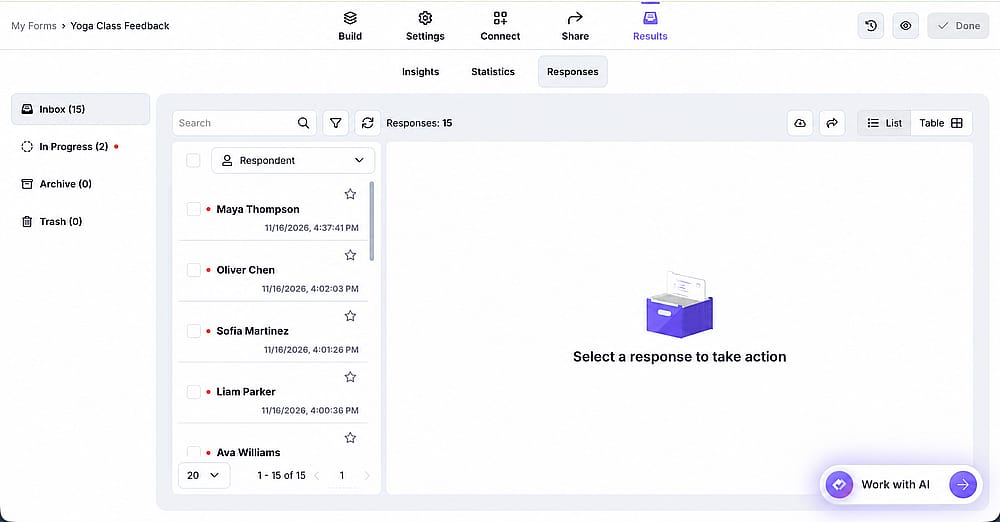
Check the responses
Check your responses.
Step 2: Connect your data
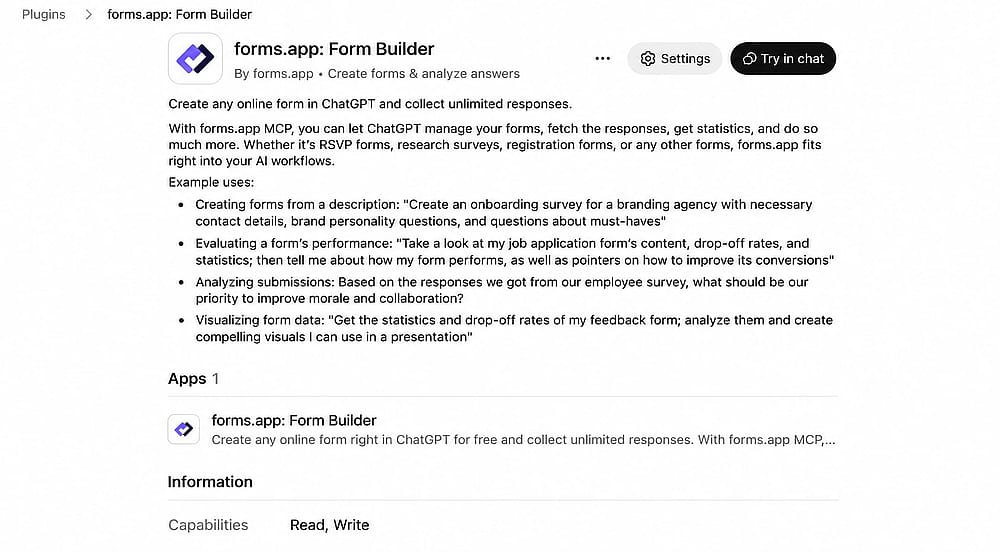
Connect your forms.app account with Claude or ChatGPT
Connect forms.app to ChatGPT or Claude using the available integration.
Step 3: Explore your responses
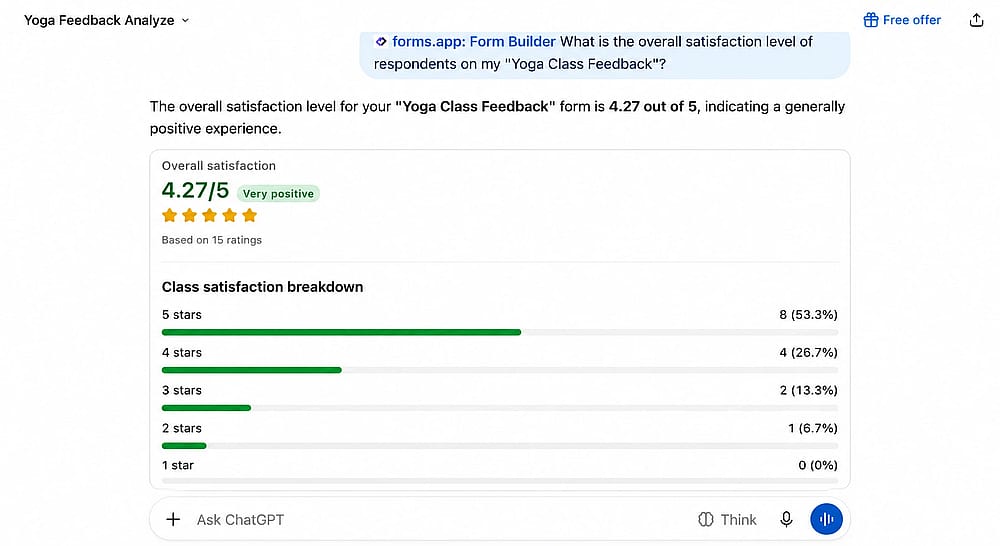
Ask questions
Ask AI to identify recurring themes, compare satisfaction ratings, and highlight common complaints.
Step 4: Visualize the findings
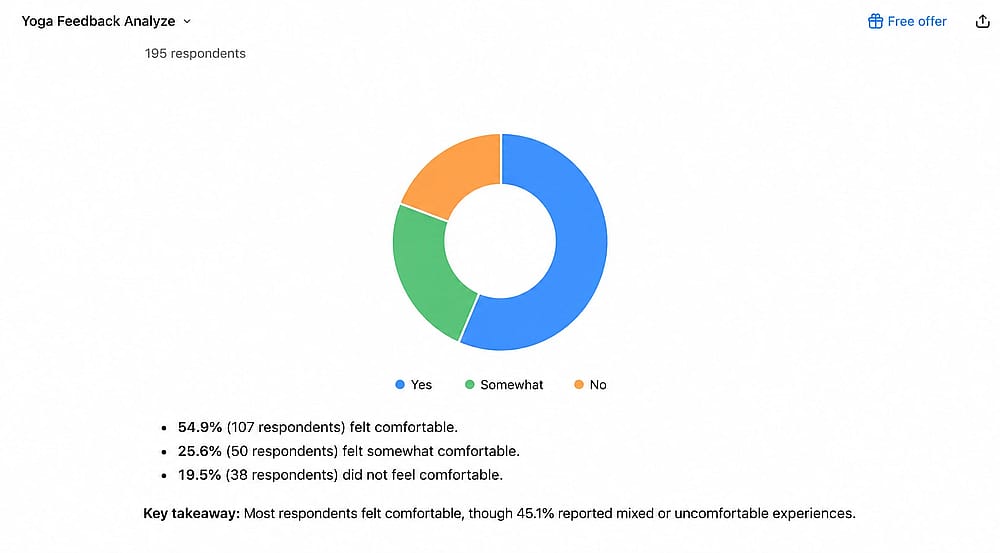
Generate charts with AI
Request charts and tables that make the results easier to understand.
Step 5: Prepare a report
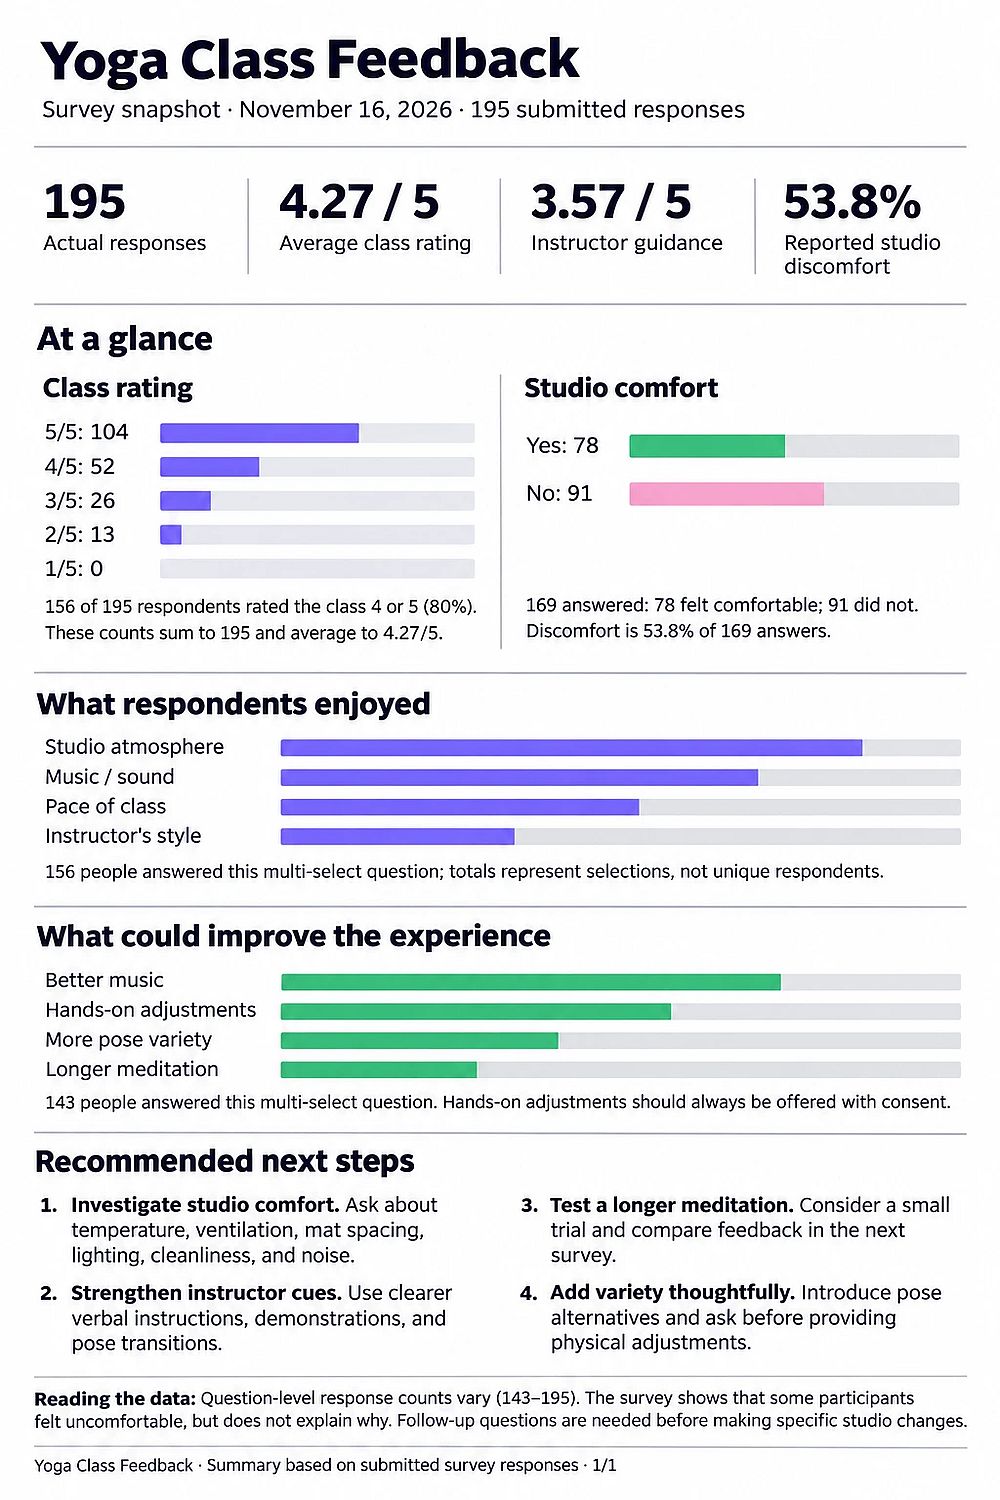
Generate reports with AI
Bring the key findings together in a structured report that you can share with your team.
In just a few steps, you've moved from collecting feedback to understanding what your customers are actually telling you.
Don't just collect data - Make more out of it.
Creating forms and collecting responses are important parts of any data-driven workflow. But they're only the beginning.
The real opportunity lies in exploring the information you've collected, asking better questions, and using the answers to make more informed decisions.
By connecting forms.app to AI tools like ChatGPT and Claude, you can make your form data part of a much more flexible analysis process.
You don't have to settle for simply knowing how many people answered your form.
You can discover what those answers mean, visualize the findings, and turn them into reports that help you take the next step.
Your data. Your questions. Your insights.
Contributors
forms.app, your free form builder
- Unlimited responses
- Unlimited questions
- Unlimited team members