Understanding the type of data you're working on is crucial for your data gathering and analysis. Data can be qualitative or quantitative, coming from a variety of sources. Data that is descriptive and extensive is referred to as qualitative data. Numerical data is quantitative.
There will be several factors in your dataset that can be captured with different degrees of accuracy. There are four primary levels of measurement scale type: nominal, ordinal, interval, and ratio. This article will explain the definition of a scale of measurement, a description of four scales and examples, and the best question types for measurement scales in research.
What is a scale of measurement?
The scales of measurement show the accuracy with which variables are captured. A scale of measurement is a system or framework for classifying and quantifying mutable characteristics. Numbers or categories express the features of the variables evaluated in this technique.
The scale of measurement, also known as the level of measurement, describes the accuracy level that may be achieved while recording data. These four measuring scales were created by Stanley Smith Stevens in 1946.
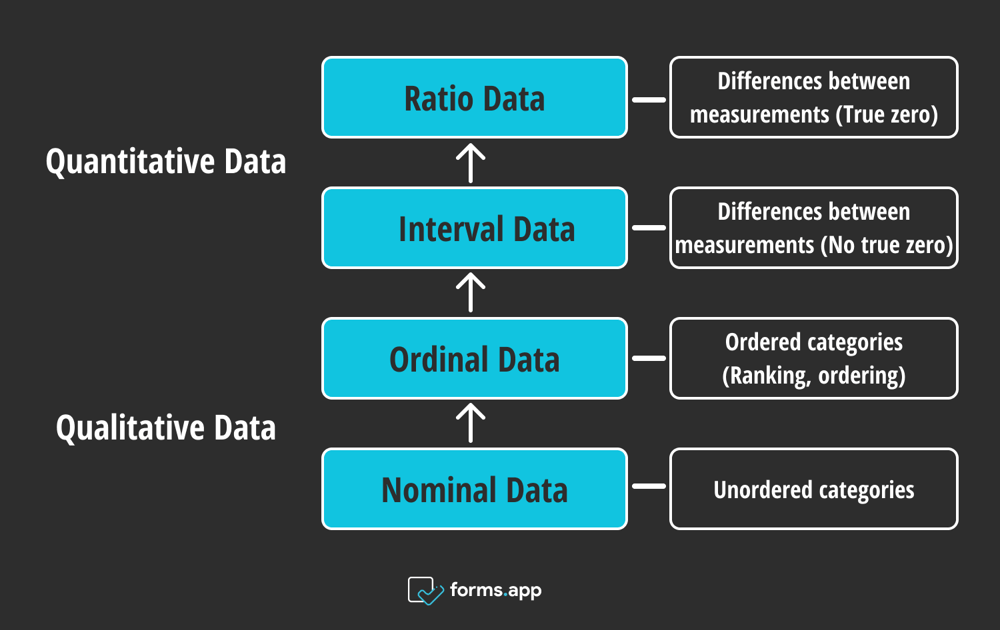
The four main measuring scales are nominal, ordinal, interval, and ratio. These levels are listed in increasing order of the detailed information they provide. The complexity and accuracy of the degree of measurement are ranked from low (nominal) to high (ratio) in a hierarchy.

The four main measuring scales
1. Nominal scale
The nominal scale is the first level of measurement. Numbers are used solely for identifying an object. This assessment addresses only non-numeric factors or situations where numbers have no meaning. The nominal scale is the simplest of the four variable measuring scales.
Your data can be categorized by grouping them into mutually exclusive labels; however, there is no hierarchy among the categories. This scale’s variable numbers are only labels for grouping or dividing the variables. If these values have no quantitative meaning, making any calculations based on them is useless.
Nominal scale examples
Notice that all the scales are mutually exclusive, and none have any numerical significance. Some examples are given below to better explain the nominal scale.
#1 - What is your favorite car brand?
- Toyota
- Ford
- Mercedes-Benz
- Jeep
- Audi
- Ferrari
- BMW
Only the brand names are significant to the poll's consumer researcher in this question. For these brands, there is no need for a particular order. When collecting nominal data, however, researchers examine the data using pertinent tags.
When a survey respondent chooses Toyota as their favorite brand, the selected option will be “1” in the measurement scale example above. This made it easier to quantify and respond to the last query, which asked how many respondents selected Toyota, Audi, and Ford, and which was the highest. The nominal scale is the most fundamental research scale and is the foundation for quantitative research.
2. Ordinal scale
The ordinal scale, the second measurement level, reports the ranking and ordering of the data without determining the degree of variance among them. Ordinal data is quantitative information with naturally existing orders, and how they vary is uncertain.
An ordinal scale is a variable measurement scale in statistics used to show the order of variables rather than the differences between them. Generally, these scales represent non-mathematical concepts like pleasure, happiness, and frequency.
Ordinal scale examples
The ordinal scale often measures satisfaction, preferences, frequency, and agreement. Below, we have shared a sample question that a health research company used to measure the monthly exercise frequency of individuals. You can better understand the ordinal scale by examining the example below:
#2 - How often do you exercise?
- Very often
- Often
- Sometimes
- Rarely
- Never
Researchers can use the ordinal scale to acquire more data than they would with a nominal scale. The order of the answer options in this case, as well as their labeling, is crucial. The researcher finds it convenient to analyze the findings according to the results’ order and name.
3. Interval scale
The interval scale is the third of four measurement levels. The interval scale is a quantitative measuring scale with order, significant and equal differences between the two variables, and arbitrary zero presence.
The interval scale measures variables along a standard scale at equal intervals. The measures used to calculate the distance between the variables are highly reliable. These scales are effective as they open doors for the statistical analysis of provided data.
Interval scale examples
Interval measurements can be used to assign metrics to data values. No real zero point exists, but you may categorize, rank, and infer equal gaps between adjacent data points. The following example may make the interval scale easier to understand.
The Celsius and Fahrenheit temperature scale is a well-known example of an interval scale since “0” is arbitrary because negative temperature values can exist. The difference between these two temperatures, 50 and 30 degrees, is equal to the difference between 30 and 10 degrees; hence 50 is always higher than 30.
4. Ratio scale
The ratio scale is the fourth level of measurement in research and has a zero point or character of origin. A ratio scale of measurement is quantitative, with absolute zero and equal gaps between nearby points. The ratio scale has no negative values since there is a zero value.
Researchers can use the ratio scale to work on data by determining the mean, median, and mode for a central tendency. The ratio scale cannot be “0” because of zero. When a researcher wants to utilize a ratio scale, he must consider the qualities of the variable and if it has all of the required features.
Ratio scale examples
Physical properties of people and objects may be quantified using ratio scales; consequently, height, weight, and kilogram calories are instances of ratio measurement. Below are examples of ratio scales; you can better understand the ratio scale by looking at these examples:
# 3 - What is your current weight in kilograms?
- Less than 49 kilograms
- 50- 69 kilograms
- 70- 89 kilograms
- 90- 109 kilograms
- More than 110 kilograms
Weight in kilograms is an excellent example of ratio data. If something weighs 0 kilos, it weighs nothing, especially when compared to temperature, where a figure of zero degrees represents no temperature but rather extremely cold.
Best question types for measurement scales
The question type determines the data type created by a survey, and the data type limits the data analysis that may be conducted. The most frequent survey question is an interval rating scale question, which we utilize to record the respondent’s degree of sentiment about the issue of interest.
Ordinal questions commonly feature a list of response alternatives, but the answer list is distinguished by the fact that the response options are ordered somehow. The ratio scale questions occur when respondents are requested to answer to a physical measure. Here are the best question types listed for measurement scales:
1 - Open-ended questions
Asking open-ended questions is a great way to learn more about a topic. When you request an open question, you allow the other person to elaborate and provide a detailed explanation. A nominal scale can be used for open-ended question type. You can ask how, what, why, when, explain, and describe questions like the example below.
- What is your favorite color?

Open-ended question example
2 - Rating questions
Rating questions enable participants to weigh or assign numerical values to responses using a graphical interface, employing a basic 1-5 star rating system or 0-100 slider scale where a higher number equals a better score. Ordinal scales and interval scales can be used for rating question types.
- How likely are you to recommend this product to a friend?

Rating question example
3 - Likert scale questions
Likert scale questions are critical in determining a respondent's opinion or attitude toward a particular issue and are essential to market research. A Likert is a five, seven, or nine-point agreement scale used to assess respondents’ agreement with various claims. Interval scales and ordinal scales can be used for Likert scale question types.
- What was your level of satisfaction with our product?
- Extremely satisfied
- Very satisfied
- A little satisfied
- A little dissatisfied
- Not satisfied at all

Likert scale question example
4 - Multiple choice questions
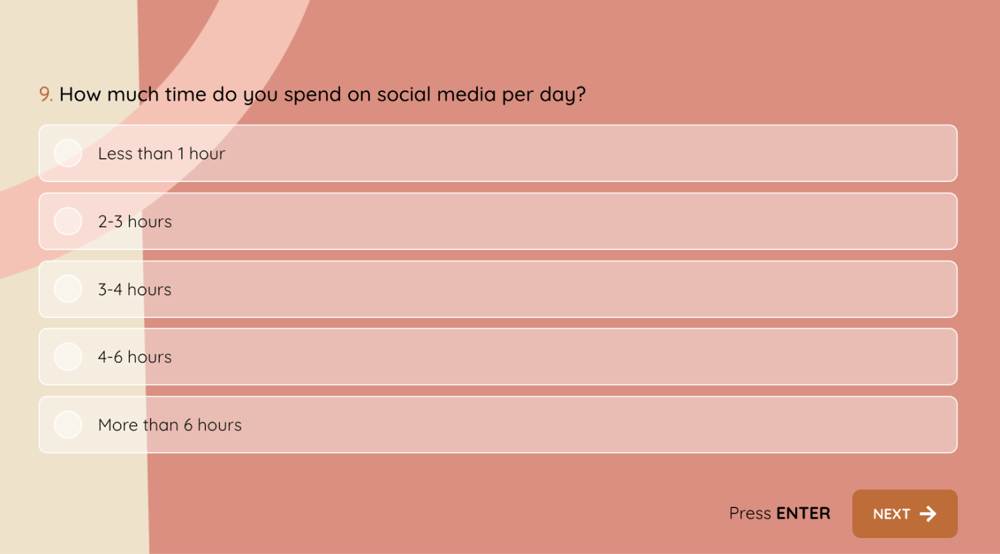
Multiple-choice questions are classic surveys because they provide respondents with multiple choices. They can contain single or multi-select options. Ratio scales and nominal scales can be used for multiple-choice questions:
- How much time do you spend on social media per day?
- Less than 1 hour
- 2-3 hours
- 3-4 hours
- 4-6 hours
- More than 6 hours

Ratio scale multiple-choice question example
What is your favorite phone brand?
- Apple
- Samsung
- Xiaomi
- Oppo
- Huawei

Nominal scale multiple-choice question example
Frequently asked questions about levels of measurement
The Likert scale is a type of ordinal scale. The Likert scale assesses respondents’ attitudes or levels of agreement and disagreement on a subject by asking them to select from a list of answer alternatives such as “strongly agree,” “agree,” “neutral,” “disagree,” and “strongly disagree.” The selections are arranged in a positive to negative sequence, reflecting a rating of views or levels of agreement.
A nominal scale is a measuring scale that divides variables into different categories or groups with no regard for the order or size of the types. On the other hand, an interval scale is a measuring scale that categorizes variables and measures the magnitude or distance between them meaningfully and consistently.
The significant distinction between a nominal scale and an interval scale is that a nominal scale does not quantify the distance or size between the categories, but an interval scale does.
The nominal scale is the most basic measure for categorizing data into groups or categories. In contrast, the ratio scale is a more sophisticated measuring scale that categorizes data, specifies the order, and creates meaningful gaps between values.
The ratio scale offers a more accurate variable measurement with meaningful intervals and a zero point, allowing for mathematical operations, as opposed to the nominal scale, which categorizes data into categories without any order or ranking.
Ordinal and interval are differentiated based on the particular requirements of the analysis being done. Because the items in Likert scale inquiries have a distinct rank order but an uneven distribution, Likert scales are typically regarded as ordinal data.
Sometimes, the overall Likert scale scores are seen as interval data. These scores have equal spacing between them and directionality.
Ordinal and interval scales are two of the four primary categories of data or classifications. Both data kinds accommodate the necessity to categorize and communicate information. Data quantities are also measured in terms of ordinal and interval data.
Ordinal scales have unordered categories with a defined order or ranking, but interval scales have ordered categories with equally measured intervals between them. This is the primary distinction between ordinal and interval scales.
A nominal scale is a scale in which variables are only “named” or “labeled” without regard to their order. Beyond merely identifying them, the variables on an ordinal scale have a precise order.
A nominal scale is a measuring scale that divides data into unique, unrelated groups without any innate hierarchy or order. On the contrary, an ordinal scale is a measuring scale that ranks or orders data according to some trait or feature.
The interval scale and the ratio scale are two quantitative scales that are used to quantify variables in research or statistics. While they have certain similarities, they also have significant distinctions.
The interval scale lacks a genuine zero point, whereas the ratio scale has one. When compared to variables measured on an interval scale, this distinction enables more complex mathematical operations on variables recorded on a ratio scale.
The interval scale provides a controlled and regulated method for collecting, analyzing, and interpreting data, which aids in the generation of insights and the making of informed decisions in a variety of sectors.
Interval scales work well in surveys where respondents must provide temperature, time, and date variables. Interval scales may be readily integrated into multiple-choice or rating scale questions by asking respondents to rate using a numerical scale. Here are some common uses of interval scale:
- Surveys and questionnaires: The interval scale is extensively used in the design and administration of surveys or questionnaires. You can use an interval scale when create a survey. Respondents can score or rank objects on a scale, which allows researchers to obtain quantitative data for the study.
- Market research: In market research, an interval scale is used to assess client preferences, satisfaction levels, and buy intent. It aids in the analysis and interpretation of client feedback or ratings, helping organizations to make educated decisions.
- Measurement and quantification: By giving numerical values to distinct properties or variables, the interval scale provides for exact measurement and quantification of data.
forms.app, your free form builder
- Unlimited views
- Unlimited questions
- Unlimited notifications


