In today’s complex landscape of business strategy, tools, models, and frameworks matter more than ever before. They help us evaluate the current status, develop new ideas, and make more informed decisions. They also offer a structured approach and help companies navigate uncertainties. You can benefit from these tools to mitigate risks and optimize resource allocation as well.
Today, we will cover one of these powerful tools: The Value Curve. It offers a holistic view of your business’ competitive landscape. It also provides insights into opportunities for differentiation and innovation. We will cover this useful tool with many of its aspects, including its advantages, suitable environments and how/when to use it.
What is the value curve?
The value curve is a strategic framework visualizing the value proposition of products or services relative to competitors in existing markets.
It shows key attributes or factors that customers consider important with a horizontal axis. The vertical axis represents the level of the value delivered.
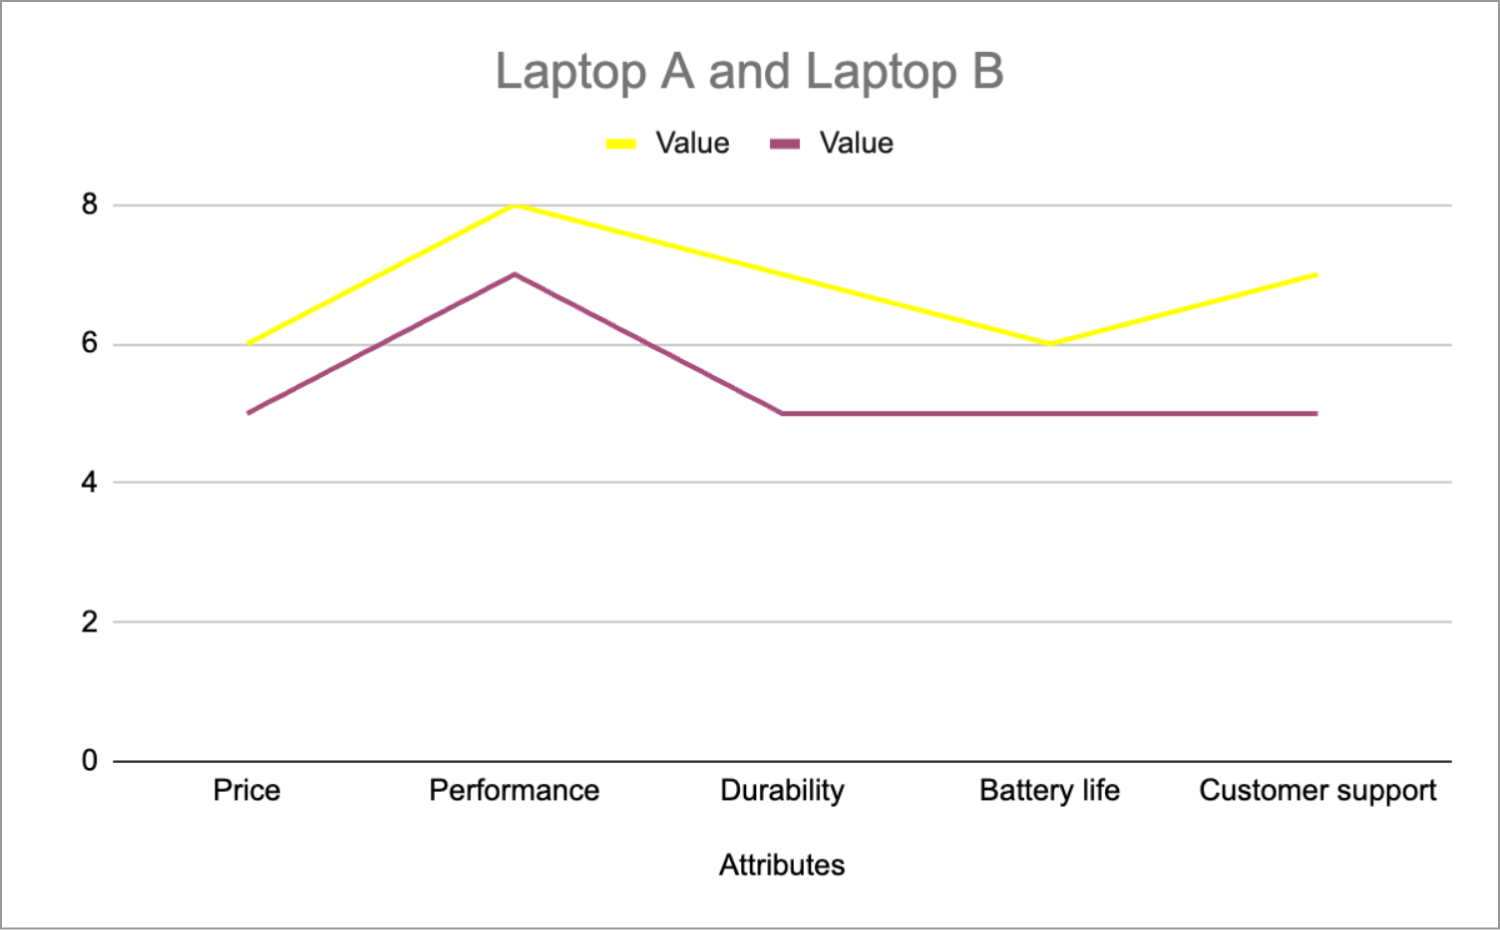
An example of value curve
By analyzing this curve, businesses can identify areas where they excel compared to their competitors and areas where they lag behind. They can compare the value curves and create unique opportunities to meet customer needs and preferences. It also helps companies to understand where they can innovate and focus their efforts to gain a competitive advantage in the market.
How to draw your own value curve
Drawing your own value curve model involves several steps. Although the attributions and values may change in accordance with different organizations and industries, the general steps to drawing a value curve template remain mostly the same. Here are some useful tips:
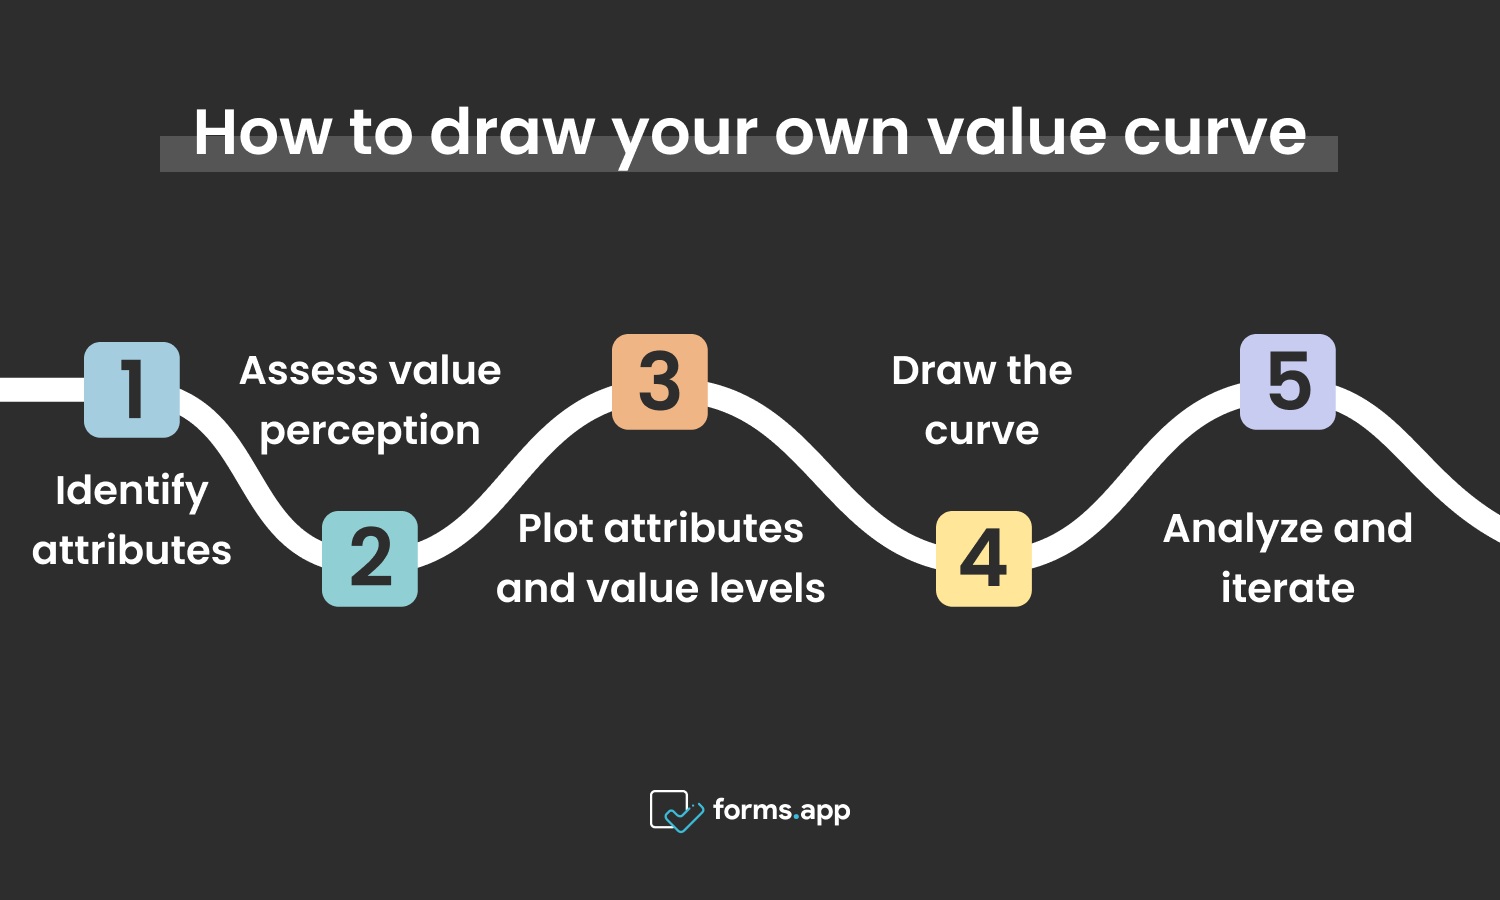
Steps to draw your curve
- Identify attributes: Determine key attributes important to customers when evaluating products or services.
- Assess value perception: Evaluate the perceived value of each attribute relative to the competitor.
- Plot attributes and value levels: Create a graph with attributes along the horizontal axis and corresponding value levels along the vertical axis.
- Draw the curve: Connect points representing value levels of each attribute to create the value curve.
- Analyze and iterate: Identify areas of strength and weakness, informing strategic decisions for improvement and differentiation.
A value curve example
The Value Curve is a visual concept and it is hard to understand it simply by text. Let’s use it in a hypothetical scenario, in which a large corporation uses it for connecting the values and attributes of their new product.
Let’s say Dell, one of the prominent computer technology companies, launches a laptop model (Laptop A) in a highly competitive market. They decide to draw a value curve to outline the key attributes of Laptop A and their formel model Laptop B to differentiate it from competitors and meet the needs of its target market effectively. Here are the attributes of Laptop A:
- Price: Laptop A is more cost-effective, which is better for cost-conscious users.
- Performance: Laptop A delivers more reliable performance for everyday tasks, such as web browsing, productivity, and multimedia consumption.
- Durability: Laptop A has a more robust build quality and durable materials to withstand daily use and occasional travel.
- Battery life: Battery life of Laptop A provides long,lasting usage without frequent recharging, which enhances mobility.
- Customer support: The company provides responsive customer support services for Laptop A than Laptop B, including warranty coverage and technical assistance.

A value curve template
When to use the value curve
The value curve is a strategic tool to use in various business contexts to understand and analyze the unique value proposition of a product or service in existing market spaces (blue ocean strategy). You can also use it to create uncontested market spaces (red ocean strategy). It can serve as an action framework, the key factors of competition are important in this context.
Here are some reasons to conduct value curve analysis:
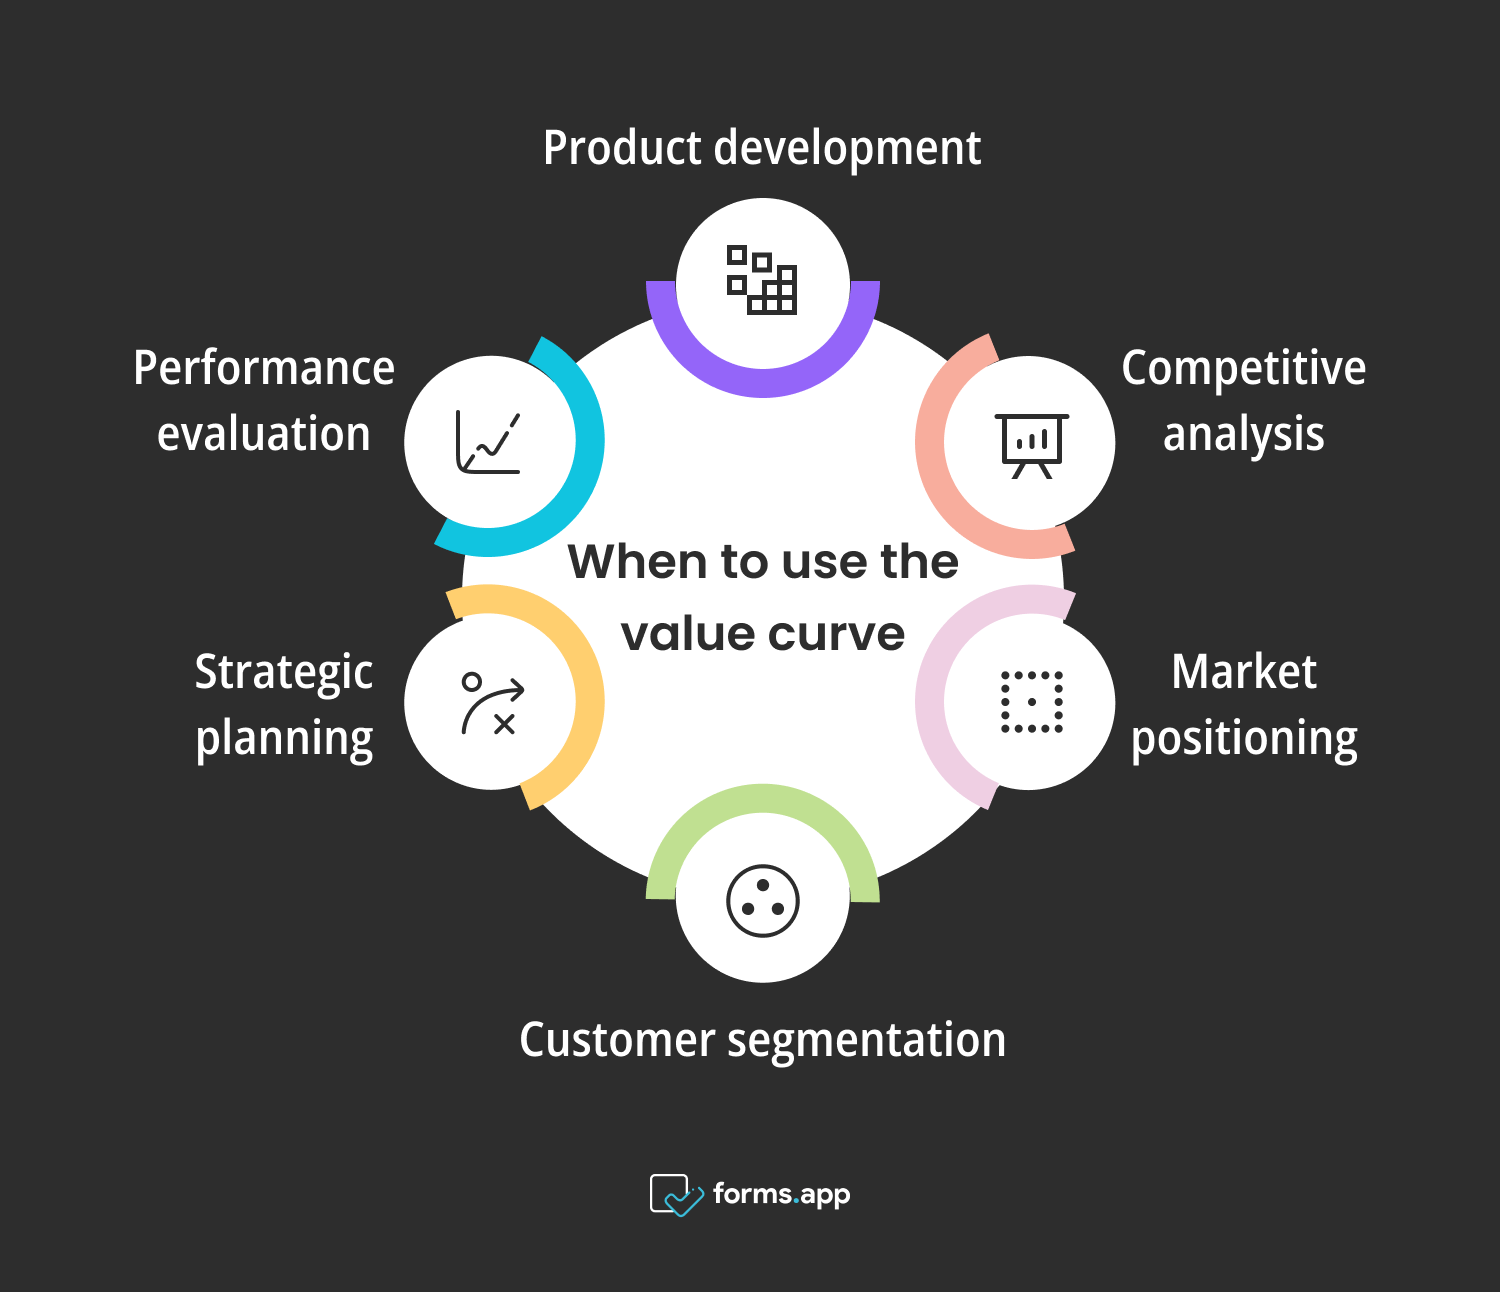
Right times to use the value curve
- Product development: Use a value curve to identify and prioritize the key features and attributes of a new product or service. This helps ensure that the product meets the needs and expectations of the target market.
- Competitive analysis: Compare the value proposition of your product or service with that of competitors. A value curve can help identify areas where your offering excels and where there may be opportunities for improvement or differentiation.
- Market positioning: Determine the position of your product or service relative to competitors in the market. A value curve can help highlight your unique selling points and guide your marketing and messaging strategy.
- Customer segmentation: Analyze the preferences and priorities of different customer segments. A value curve can help tailor your offering to meet the specific needs of each segment more effectively.
- Strategic planning: Use a value curve to inform strategic decisions, such as pricing, strategies, product development priorities, and resource allocation. It provides a visual representation of where value is created and how it can be optimized.
- Performance evaluation: Assess the performance of your product or service over time. By tracking changes in the value curve, you can measure the impact of updates, enhancements, or changes in market dynamics.
Advantages of using the value curve for your business
Using a value curve for your business offers several advantages. You can compare your products and also your place in the competition. It facilitates better decision-making, enhances competitiveness, and ultimately leads to greater customer satisfaction and business success. Let’s see some advantages in detail:
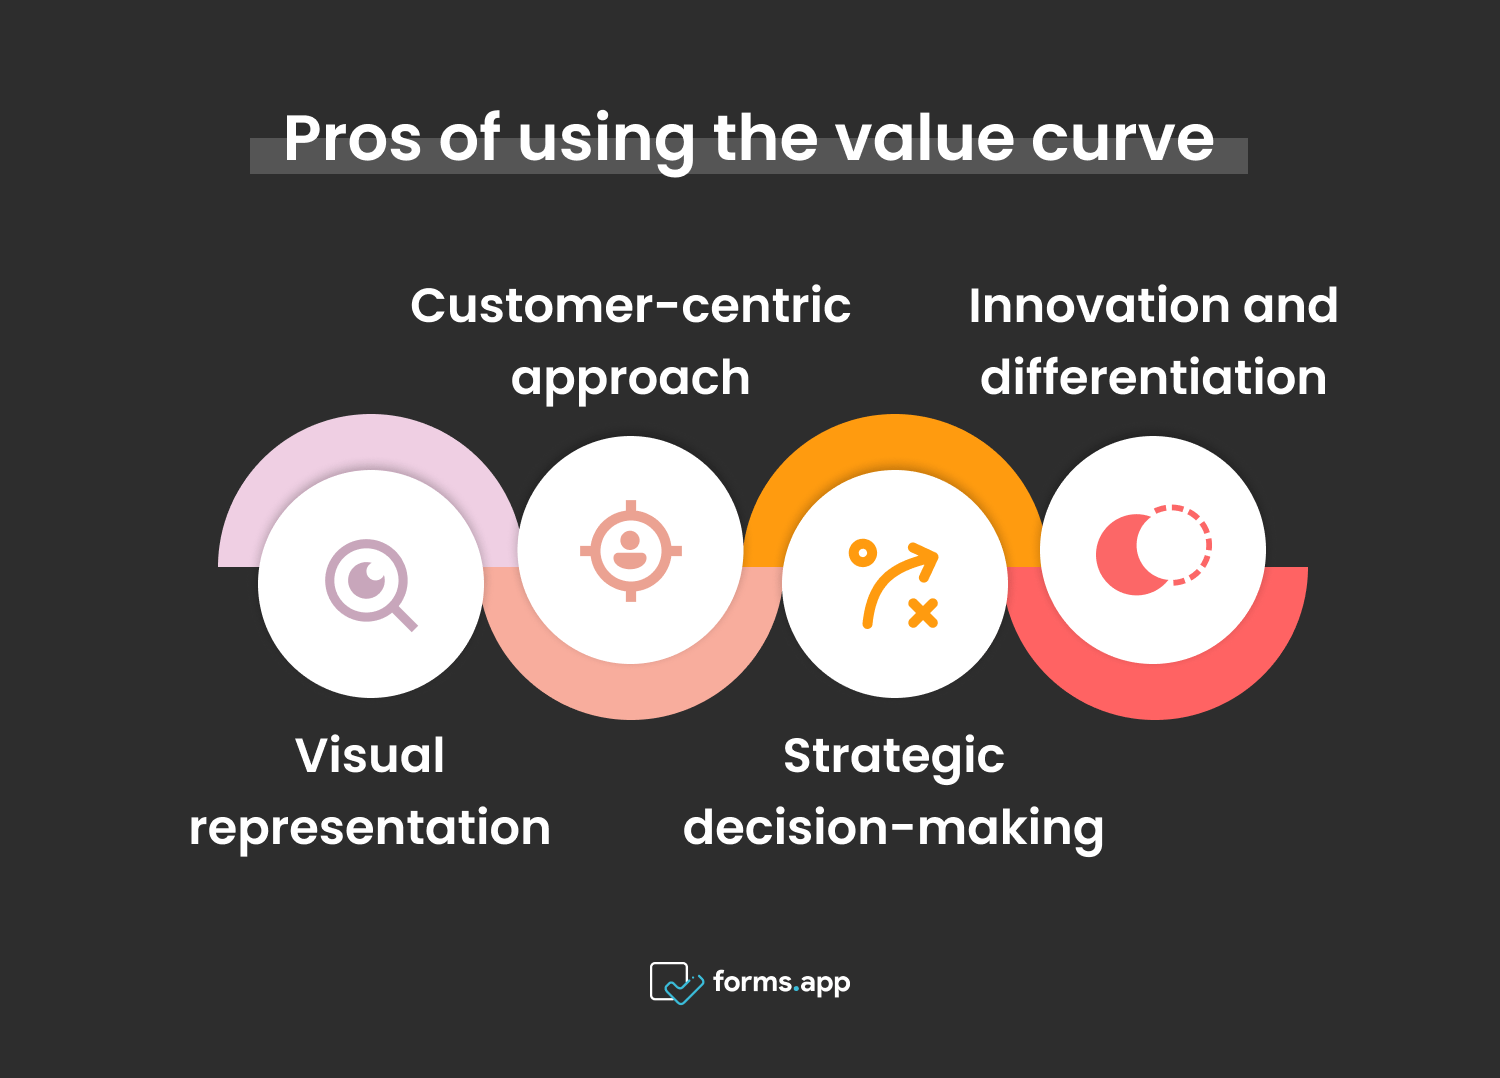
Benefits of using the value curve
- Visual representation: Value curves provide a clear and concise visual representation of your product’s value proposition relative to competitors. This makes it easier to understand and communicate the unique selling point of your products or services.
- Customer-centric approach: By focusing on the attributes and features that matter most to customers, value curves help ensure that your product meets their needs and expectations effectively. This customer-centric approach can lead to higher satisfaction and loyalty.
- Strategic decision-making: Value curves provide valuable insights to inform strategic decision-making, such as pricing strategies, product development priorities, and marketing messaging.
- Innovation and differentiation: Value curves encourage innovation by highlighting opportunities to create new value for customers. Businesses can develop unique value propositions that makes them different than competitors.
Frequently asked questions about the value curve
So far, we have covered many aspects and advantages of the value curve. It is a versatile tool businesses can use to make differences in existing or new markets. That said, let’s address some of the most frequently asked questions about this framework:
To create a value curve for a product or service, identify key attributes important to customers. Rate these attributes on a scale and put them on a graph. Assess how your product compares to competitors across these attributes, aiming to highlight unique value propositions.
The key attributes in a value curve analysis typically include price, performance, features, quality, reliability, customer service, brand reputation and innovation. These factors help assess the overall value proposition of a product or service relative to competitors. These also guide strategic decisions and highlight the areas of strength and differences in the market.
Yes, the value curves apply to various industries and types of business. Whether in technology, retail, healthcare, or finance, the concept of evaluating a product or service’s value proposition relative to competitors remains relevant. By identifying key attributes and assessing performance across them, businesses can better understand market positioning and strategic opportunities regardless of industry.
One disadvantage of a value curve is its simplification of complex market dynamics. It may overlook nuanced factors influencing customer preferences and competitive positioning.
Additionally, value curves rely on subjective ratings, which can introduce bias and inconsistency. Moreover, they may not capture emergent trends or disruptors in the market, potentially leading to outdated strategic insights.
A value curve illustrates the perceived value of a product or service relative to competitors across different attributes. Value curve analysis is the strategy used to assess and analyze these curves and identify strengths, weaknesses, and opportunities.
Based on insights derived from comparing value curves, it informs decision-making regarding product differences, pricing, and market positioning.
Final words
In conclusion, the value curve is a versatile tool that helps businesses connect the attributes of their products/services to certain values and ratings. This analysis is applicable in different industries as long as there is a product or service. It provides a great many advantages such as competitiveness, informed-decision making, and innovation.
In this article, we have delved into the concept of value curves. We have looked into its advantages and suitable environments. We have also visualized a company’s use of value curves in a hypothetical scenario. Lastly, we have answered some frequently asked questions about the concept.
Why don’t you draw your own value curve for your business today?
Fatih is a content writer at forms.app and a translator specializing in many text domains, including medical, legal, and technical. He loves studying foreign languages. Fatih especially likes to create content about program management, organizational models, and planning tools.
