55+ UX statistics that will blow your mind

Summarize with
Customer satisfaction is becoming increasingly important in business, where competition is increasing rapidly. Providing good user experiences to your customers is essential to ensure customer satisfaction and increase conversion rates. Users with a positive experience spend longer on brands' websites and make more purchases. Therefore, you should provide positive customer experiences to increase customer loyalty.
Thanks to effective UX design, your users can benefit from your products and services without any problems. In this article, we have prepared 55+ user experience (UX) statistics for you to learn about the subject. Statistics for UX research will teach you how to provide favorable experiences to your users and target audience. Now, let’s move on to our article:
7 Key points about UX statistics
Reading statistics for user experience allows you to understand the factors influencing users' shopping decisions. This way, you can identify strategies to improve user experience and increase sales. In addition, by enhancing the customer experience, you can ensure that your customers recommend your services to their families and friends.
You can find the highlighted statistics about UX in the list given below:
A 1 dollar investment in UX generates 100 dollars in return, representing an ROI of 9,900% (Intechnic).
88% of online customers are less likely to revisit a website following a negative experience (Toptal).
46% of users worldwide will not purchase from a company without improved UX product design (Enterprise Apps Today).
A poor user experience causes 70% of customers to give up on a purchase (Medium).
Why does the UX matter?
UX represents the whole process of your customer's interaction with your brand. In other words, UX demonstrates your success in getting your target audience to reach your brand and purchase from it. Analyzing data about UX will give you the necessary tips to grow your brand.
Now, check out the following points that will show you why UX is important for businesses:
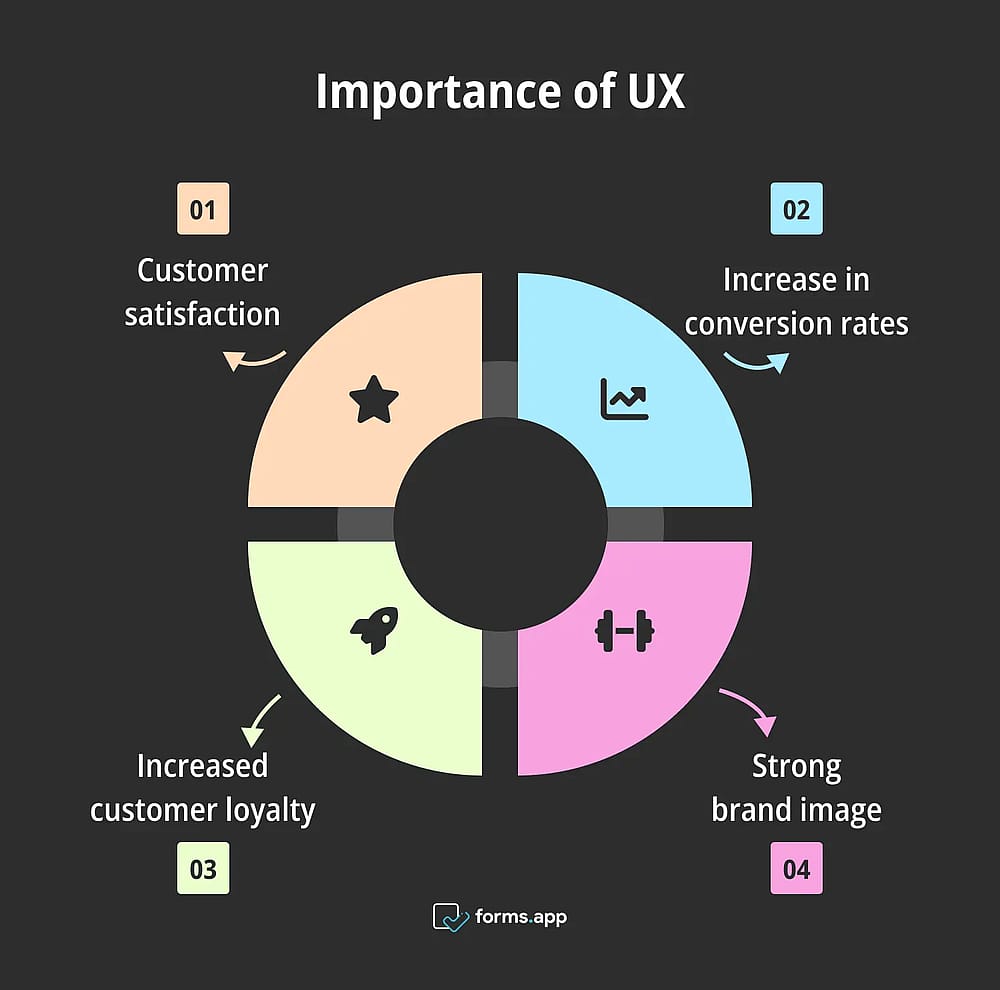
Importance of UX
⭐ Customer satisfaction: Consumers who have a smooth experience in their interaction with your brand will increase customer satisfaction. Therefore, your sales will increase, and you will have an advantageous position in the competition.
⬆️ Increase in conversion rates: Consumers who experience a positive and fast purchasing process on your website or application will tend to shop more from your brand. This will increase your conversion rates and allow you to reach a wider audience.
🚀 Increased customer loyalty: Improving your customers' user experience will lead them to engage with your brand and increase their loyalty. Positive user experiences encourage users to use that site or application again.
💪 Strong brand image: Providing your customers with positive experiences will increase their satisfaction and trust, strengthening your brand image. By creating a strong brand image, you can reach your target audience more quickly.
55+ Essential UX statistics for a broader perspective
With the help of our article on user experience, you will learn how to find UX statistics and the benefits it will provide you. Also, you can create UX surveys to gain insights in addition to the inferences you get from our statistics and improve the customer experience. Here are 55+ UX statistics for you to learn:
General UX statistics
General user experience statistics will help you understand the topic thoroughly and get the key points. You will also learn ways to improve the user experience by examining general user experience statistics. Let's move on to general ux statistics for more information:
1. It takes 0.05 seconds for users to establish an opinion about a website (Taylor & Francis).
2. 88% of online customers are less likely to revisit a website following a negative experience (Toptal).
3. 69% of users will leave a website if there are too many steps in the buying process (Think with Google).
4. More than half (65%) of customers from the United States find a positive experience with a brand to be more effective than advertising (PwC).
5. A poor user experience causes 70% of customers to give up on a purchase (Medium).
6. 68% of consumers will not even submit a form on a website if it requests too much personal information (Enterprise Apps Today).
7. AI-powered UX personalization boosts customer engagement by 30% (Enozom).
8. 82% of consumers in the United States and 74% of non-US consumers want more human interactions during the shopping process in the future (PwC).
9. 66% of customers who find the purchasing process complicated are inclined to switch brands due to bad service (Slideshare).
10. The overall user experience performance of 48% of e-commerce websites' product pages is rated as "good" or "decent." (Baymard Institute).
11. It takes 2.6 seconds for a consumer to realize the area of a website that influences their first impression the most (Missouri University of Science and Technology).
12. 53% of mobile users will not shop from a site that takes three seconds to load (Think with Google).
13. 91% of consumers who had a negative experience said they would just leave and wouldn't do business with the same company again (Slideshare).
14. 34.6% of consumers leave a website because of the poor content structure (GoodFirms).
Source: Taylor & Francis
Mobile UX statistics
The fact that people frequently prefer mobile devices for shopping shows the importance you should give to mobile user experience. Examining mobile UX statistics will increase the conversion rates of your mobile-friendly website. Take a look at mobile ux statistics to understand the factors affecting mobile user experience:
15. 90% of users stated that a poor-performing app caused them to stop using it (Toptal).
16. Sales grew for 62% of businesses that designed their websites for mobile platforms and for 64% of the companies that designed their websites for tablets (Ironpaper).
17. If a user has a negative experience with the mobile version of a website, 48% of them are more likely to leave (Enterprise Apps Today).
18. 74% of respondents say they are more inclined to revisit a mobile-friendly website after visiting it (Think with Google).
19. 65% of consumers say that mobile-friendly websites make them more likely to buy a product or service (GOMO).
20. If a brand's website lacks a responsive mobile design, 52% of users will not engage with it (Enterprise Apps Today).
21. If a website is not optimized for mobile, mobile users are five times more likely to abandon a task (Toptal).
22. In the next six months, 43% of consumers plan to increase online shopping (PwC).
23. 63% of mobile customers have at least once abandoned a product or website during testing because of preventable mobile usability problems (Baymard Institute).
24. 86% of consumers prefer to visit a mobile-friendly website (GOMO).
25. According to 67% of smartphone users, visiting a mobile-friendly website increases user interactivity and the likelihood of purchasing the goods or services offered (Think with Google).
26. Positive mobile experiences increase a company's reputation, according to 61% of consumers (Web FX).
27. Approximately 50% of B2B buyers who report having a bad mobile experience are unlikely to make another purchase from the same vendor (Think with Google).

Source: Enterprise Apps Today
UX design statistics
The user experience design created to respond to the wishes and needs of your target audience will satisfy them. By examining UX design statistics, you will be able to provide your users with trouble-free experiences. Here are UX design statistics:
28. If a website's layout is not appealing and user-friendly, 38% of the target audience will no longer interact with it (Web FX).
29. You will see a minimum 25% increase in earnings if you use UX design to satisfy enough customers to increase retention by 5% (Intechnic).
30. 94% of consumers said that they mistrusted or rejected a website because of its web design (Ironpaper).
31. 46% of users worldwide will not purchase from a company without improved UX product design (Enterprise Apps Today).
32. 73% of consumers consider the value of the customer experience when making shopping decisions. However, just 49% of customers from the US believe that businesses offer a positive customer experience (PwC).
33. A website's general design accounts for 75% of the credibility judgments made about it (Web FX).
34. With a well-designed user interface, your website's conversion rate may increase by as much as 200%. Furthermore, it may increase by 400% with an improved UX design, showing the importance of good user interface design (Intechnic).
35. More than half of consumers claim they won't consider making a purchase from a company with a poorly designed mobile website (Think with Google).
Source: Intechnic
UX research statistics
User experience research will help you identify your customers' wants and needs more accurately. User experience (UX) research statistics will help you understand the behavior and expectations of your users. Now, check out UX research statistics to get more info:
36. A company that provides a positive experience will likely get more information from 63% of consumers and increase conversion rates (PwC).
37. 80% of consumers are willing to pay extra for a good user experience (Medium).
38. If a website can't predict its users' expectations and needs in advance, 45% of users will leave (Enterprise Apps Today).
39. A usability test on a group of seven customers can solve 85% of UX problems (Uxeria).
40. A dissatisfied customer will tell 9–15 people about their experience, and more than 10% will tell 20 people (Market Connections).
41. Approximately 80% of American consumers consider speed, convenience, knowledgeable help, and friendliness the most important elements to improve the user experience (PwC).
42. Nearly a quarter of the customers (24%) gave up on the checkout process because the website required them to register for an account (Baymard Institute).
43. Poor user research and not utilizing the necessary tools for UX research led 89% of customers to start doing business with a competitor. (Web FX).
44. Typically, five users will find 85% of usability problems in an interface during usability tests (MeasuringU).
45. Only 55% of businesses conduct usability tests for their websites (Uxeria).
46. 48% of website visitors never return because they don't understand the company's mission and vision (Enterprise Apps Today).
Source: PwC
UX business statistics
For the long-term success of your company, you must invest in user experience. UX business and UX calculator statistics will show you the financial impact of user experience. Here are the UX business statistics that will allow you to make comparisons:
47. According to 54% of consumers from the United States, most organizations' customer experience needs to be improved (PwC).
48. Slow loading time for websites costs retailers over 2 billion dollars in lost revenue annually (Intechnic).
49. Businesses lose about 2.6% of their income due to websites that load slowly (Enterprise Apps Today).
50. Conversion and bounce rates on websites with video content increase by 80% (Enozom).
51. A 1-dollar investment in UX generates 100 dollars in return, representing an ROI of 9,900% (Intechnic).
52. 42% of users prefer and would pay more for a friendly and welcoming experience from companies (PwC).
53. 39% of users will leave a website or application if images and digital products won't load or take too long to load (Web FX).
54. Improving the user experience with simpler solutions can increase conversion rates by over 35% for companies (Think with Google).
55. Businesses lose 62 billion dollars annually as a result of poor customer service (Medium).

Source: Enterprise Apps Today
Final words
The bottom line is that improving the user experience is critical to ensuring that your company's products and services reach its target audience. Improving the user experience can ensure customer satisfaction and increase their loyalty to your business.
We have prepared 55+ user experience (UX) statistics in this article. Reading our article, you can also understand what UX is and its importance for your company. Investing in user experience will strengthen your brand image and increase your brand awareness.
Thanks to our statistics, you have learned why you should invest in UX, and now you are ready to ensure customer satisfaction!
Contributors
forms.app, your free form builder
- Unlimited responses
- Unlimited questions
- Unlimited team members