What is ordinal scale: Definition & examples
Summarize with
The variables or numbers are defined and categorized in statistics using various measuring scales. Specific characteristics of each level of the measurement scale dictate the diverse applications of statistical analysis.
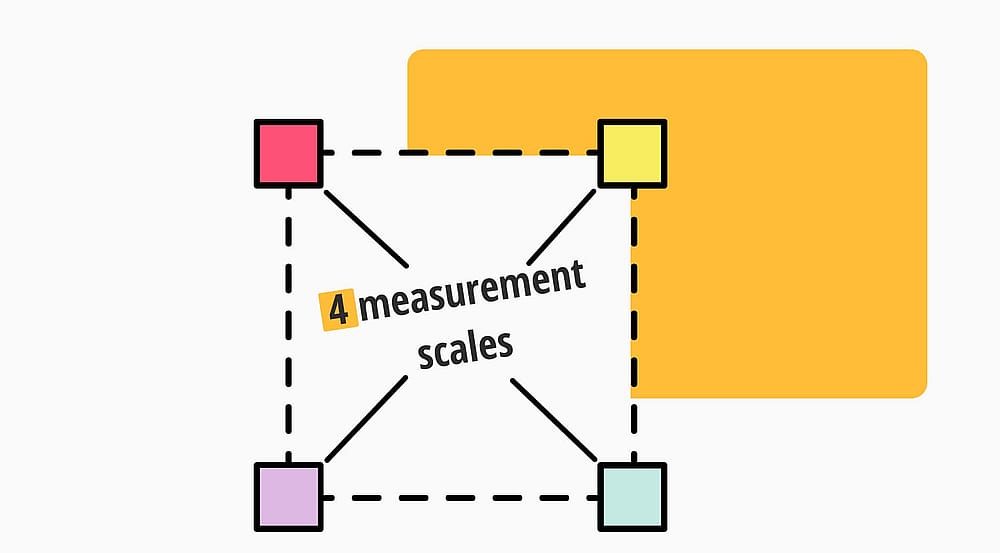
There are four different measurement scales, namely nominal scale, ordinal scale, interval, and ratio scale. If you need to identify and describe the magnitude of a variable, you can use an ordinal scale. This article will explain the definition of the ordinal scale in research, examples of the ordinal scale, and characteristics of the ordinal scale.
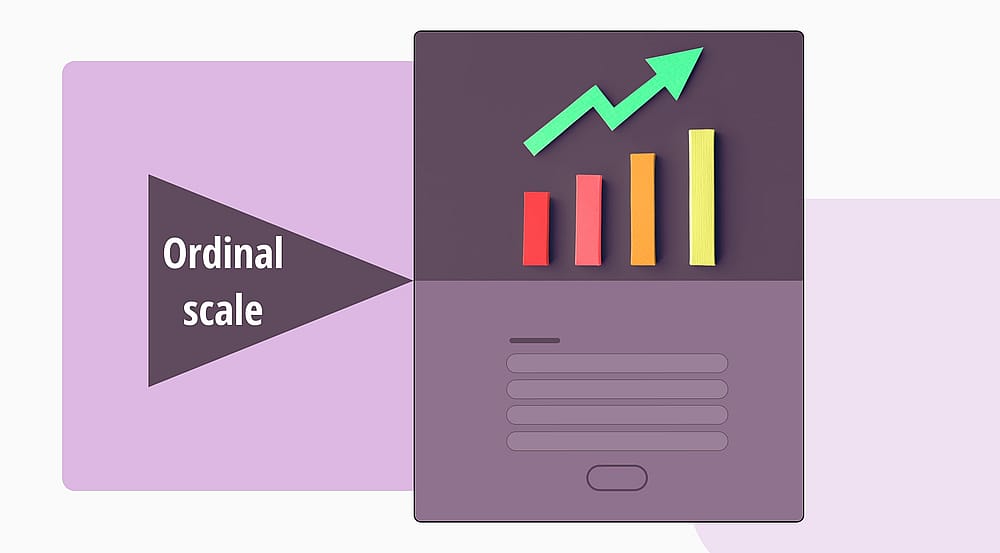
What is the ordinal scale?
An ordinal scale enables you to assess a respondent’s attitude toward a subject using a series of ordered replies. The ordinal scale is quantitative data with naturally occurring order. Ordinal scales can be ranked, named, or categorized.
The ordinal scale, the second measurement level, reports the ranking and ordering of the data without determining the degree of variance among them. The ordinal scale is used in statistical data when variables measurement are ranked or arranged in some order but where there is no degree of differentiation between groups.
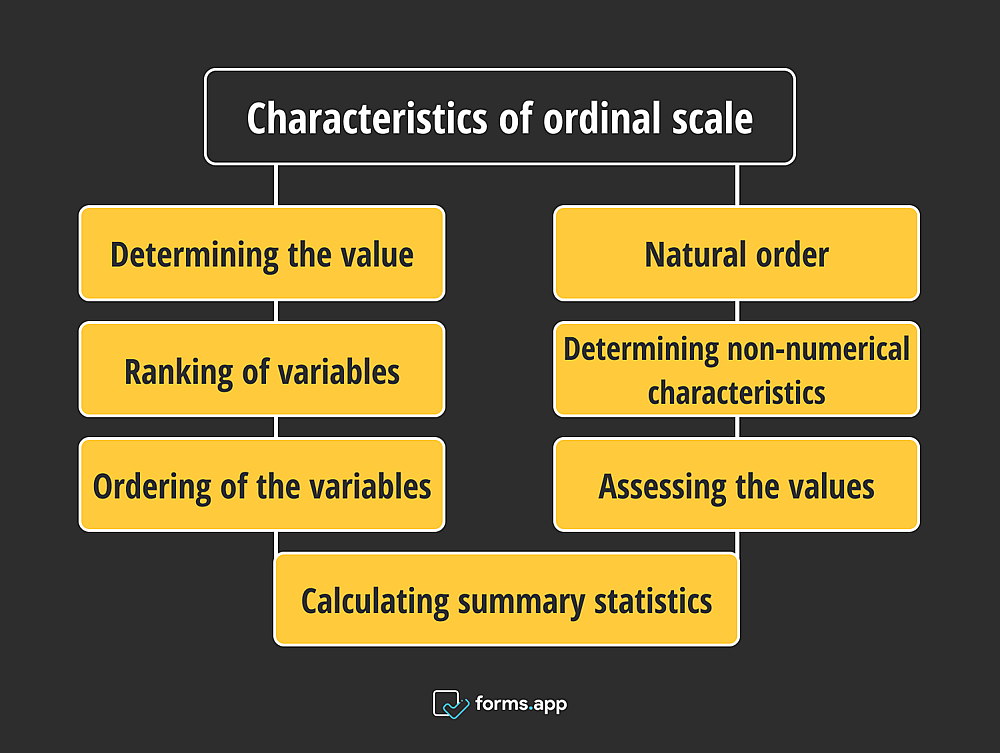
Characteristics of ordinal scale
The ordinal scale in statistics is successfully employed in surveys, polls, and questionnaires due to the ease of data analysis and categorization. Collected replies may be simply contrasted to make meaningful inferences about the target audience. The following characteristics describe the ordinal scale:
- Determining the value: An ordinal can be used for research and survey purposes to determine if a data set has a higher or lower value. The ranking reveals the variables’ magnitudes.
- Natural order: Ordinal data include natural order. Take the following sequence for categorizing pain according to intensity: excruciating, severe, moderate, and minimum.
- Ranking of variables: Ordinal scales offer the ranks of those variables in addition to the information supplied by the nominal scale.
- Determining non-numerical characteristics: Ordinal scale is useful for measuring non-numerical characteristics, including pleasure, frequency, and happiness.
- Ordering of the variables: The degree of agreement among respondents on the determined order of the variables may be evaluated by survey creators using this scale.
- Assessing the values: The ordinal scale may assess frequency, importance, quality, probability, satisfaction, and experience, just as a Likert scale.
- Calculating summary statistics: Summary statistics, such as frequency distribution, median, and mode, can be calculated using ordinal data.
Ordinal scale characteristics
Ordinal scale examples
An ordinal scale is a scaling system that follows orders. Ordinal scales typically employ a 1 to 5 or 1 to 10 rating system, with 1 denoting the lowest value answer and 10 representing the most outstanding value response. Businesses may use an ordinal customer satisfaction scale to assess whether their service needs improvement. Here are some ordinal scale examples:
- How frequently do you get your vehicle repaired?
a - Very often
b - Often
c - Not often
d - Not at all
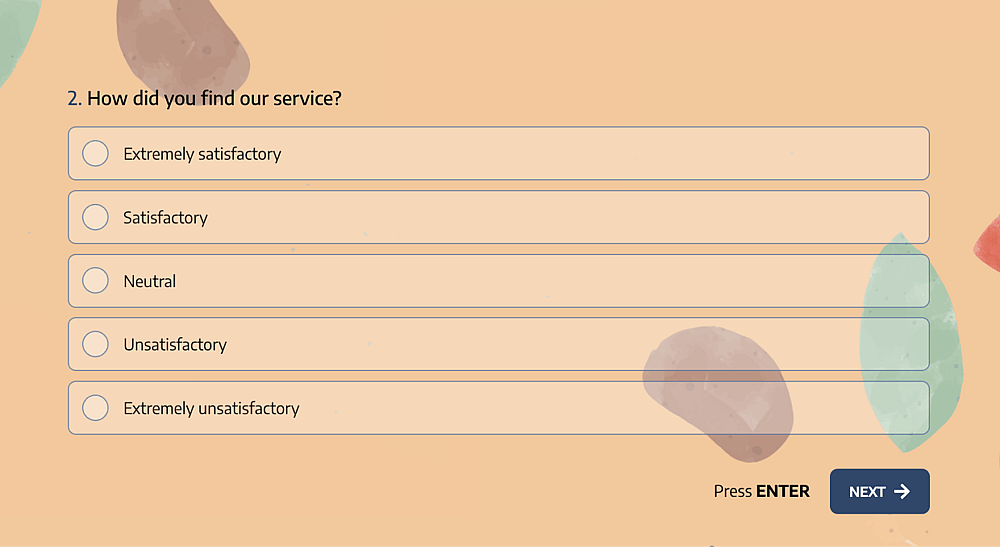
- How did you find our service?
a - Extremely satisfactory
b - Satisfactory
c - Neutral
d - Unsatisfactory
e - Extremely unsatisfactory
- How likely are you to purchase anything from this company in the future?
a - Very likely
b - Somewhat likely
c - Not sure
d - Unlikely
e - Very unlikely
- How important is the price when buying a new product?
a - Very important
b - Important
c - Neutral
d - Unimportant
e - Very unimportant
- Rate the order of preference among the six mentioned car brands.
a - BMW
b - Toyota
c - Ford
d - Jeep
e - Honda
f - Porsche
An ordinal scale question example
When to use the ordinal scale?
An ordinal scale is employed when data may be logically ranked or ordered, but the distinctions between the values are unknown or unequal. It is frequently utilized in surveys, rating systems, and ranking exercises. We have listed below when ordinal scales are used.
- When ranking the ordinal variables, the ordinal scale is utilized as a comparison parameter to determine if they are more or less than one another.
- If a customer satisfaction survey is conducted, respondents may be asked to rate their level of satisfaction. Responses can be graded or edited.
- Respondents may be asked to rate their preferences for various goods or services as part of market research.
- Surveys frequently employ Likert scales to measure attitudes, views, or impressions. Respondents are given a series of items to consider and are asked to assess their agreement or disagreement with each statement on a scale.
- Ordinal scales are frequently employed in educational contexts to grade students' performance.
- Ordinal scales are frequently used in surveys and social scientific research to gauge opinions, engagements, or preferences.
How to analyze Ordinal data
The type of analysis you can run on ordinal data depends on the level of measurement you choose. Both descriptive statistics and inferential statistics can be used to evaluate ordinal data.
The properties of a dataset may be summarized using descriptive statistics, and predictions can be made using inferential statistics using recent data. Using ordinal data, the following descriptive statistics may be produced:
- Frequency Distribution: Frequency distribution explains the distribution of your ordinal in terms of numbers or percentages. You can see how the values are spread in the table.
- Visualizing the data: A bar graph may be used to visualize the data and provide an overview of the frequency distribution. When showing ordinal data, it is crucial to consider the category order.
- Central tendency: The majority of values in a dataset are located in its mode or median, which represents its center tendency. The three most prevalent metrics of central tendency are mean, median, and mode. However, as ordinal data lacks a number component, it is impossible to calculate the mean using mathematical operations on it.
- Measures of variability: The range of a dataset may be evaluated by determining its lowest, maximum, and range. This has to be calculated using numerical codes. The range is helpful because it shows how evenly distributed the values in a dataset are.
Frequently asked questions
An ordinal scale is a measuring scale that classifies things or variables in a certain order without revealing the size of the gap between them. All measuring scales have their characteristics. Here we have shared frequently asked questions about ordinal scale:
Ordinal and interval are differentiated based on the particular requirements of the analysis being done. Because the items in Likert scale inquiries have a distinct rank order but an uneven distribution, Likert scales are typically regarded as ordinal data.
Sometimes, the overall Likert scale scores are seen as interval data. These scores have equal spacing between them and directionality.
Ordinal and interval scales are two of the four primary categories of data or classifications. Both data kinds accommodate the necessity to categorize and communicate information. Data quantities are also measured in terms of ordinal and interval data.
Ordinal scales have unordered categories with a defined order or ranking, but interval scales have ordered categories with equally measured intervals between them. This is the primary distinction between ordinal and interval scales.
A nominal scale is a scale in which variables are only “named” or “labeled” without regard to their order. Beyond merely identifying them, the variables on an ordinal scale have a precise order.
A nominal scale is a measuring scale that divides data into unique, unrelated groups without any innate hierarchy or order. On the contrary, an ordinal scale is a measuring scale that ranks or orders data according to some trait or feature.
Wrapping it up
In conclusion, ordinal data are the kind of data where the values are arranged naturally. The inability to discern or meaninglessness of the variations between the data values is one of the most noticeable characteristics of ordinal data. In most cases, the data categories don’t have the breadth to represent the underlying attribute's equal increments.
Ordinal data cannot be altered by mathematical operators, unlike interval or ratio data. This article has explained what ordinal scale is, the characteristics of ordinal scale, ordinal scale examples, how to analyze ordinal data, and frequently asked questions about ordinal scale. You can learn all details about the ordinal scale by reading this article.
Contributors
forms.app, your free form builder
- Unlimited responses
- Unlimited questions
- Unlimited team members