Making histograms in Google Sheets is a simple way to look at your data clearly. With charts in Google Sheets, you can easily show info like customer happiness or website visits. Similarly, creating a histogram helps you see the big trends and the little differences in your data quickly.
In this guide, we'll teach you how to make histogram charts right in Google Sheets. You'll learn to pick the data range, create a histogram, insert a chart, and find the best chart type for your information. By the end, making histograms will be a piece of cake, helping you understand and make better decisions from your data.
What is a histogram chart?
A histogram chart is a type of graph in Google Sheets that shows how often something happens within a set of data.
It groups numbers into ranges, and the height of each bar shows how many fall into each range. This makes it easy to see patterns like the most common outcomes or if there are any outliers.
The use of histogram charts can help you analyze your data better, regardless of whether it is a line graph or scatterplot. So, if you are seeking more reasons to use histogram charts on your sheet, have a look at the following title:
Why use a histogram chart?
Histogram charts in spreadsheets help you sort and understand your data sets quickly. Learning how to make a histogram in a spreadsheet allows you to visualize data distribution effectively through its distinct chart style, simplifying the analysis of vast information.
👉🏻You can easily compare data
👉🏻It helps identify trends and outliers
👉🏻Simplifies understanding complex data
👉🏻Offers effective visualization with a clear chart style
How to make a histogram chart in Google Sheets
Making a histogram chart in Google Sheets is straightforward and lets you analyze your data beautifully. This guide will show you how to make a chart in Google Sheets, focusing on setting up the vertical axis and horizontal axis. You'll see how easy it is to transform your data into meaningful visuals.
Step 1
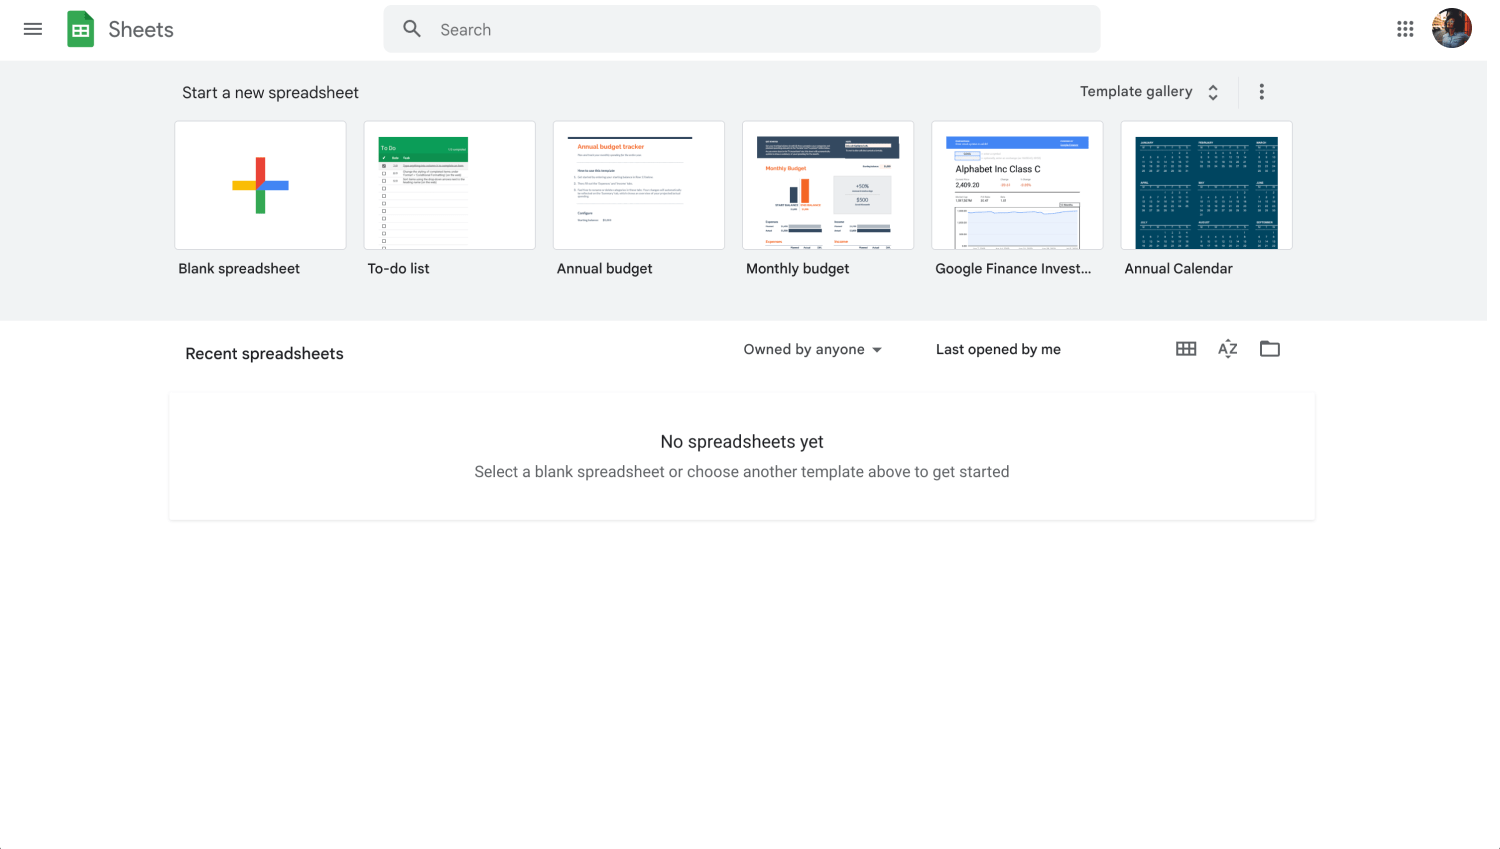
Google Sheets dashboard
Start by logging into your Google account and opening the Google Sheets document containing your dataset.
Step 2
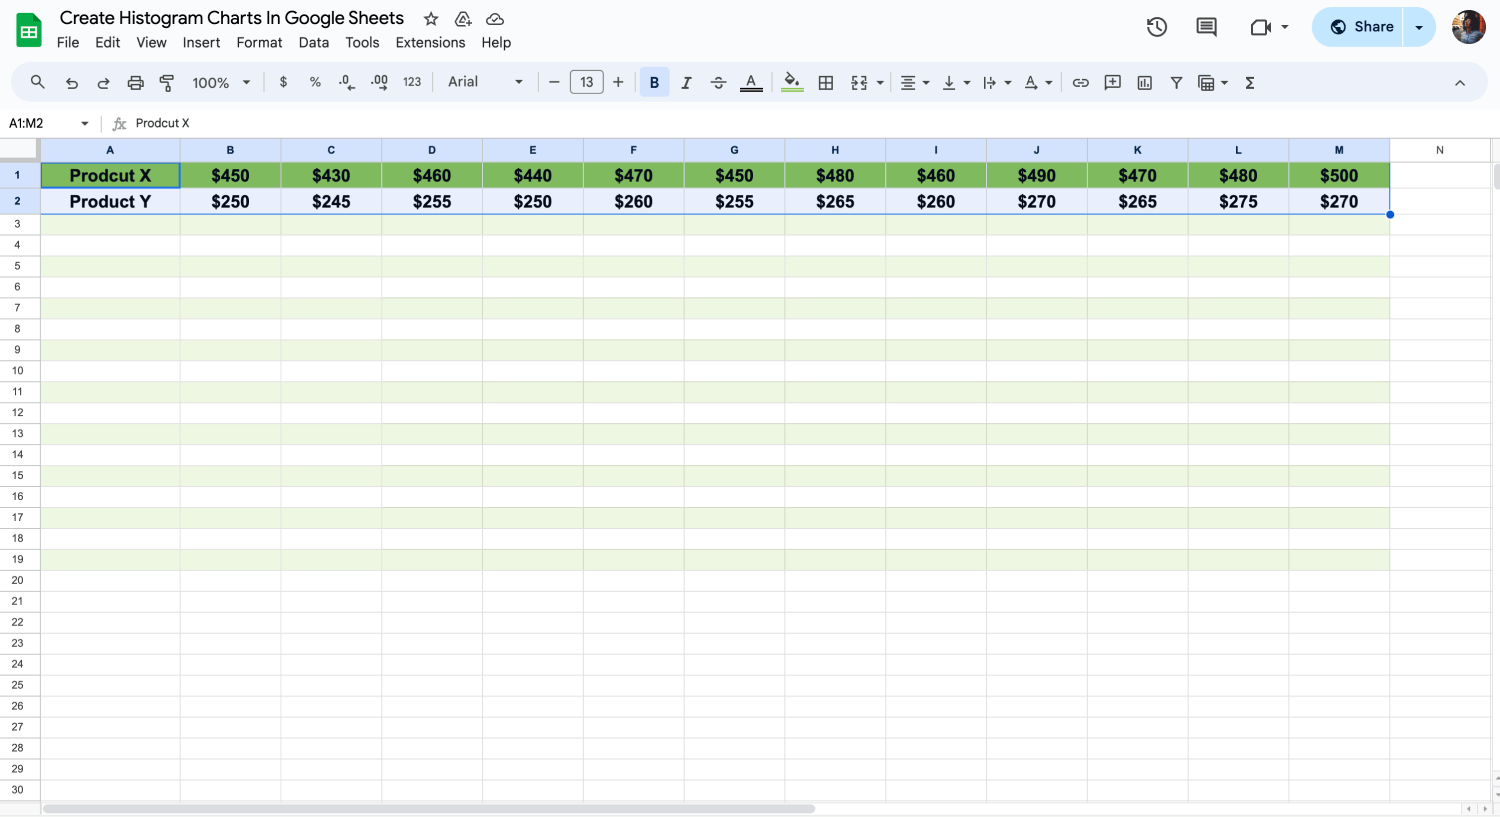
Choose the cells you want to insert a chart
Carefully highlight the cells with the data points you need for your histogram. This step is vital because it sets the number of data points your histogram will show, shaping how it will look and the insights you can draw from it.
Step 3
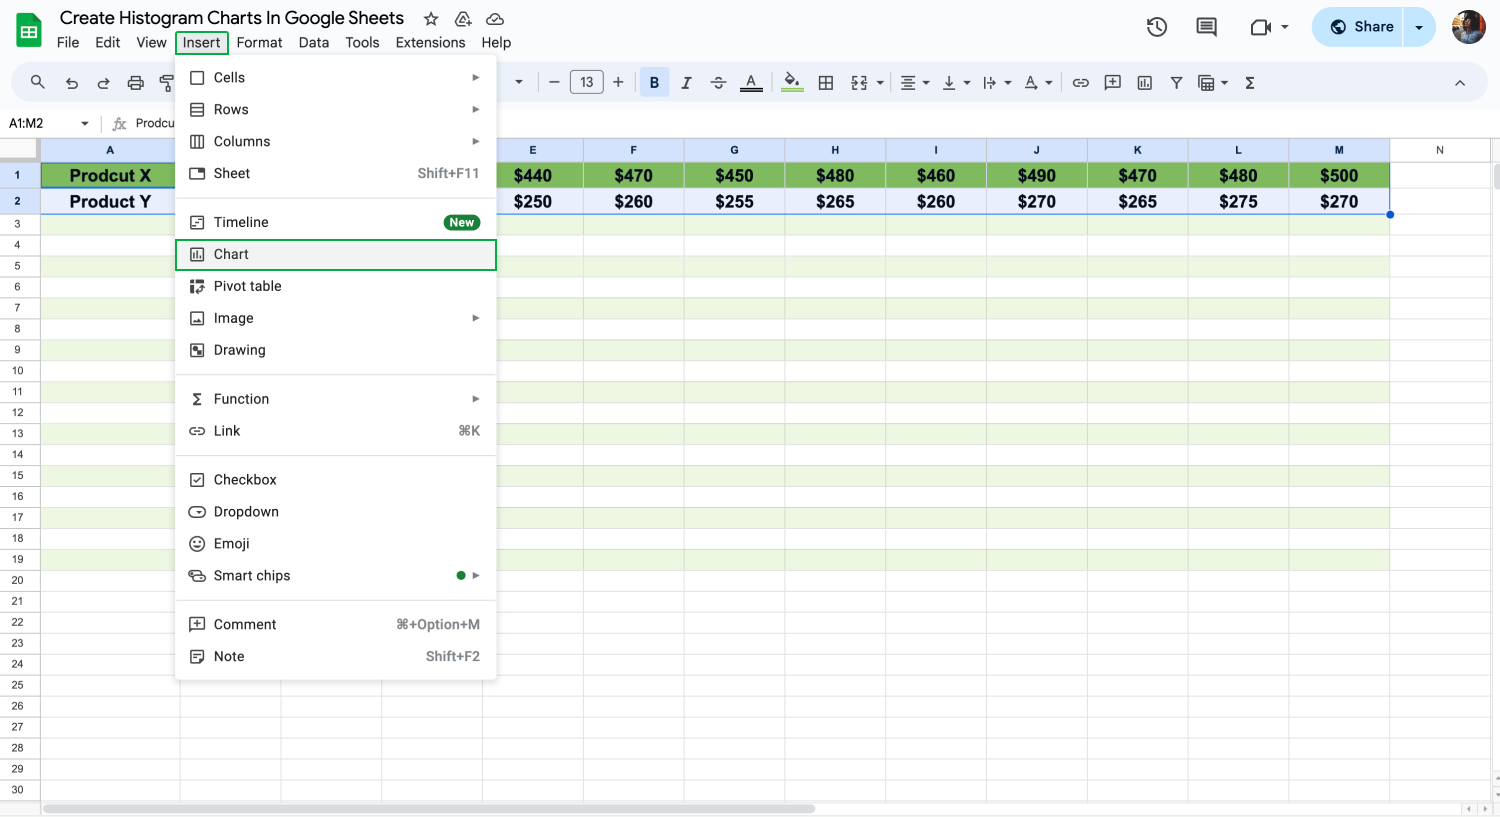
Click “Chart” to insert a chart
With your data highlighted, go to the top menu in Google Sheets and click on "Insert." A dropdown menu will appear, where you'll select "Chart." This action gets Google Sheets ready to help you create your chart, moving you closer to having your histogram.
Step 4
When the Chart Editor panel pops up on the right, it's time to pick the right chart type. To create histograms, we will choose “Line Chart”. This choice tells Google Sheets to organize your data in a way that highlights distribution and frequency, which is crucial for histogram analysis.
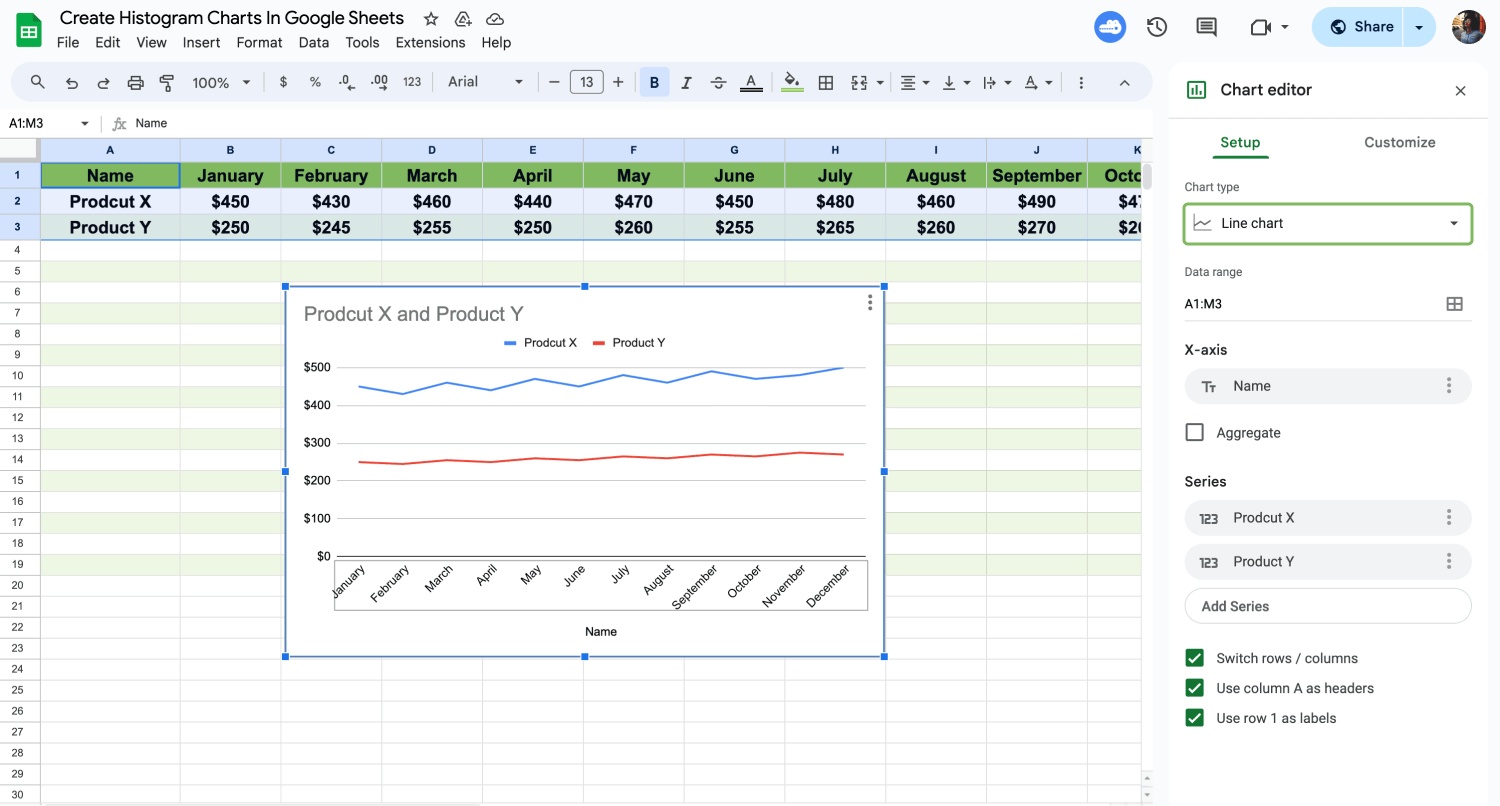
Choose a line type
Step 5
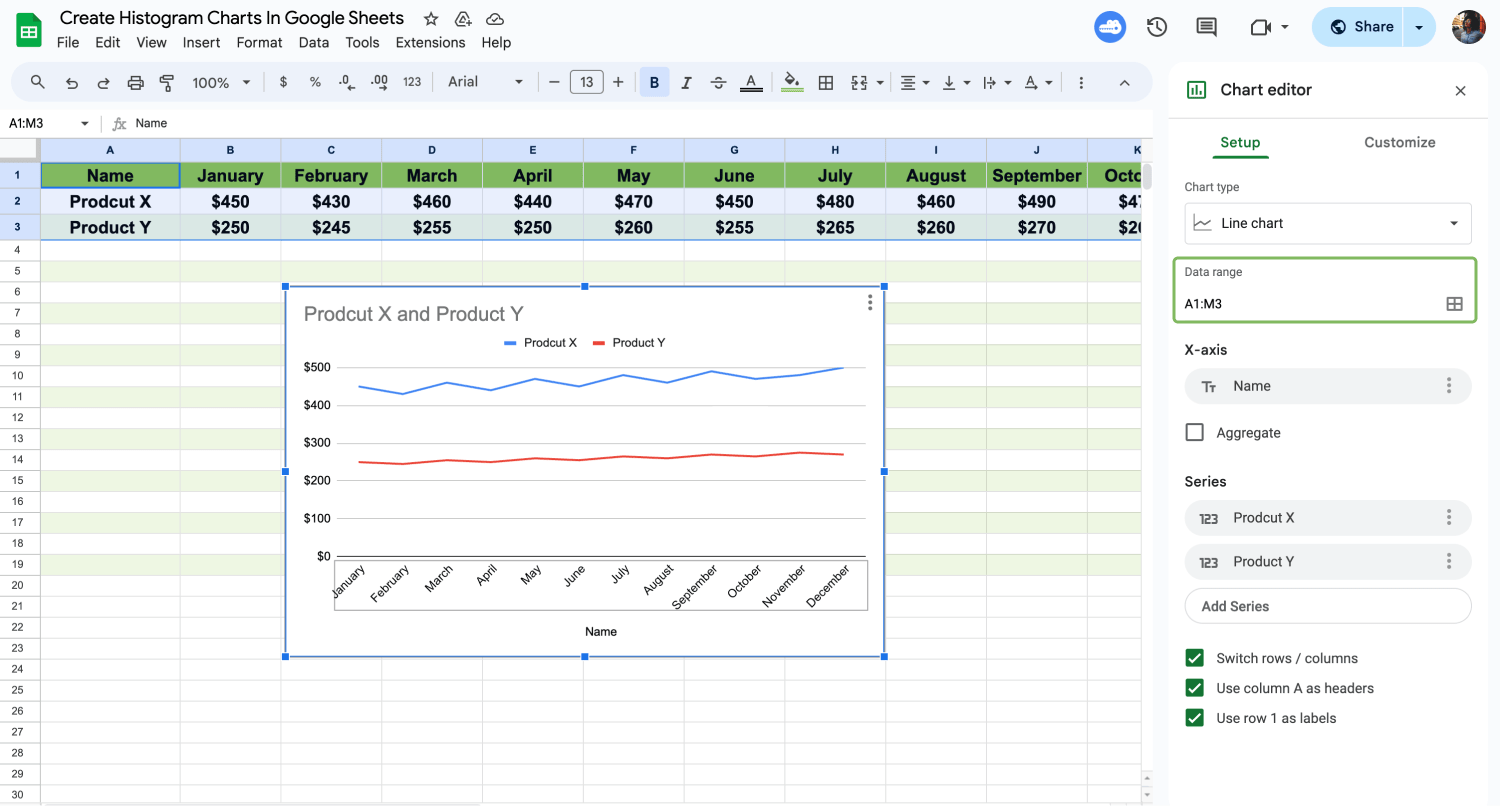
Arrange the date range
Select the data and range for your histogram. You can adjust this in the Chart Editor if necessary. You might need to adjust this to accurately capture and represent all the necessary information in your histogram.
Step 6
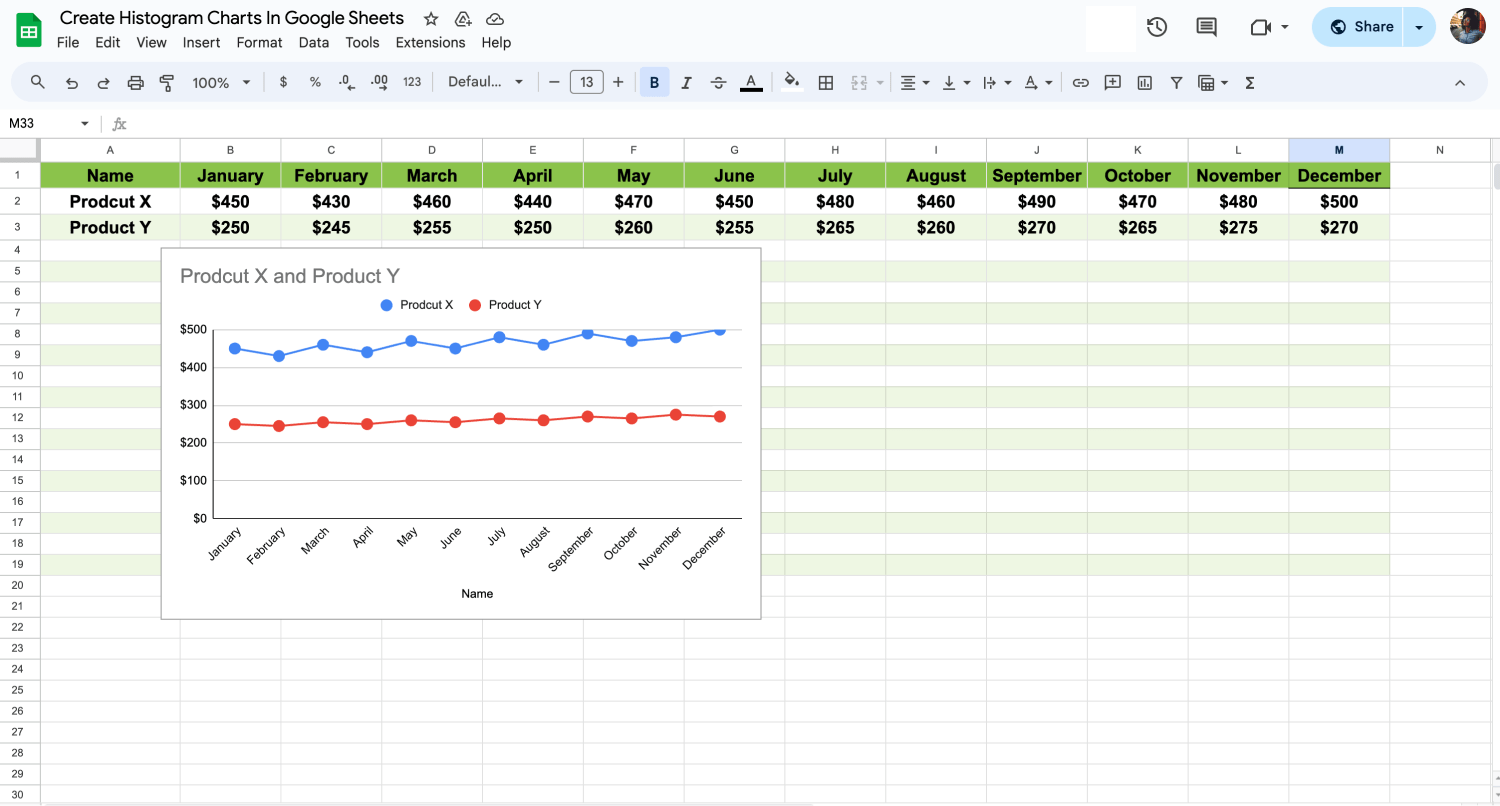
Customize the chart settings
The last step is to explore the Chart Editor's customization options. This is where you can truly personalize your histogram. Alter the bar color for a better visual effect, update the axis labels for clearer understanding, and place the legend where it makes the most sense. These customizations ensure your histogram is not only analytically accurate but also ready for any presentation.
By following these steps, you'll craft a meaningful histogram that clearly illustrates the distribution of your data, enhancing your analysis and decision-making process.
💡Learning how to make a dropdown menu in Google Sheets can streamline your data entry process, making it faster and more error-free.
Frequently asked questions about Google Sheets histograms
Exploring histograms in Google Sheets often leads to various questions, from creation to customization. Whether you're a beginner or seeking advanced tips, this section addresses the most common inquiries.
If you have any questions or doubts about the topic, we invite you to explore the Frequently asked questions we've compiled for you. This part of our guide is specifically designed to address common inquiries, providing you with a deeper understanding and clarity on the subject.
Yes, you can easily create a histogram in Google Sheets. Google Sheets provides built-in tools that allow you to visualize your data as histograms without needing complex formulas. By selecting your data and using the Chart option, you can choose the histogram type, and Google Sheets will automatically generate it for you.
To change a bar graph to a histogram in Google Sheets, follow these steps:
1. Open your chart: Click on the bar graph you want to change. The chart editor will open on the right side of your screen.
2. Access chart type options: In the Chart editor, find the Chart type dropdown menu.
3. Select histogram: Scroll through the list of chart types and select "Histogram" from the options. Google Sheets will automatically adjust your bar graph to a histogram format using the same data set.
4. Customize (if needed): After changing to a histogram, you might want to adjust settings like the bucket size or the range to fit your data analysis needs better.
While both types use vertical bars to represent data, the context and interpretation of these bars differ significantly:
- Histogram group numbers show how many times something happens.
- Column charts show how different things compare by using bars side by side.
- You can use histograms to see patterns in numbers. Use column charts to compare things.
- Histograms put data in ranges. Column charts show data for each item or group.
Making a chart or graph in Google Sheets is straightforward. Follow these simple steps:
1. Open your data: Go to Google Sheets and open the spreadsheet with your data.
2. Select the data: Click and drag to highlight the cells with the information you want to graph.
3. Insert the chart: Click on "Insert" in the top menu, then select "Chart" from the dropdown options.
4. Choose your chart type: In the Chart editor on the right, you can pick the type of chart or graph that best fits your data. Google Sheets offers options like line graphs, bar charts, and more.
5. Customize your chart: Use the Chart editor to change colors, adjust labels, and modify other settings to make your chart clear and appealing.
Creating a histogram in Excel is easy with these steps:
1. Prepare your data: Organize your data in one column on an Excel sheet.
2. Go to the Insert tab: The "Insert" tab is on the ribbon at the top of Excel.
3. Select Histogram: Click on "Insert Statistic Chart" and choose "Histogram" from the options.
4. Adjust your histogram: Excel will automatically create your histogram based on the selected data. You can customize it by clicking on the chart and using the "Chart Design" and "Format" tabs.
5. Edit bins if needed: To change the range or number of bins, right-click on the horizontal axis of the histogram, select "Format Axis," and adjust the bin settings under "Axis Options."
Final words
Histograms in Google Sheets offer a dynamic way to analyze and understand your data. Whether you're in education, marketing, or data analysis, mastering histograms can transform raw data into actionable insights. This skill is invaluable for making informed decisions, identifying trends, and presenting data compellingly.
Through this guide, you've learned how to create, customize, and differentiate between histograms and other chart types in Google Sheets. We've covered everything from the basics to more advanced customization, ensuring you have a strong foundation. Your journey to becoming a data visualization expert is just beginning!
forms.app, your free form builder
- Unlimited views
- Unlimited questions
- Unlimited notifications
