Mobile technology is developing rapidly, and mobile devices have gone beyond being communication tools. Mobile devices are integrated into every aspect of the lives of people of all ages. People frequently use their smartphones and tablets for shopping. Mobile marketing has, therefore, become extremely important for companies to engage with their target audience and promote their products or services.
The importance of mobile marketing has also been undeniable for companies. Keeping up with digitalization and fulfilling the requirements of age are the first requirements for a brand to succeed and grow. To provide you with further insight into the topic, we have compiled 100+ eye-opening mobile Statistics. Without further ado, let's move on to our article.
Why do you need mobile statistics for your business?
Being successful in today's competitive digital market is only possible by understanding the needs of customers and making a difference. Mobile statistics will help you meet your customers' expectations and stay ahead of your competitors. Also, with the help of mobile phone usage statistics worldwide, you can:
- See how you can better reach your target audience.
- Analyze smartphone usage statistics and make comparisons.
- Offer your target audience more positive and personalized experiences.
- Understand the wants and needs of your potential customers.
- See how to increase your brand awareness with mobile marketing and ensure customer loyalty.
Data on how users use their mobile devices will allow you to understand customer behavior and habits better and optimize your products and services. Managing mobile marketing strategies more effectively will help you stand out among your competitors.
100+ Amazing mobile statistics for you to boost your success
Reading mobile statistics will help you see people's habits and preferences in areas such as mobile apps and mobile games. Check out our 100+ mobile statistics to get all the essential information on the subject. Categorized smartphone statistics allow you to approach the subject from many perspectives. Here are 100+ mobile statistics to gain insightful knowledge:
Mobile usage statistics
Mobile usage statistics will give you a general idea of the topic without diving into specifics. You can learn about people's mobile device usage frequency and habits through statistics. You may gain insights for your business and compile useful information by checking out mobile usage statistics. Here are some statistics about mobile usage:
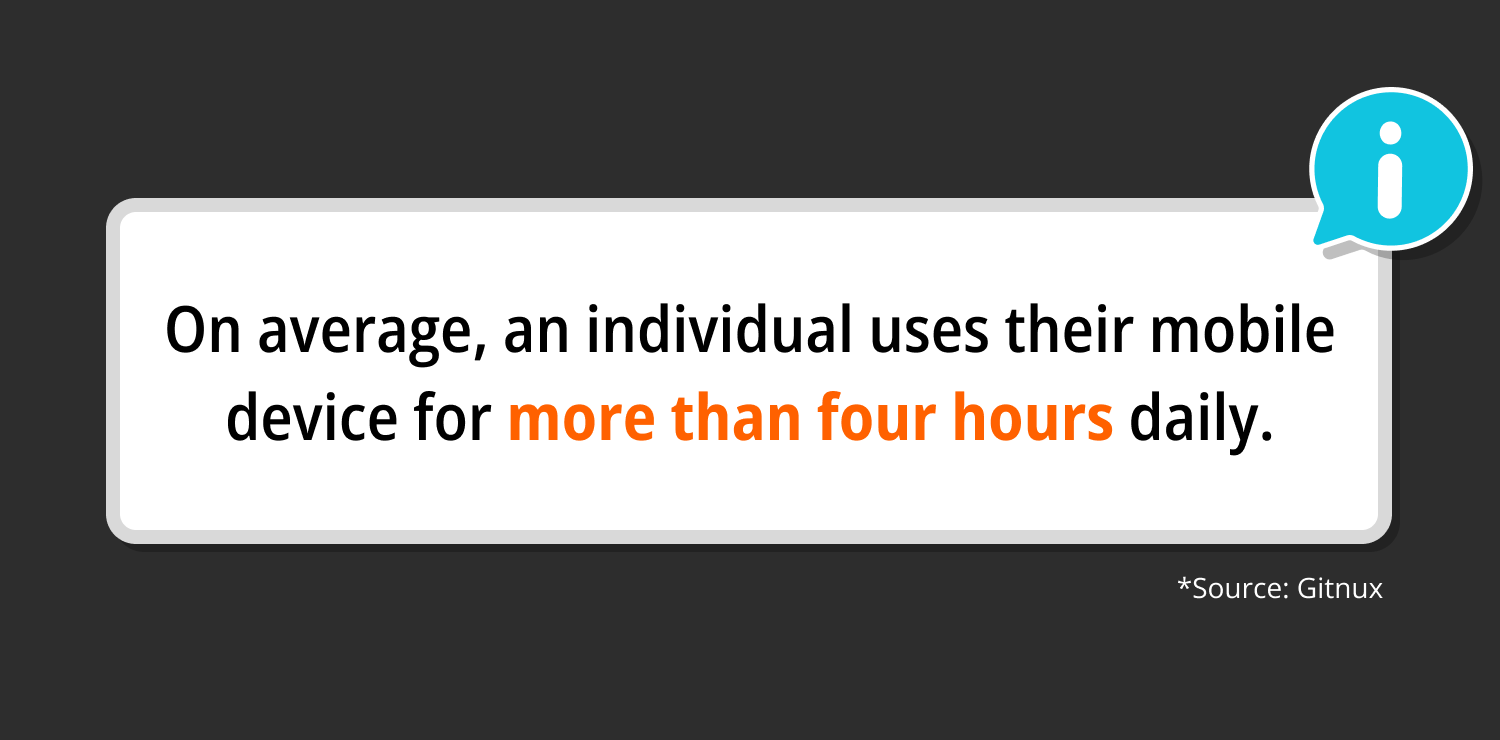
1. On average, an individual uses their mobile device for more than four hours daily (Gitnux).
2. The number of unique mobile users is increasing at a pace of 2.7% annually. Meanwhile, over the previous 12 months, hundreds of millions of people have also upgraded from "feature" phones to smartphones (DataReportal).
3. A total of 3.6 billion people used social media on their phones in 2020 (Gitnux).
4. The amount of data traffic on mobile networks increased by 33% between Q3 2022 and Q3 2023 (Ericsson).
5. With 5.60 billion "unique" mobile users by October 2023, mobile phones are used by more than two-thirds of the world's population (DataReportal).
6. Mobile devices are used for 58% of Google searches (Research.com).
7. Over the previous 12 months, there was a 145 million increase in the global total number of unique mobile users (DataReportal).
8. More than 90% of smartphone users check their mobile devices within the first hour of getting up (Gitnux).
9. By the end of 2029, each smartphone's monthly global mobile data traffic is anticipated to reach 56 GB (Ericsson).
10. In January 2021, there were 5.22 billion unique mobile users worldwide (Gitnux).
11. Video traffic is predicted to make up 73% of all mobile data traffic by the end of 2023 (Ericsson).
12. As of 2023, 270 million Americans, about 81.6% of the population, are smartphone owners (Zippia).
13. Seven nations spend more than five hours daily in front of a phone screen. Furthermore, 18 countries under review outperformed the Q3 2021 average of 3 hours 43 minutes (Exploding Topics).
14. Globally, there are about 6.92 billion smartphone users. By 2023, that will represent 86.29% of the world's population (Zippia).
15. Given that half of all screen time sessions start within three minutes of the previous one, picking up your phone can develop into a habit (Exploding Topics).
16. The average American checks his phone 96 times a day, or once every ten minutes (Zippia).
17. 11% of people say they use their phones for more than seven hours every day. Furthermore, only 5% of Americans said they use their phones for less than an hour a day (Exploding Topics).
18. In 2023, 78% of American millennials viewed videos on their smartphones at least once a week (Demandsage).
19. The total number of smartphone users worldwide increased at an average yearly rate of 6.2% between 2013 and 2024, with the largest growth occurring in 2014. There was a 20.9% increase in smartphone users that year (Oberlo).
20. In the US, smartphone users touch their devices 2,617 times a day on average (Demandsage).
💡If you are curious about more statistics, check out our SaaS business statistics and get ideas.
Source: Gitnux
Mobile app usage statistics
There are thousands of applications accessible through smartphones and tablets that are used in many different categories and for different purposes. Mobile app surveys and mobile app usage statistics will allow you to see what kind of apps users use, how long they use them, and how this usage is shaped. Here are some useful mobile app usage statistics for you to learn:
21. Just 11% of smartphone users' time is spent on webpages; 89% of their time is typically spent on applications (Gitnux).
22. In 2022, 3.8 trillion hours were spent using mobile apps (MobiLoud).
23. The average American mobile user has over 100 installed apps on their smartphone (Gitnux).
24. While only 65.7% of women between the ages of 55 and 64 reported using chat apps for work-related purposes, women between the ages of 16 and 24 reported the highest usage of these applications (Statista).
25. By 2024, mobile apps are expected to generate over $935 billion in revenue (buildfire).
26. According to a survey, social media and messaging apps rank among the top three app categories users spend the most time on, with 49% of respondents indicating. In the 2019 survey, 26% of participants expressed the same views regarding gaming apps (Statista).
27. Social networking apps rank among the most popular apps used by over 70% of millennials (MindSea).
28. 38% of US mobile game publishers have their games available on the App Store and Google Play (42Matters).
29. Since 2016, the total number of apps that can be downloaded globally has grown by 82% (MobiLoud).
30. In 2019, it was projected that 204 billion mobile apps were downloaded by mobile users (Gitnux).
31. According to a survey about mobile app usage by age conducted during the third quarter of 2022, 94% of male users between the ages of 16 and 34 said they used mobile messenger apps for business (Statista).
32. Thirty days after downloading an Android app, 2.6% of users will still be using it. For apps on iPhones, it is 4.3% (MobiLoud).
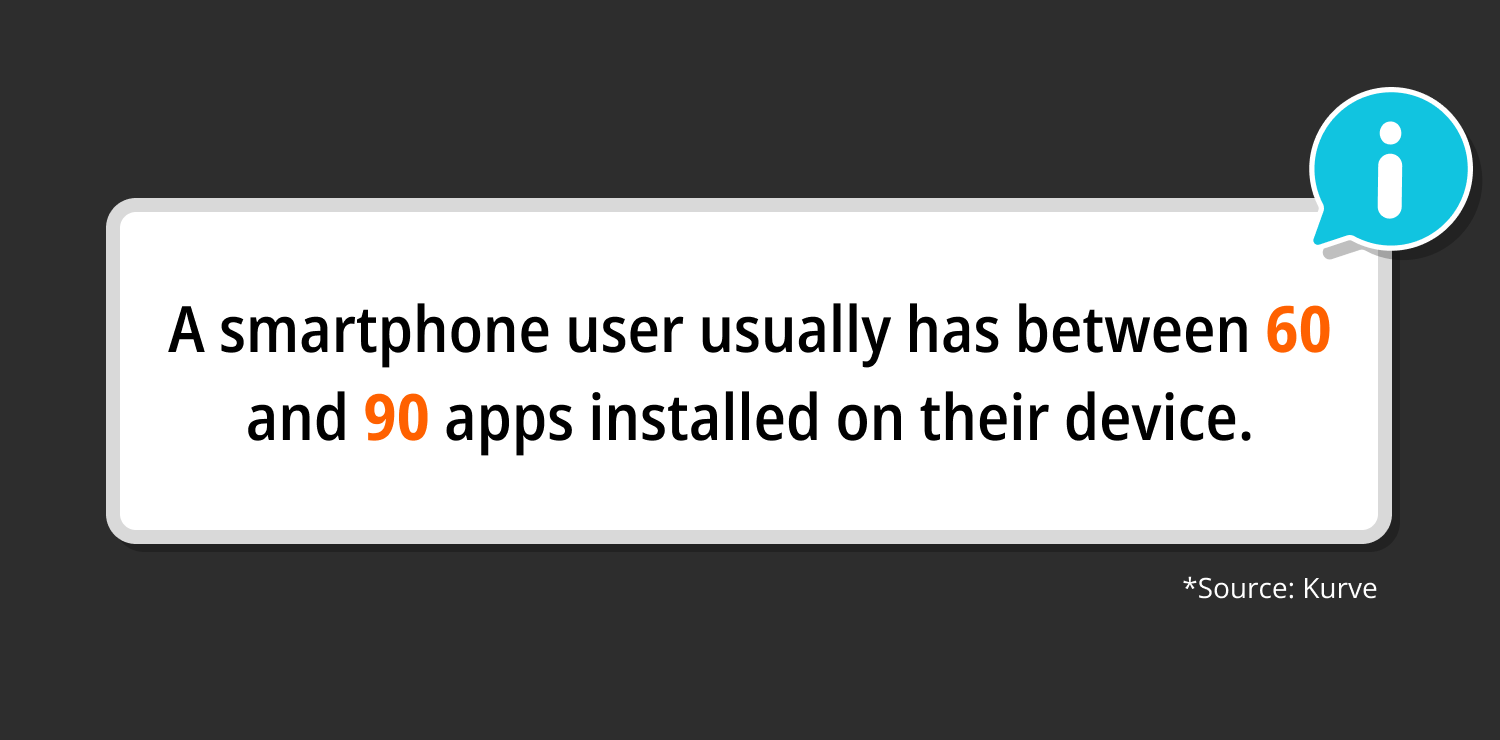
33. A smartphone user usually has between 60 and 90 apps installed on their device (Kurve).
34. By category, sports applications had the highest proportion of male users at 94%, while health and fitness had the highest proportion of female users at 63% (Business of Apps).
35. A 2022 survey revealed that globally, mobile gamers between the ages of 20 and 29 spent an average of 19.7 minutes a day on action games, while they only spent 15.4 minutes a day on casual games. Younger mobile gaming audiences have greater overall user engagement levels in mobile gaming (Statista).
36. A website with a bad mobile experience will lose the trust of smartphone users by 50% more than an app (Gitnux).
37. In 2021 alone, 2 million new apps were launched (MobiLoud).
Source: Kurve
Mobile marketing statistics
Reading mobile marketing trend statistics will help you formulate the right strategies for your company. By correctly creating your mobile marketing strategies, you can increase your brand awareness, strengthen customer loyalty, and increase your sales by interacting with the right audiences. To help you understand, below are some mobile marketing statistics:
38. All industries combined had an average mobile conversion rate of 3.48% in 2019 (Gitnux).
39. 90.09% of businesses using SMS marketing claim it is a successful marketing strategy (SimpleTexting).
40. The US is expected to spend 61.3% of its entire digital ad budget on mobile advertising in 2021 (Gitnux).
41. In the app stores in 2021, 320,000 dollars was spent per minute (MobiLoud).
42. 2023 saw a 56% growth in the use of SMS marketing year over year, with 86% of business owners and marketing managers reporting that they have texted clients using this method (SimpleTexting).
43. The size of the worldwide mobile marketing campaign was 11 billion dollars in 2020, and it will continue to increase to 57.85 billion dollars by 2030. This indicates a compound annual growth rate (CAGR) of over 18% (Statista).
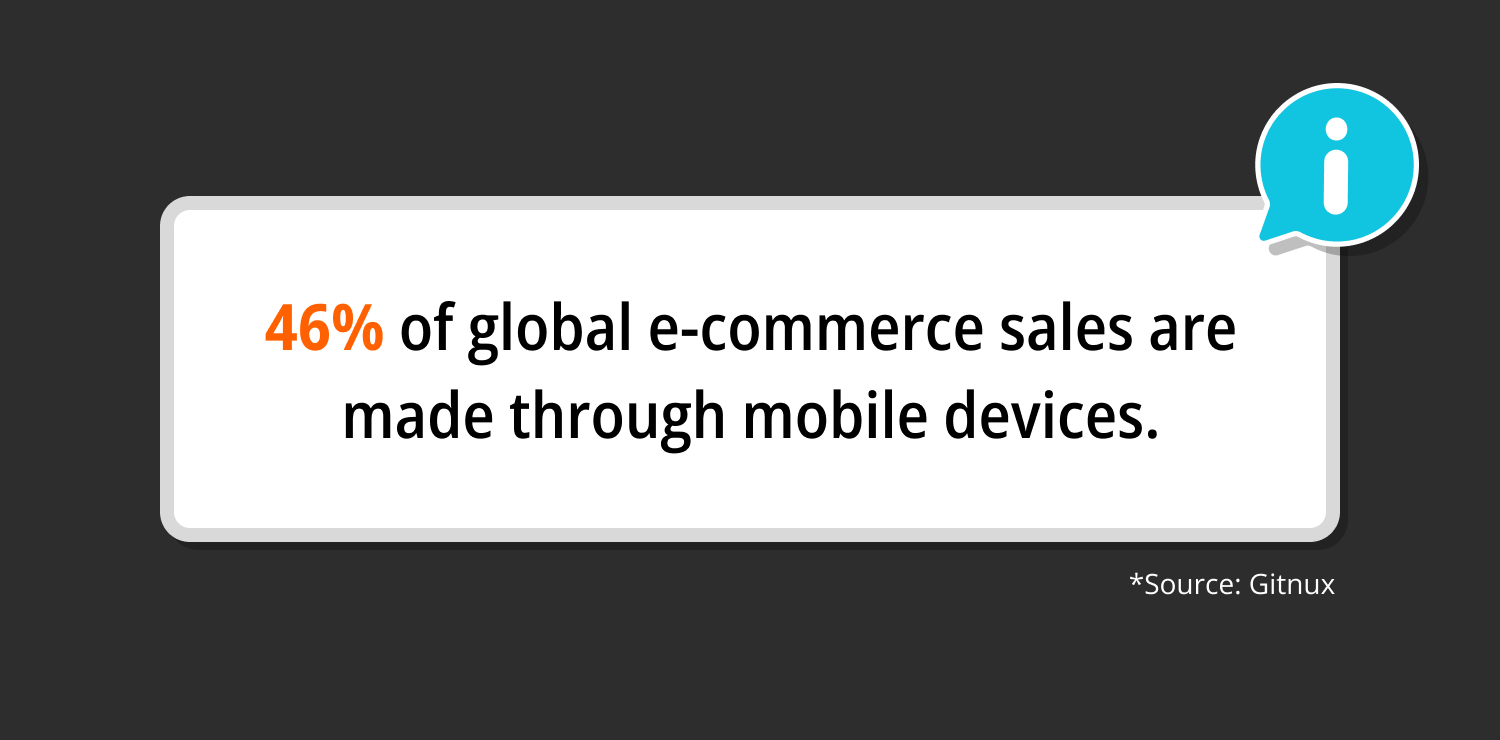
44. 46% of global e-commerce sales are made through mobile devices (Gitnux).
45. Companies that use marketing messages clients are 217.33% more likely to report success than those who don't use text messaging (SimpleTexting).
46. Two out of every three dollars spent on mobile is driven by marketing (data.ai).
47. With a 14.1% YoY increase, mobile ad marketing campaign revenues hit a record 154.1 billion dollars in 2022, accounting for 73.5% market share of all internet ad revenues (IAB).
48. The worldwide email marketing market was estimated to be worth 7.5 billion dollars in 2020, and by 2027, it will continue to grow to 17.9 billion. During that time, a 13.3% compound annual growth rate (CAGR) is anticipated (Statista).
49. When using SMS marketing, 81% of company owners and marketing managers also integrate SMS with HubSpot, Mailchimp, Salesforce, and other marketing platforms or channels (SimpleTexting).
50. 72% of computer, tablet, and smartphone owners prefer location-based marketing (LLCBuddy).
51. By 2024, the amount spent on mobile marketing will exceed 413 billion dollars (Luisa Zhou).
52. 77% of smartphone shoppers are more inclined to purchase from a company if its mobile website or app enables fast transactions (Moengage).
53. 63% of smartphone users are more inclined to purchase businesses whose apps or mobile websites provide relevant offers and recommendations (Semrush).
54. It is anticipated that the United States will spend more than 240 billion dollars on mobile marketing (Luisa Zhou).
Source: Gitnux
Mobile gaming statistics
The widespread use of smartphones worldwide has turned mobile games into an entertainment activity that appeals to a wide audience. The mobile gaming industry has grown rapidly, and the number of players of all ages has increased daily. Mobile gaming statistics will guide you in identifying and developing your company's marketing strategies. Here are mobile gaming statistics:
55. 60% of the worldwide video game market's income in 2019 came from mobile gaming (Gitnux).
56. The mobile game market share stands at 50%, or 92 billion dollars, out of the 184 billion dollars that will be generated by all sorts of games in 2022 (Udonis).
57. In 2023, the market for mobile gaming worth 172.10 billion dollars worldwide (Zippia).
58. According to mobile game producers, the competition is the industry's biggest challenge, accounting for 73.1% (Go-Globe).
59. According to a global survey conducted in September 2020, 78% of the people from Thailand said they played games on their mobile devices, making them the country with the largest mobile gaming reach. With a rate of 77% for mobile gaming, the Philippines came in second (Statista).
60. In 2022, revenue from mobile games was 92 billion dollars, with a 6.4% YoY decrease (Udonis).
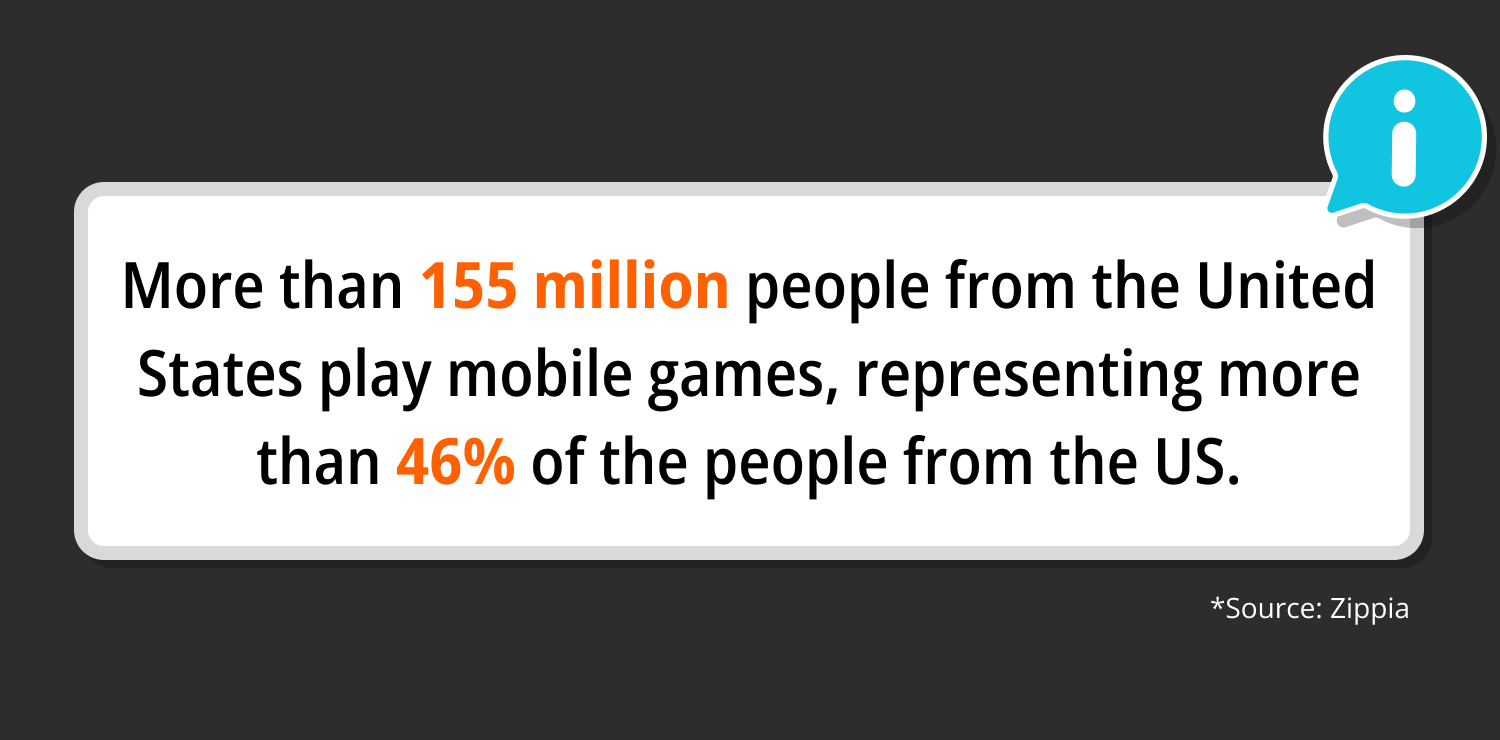
61. More than 155 million people from the United States play mobile games, representing more than 46% of the people from the US (Zippia).
62. In Q4 2022, 295,676 mobile games were available on the App Store (PlayToday.co).
63. 64% of the people who play mobile games are between the ages of 18-34 (Zippia).
64. A projected 270 billion dollars in revenue will come from mobile gaming by 2030, accounting for more than 50% of the worldwide games business (LinkedIn).
65. On Android, there are about 500,000 mobile game applications available (PlayToday.co).
66. Men make up only 45% of mobile gamers, compared to roughly 55% of women (Zippia).
67. In 2022, mobile game ad revenue for sports games fell by 14% (PlayToday.co).
68. About half of American mobile gamers (51%) used iPhones for gaming as of October 2022, while 40% of respondents used Android smartphones (Statista).
69. Playing mobile games takes up 8% of all mobile time (Zippia).
70. The United States' revenue from mobile game advertisements reached 5.49 billion dollars in 2021. It is expected to rise to around 7.9 billion dollars by 2024 (Statista).
71. Globally, there are 2.2 billion mobile gamers (Udonis).
Source: Zippia
Mobile vs. desktop statistics
Mobile vs. desktop statistics will allow you to analyze the distribution of internet usage and user experience on different platforms. With mobile vs. desktop statistics, you can see the differences in the usage of these two platforms and make comparisons. Here are the mobile vs. desktop statistics for you to gain insights:
72. 95% of internet users worldwide use the internet at least some of the time on a mobile device (DataReportal).
73. Compared to desktop web browsing or websites tailored for mobile devices, mobile applications offer greater engagement rates (Techjury).
74. In 2019, the conversion rate for desktop users was 4.14%. In contrast, the conversion rate for tablet users is 3.36%, while the rate for mobile users is 1.53% (Research.com).
75. In Canada, 56% of users prefer desktop computers over mobile devices, with only 39% using desktop computers (Kinsta).
76. In the United States, 5% of emails opened in 2018 came from desktop computers, while 61% came from mobile devices (Research.com).
77. In 2023, 49% of marketing expenditure was on desktops, and 51% was on mobile devices (Luisa Zhou).
78. Compared to mobile, the average order value on a desktop is 40 dollars greater (Tidio).
79. With a traffic share of over 54%, mobile devices outnumber desktops as the most popular device for internet access (Kinsta).
80. In 2019, mobile device traffic made up 50.48% of all web traffic. Meanwhile, 46.51% of all web traffic originated from desktop computers (Research.com).
81. In 2022, 39.34% of website traffic came from computers and tablets, compared to 60.66% from mobile devices (Techjury).
82. Nearly 53% of global web traffic and 57% of online time are now attributed to mobile devices (DataReportal).
83. The average number of pages visited by desktop users is 3.95, compared to 2.67 for mobile users and 3.21 for tablet users (Neil Patel).
84. In 2021, mobile devices accounted for 55% of all website views (Techjury).

Source: Techjury
Mobile commerce statistics
The expansion of digital shopping worldwide has enabled mobile devices to play a prominent role in this field. Brands make many of their sales via mobile devices over the internet. For this reason, mobile commerce statistics allow your brand to see and compare consumers' preferences in this area. Here are important mobile commerce statistics:
85. 42% of customers look for and reserve travel accommodations on their mobile devices (Gitnux).
86. The percentage of overall mobile e-commerce has been steadily increasing, from just 56% in 2018 to a projected 62% in 2027 (Statista).
87. In 2023, mobile commerce sales surpassed 415.93 billion dollars, representing 6% of retail sales (Forbes Advisor).
88. Mobile devices were used to conclude sales in 58% of all multi-device purchases made in 2020 (Research.com).
89. In 2022, 1,419 games and apps brought in over 10 million dollars. Ten earned over 1 billion dollars in revenue, while 224 exceeded 100 million dollars (Udonis).
90. In 2024, mobile commerce is projected to account for 44.6% of all retail e-commerce sales in the United States (Insider Intelligence).
91. Mobile e-commerce sales hit 2.2 trillion dollars in 2023, accounting for 60% of global e-commerce sales, according to Statista's Market Insights (Statista).
92. 78% of all mobile data traffic worldwide is predicted to come from mobile video content by 2023 (Gitnux).
93. In 2023, online shopping is predicted to account for 20.8% of retail sales (Forbes Advisor).
94. 54% of all mobile commerce payments are made through specialized applications, which are the primary method for conducting online shopping (Tidio).
95. By 2025, it is anticipated that 710 billion dollars in sales will come from mobile commerce (Forbes Advisor).
96. The US is expected to spend 61.3% of its entire digital ad budget on mobile advertising in 2021 (Gitnux).
97. Retail mobile commerce sales in the US are expected to reach 558.29 billion dollars by 2024, making up 7.4% of all retail sales (Insider Intelligence).
98. A website that isn't mobile-friendly will lose 61% of its visitors (Luisa Zhou).
99. Smartphones are used by 49% of mobile shoppers to compare product or service prices (Tidio).
100. The e-commerce market is projected to grow to a value of over 8.1 trillion dollars by 2026 (Forbes Advisor).

Source: Luisa Zhou
Conclusion
Mobile technology has become a lifestyle rather than a tool for people. Daily life and consumer habits have been shaped and changed around mobile technology. For this reason, companies that cannot adapt to the benefits of mobile technology are doomed to failure. Understanding the desires of potential customers and meeting their needs enables companies to succeed in the mobile world.
In this article, we have compiled 100+ eye-opening mobile statistics for 2025. Reading our statistics will guide you through this topic and ensure your company is ahead of the competition in 2025. You'll be able to evaluate information and come to wiser conclusions. Check out our statistics and learn everything you need about the mobile world!
Fatih is a content writer at forms.app. He is also a translator and interpreter. Fatih loves reading and writing. He is passionate about exercising and traveling. His specialties are surveys, statistics, and translation.
