Has your business's profit rate decreased? Did your newly opened shop bring in more income this season? Have your customers expressed their dissatisfaction lately? You can collect historical data and apply descriptive analysis to find out the reasons. It will help you to identify key factors about the event. It will show your good or weak sides.
In this article, you will see how you can benefit from descriptive analysis. It is not a complicated research method. So you shouldn't need to worry about it. But first, you need to know its definition, so start from the heading below.
What is descriptive analysis?
Descriptive analysis is a data analysis technique using historical data to describe and demonstrate a condition.
It reveals the patterns and relationships of data points in the simplest way. That's why it gives the quickest response to find out why an event happened. On the other hand, because of this simplicity, researchers sometimes need to make manual inputs. However, they can achieve productive results when they work systematically.
Descriptive statistical analysis is often called the most basic analysis for summarizing data. That's why it's frequently used as a stepping stone to other types of comprehensive analysis, such as diagnostic analysis, predictive analysis, and prescriptive analysis.
Descriptive analysis types
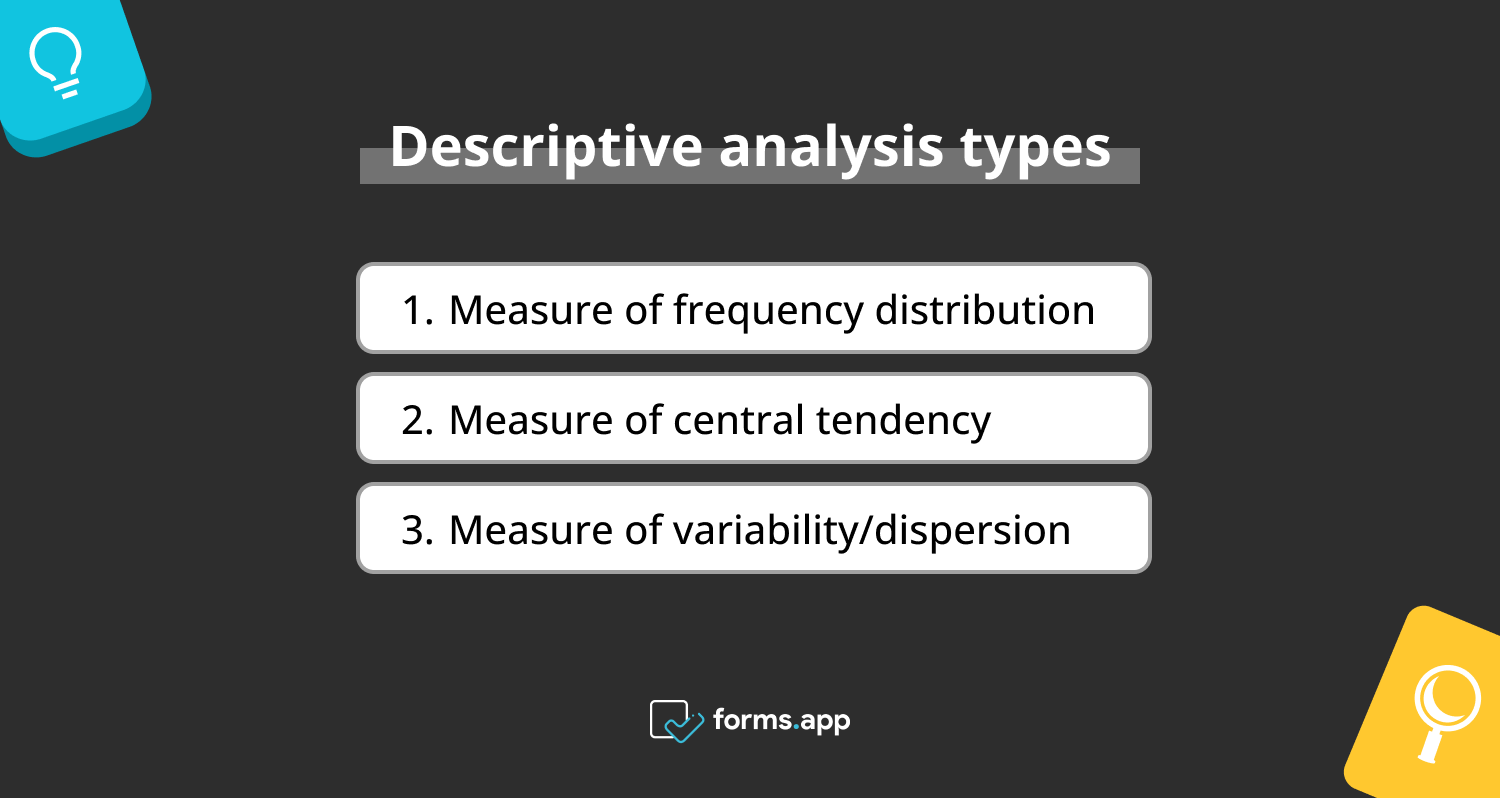
There are three types of descriptive analysis tools that you can utilize. Although these are generally associated with univariate analysis methods, you can also use them with statistics methods such as bivariate, multivariate, and time series.
Since a lot of calculations are required, it is used with many calculation programs.
For example, descriptive analysis in Excel allows users to calculate summary statistics of their dataset. Below, you can check each of the types with descriptive analysis examples to get a better understanding of the topic:

Types of descriptive analysis
1. Measure of frequency distribution
It can be the most basic summary of the dataset. It is used to show how often each value occurs in a dataset. However, you should remember that it is slightly different than the mode. It will be explained with an example.
Example: There are four different phone brands in the market. These are A, B, C and D brands. The daily sales amount of brand A phones is 3, B phones is 4, C phones is 5 and D phones is 6. These are, respectively, the frequency distribution. On the other hand, there is no mode in this dataset because there is no frequent number. With this simple process, you can identify patterns and then make informed decisions.
2. Measure of central tendency
It is used to find the average of a dataset. It also serves as a body for using other measures. There are three common measures you can use: mean, median, and mode.
- The mean is the mathematical average of values. You add all numbers together and divide them by the total number of values. You can apply the sample mean formula if you want to examine a specific group in your analysis.
- The median is the middle point in the dataset. You can use formulas based on odd and even numbers to find the median of a dataset.
- Lastly, the mode is the most frequent value. There is no rule that there will always be a mode. Sometimes, there are no modes, or there is more than one mode.
Example: Assume that you collected data about your customers’ ages. The average of their ages will show you the mean. For example, it is 32. Now, you analyze the mode and find its value to be 30. Now, you can use this data. You may take action to increase the satisfaction of your customers in their 30s by focusing on them, or you can consider this analysis as a start if you want to reach wider age ranges.
3. Measure of variability/dispersion
It finds the dispersion of data points by describing how far they are from the distribution point and each other. There are four common measures you can use: range, interquartile range, standard deviation, and variance.
- The range is the difference between the highest and the lowest values.
- The interquartile range is the middle half of a distribution.
- The standard deviation is the average distance from the mean.
- The variance is the average of squared distances from the mean.
Example: You are considering providing standard deviation to measure and prove your data quality. The data you have contains the product prices that customers prefer most. These are worth $20, $25, $30, $35, and $40, respectively. When you average it, it becomes 30. When you look at how much the other values deviate from the mean value, you find that the variance is 62.5, and the standard deviation is 7.9.
Frequently asked questions about descriptive analysis
Do you have more questions about descriptive analysis? Do you want to make yourself proficient in this type of analysis? You can check out the most common inquiries around it below.
You can utilize descriptive analysis in various scenarios. For example, you can analyze your company's website traffic to find out where people find you on the web. You can understand product trends by examining purchase histories in your store. Thus, you can take action for customer satisfaction according to demand.
They are both proper techniques for conducting descriptive analysis. However, some data scientists may find quantitative descriptive analysis more concrete and scientific. However, the fact that qualitative analysis is adopted even by large companies shows that this type is also essential.
First of all, measures of frequency. The aim is to express the frequency of an event generally in numerical expressions. Secondly, the measures of central tendency. The goal is to find the general trend by calculating the mean, median, and mode. Thirdly, measures of dispersion. It aims to measure the distribution of data by employing range or standard deviation. And lastly, measures of position. It seeks to measure the relationship of a value with other values and its environment.
Descriptive analysis is applicable in all areas where data is available. For example, businesses can use it to obtain information about their customers and enhance their product development and marketing strategies. It can be used in education for strategies and developments about students, exams, and courses. In finance, it can be used to get information about things like stocks, inflation, company earnings, etc.
Descriptive analysis is the simplest and most basic type of data analysis. It is because it conveys what is as it is without adding any additions or interpretations. So, if you need a quick diagnosis of what happened, descriptive analysis will always be there for you. Human input is more significant than what analysis reveals. Therefore, descriptive analysis is often used for non-comprehensive data analytics.
Key points to take away
Descriptive analysis is the fundamental analysis method for business data analysts. It is essential to use it in order to understand what the data is and to make evaluations accordingly. It is waiting to be used to unearth fundamental phenomena and assist businesses in historical data research.
In this article, descriptive analysis is explained, as well as its various types. Other important points are also mentioned in the FAQ section. After this, you can now use descriptive analysis to understand the data. You're ready to utilize historical data to make insightful decisions.
forms.app, your free form builder
- Unlimited views
- Unlimited questions
- Unlimited notifications


![150+ Fun poll questions for any event [2026 edition]](https://file.forms.app/sitefile/100_fun_multiple_choice_poll_questions_1.webp)

