How to create Google Forms Reports (2026 Guide)

Summarize with
TL;DR: How to Create a Google Forms Report
The simple way
1. Open your form in Google Forms and click the Responses tab to see a built-in Summary, Individual, or Question view
2. To build a proper report, export your data to Google Sheets via "Create Spreadsheet Export"
3. In Sheets, select a column or custom data range.
4. Click Insert, then Chart from the toolbar at the top.
5. Customize your chart & share.
The advanced way
1. Export your responses using the same method as above and name your data ranges
2. Add a new sheet
3. Use the COUNTIF formula to tally answers
4.Insert a chart from your summarized data and share the spreadsheet with your team
Collecting responses with Google Forms is easy. But, turning those responses into a readable, shareable report is a different story. Google Forms has a basic built-in summary view, but the moment you need anything beyond basic Google Forms statistics, like filtered data, custom charts, or a PDF to send to a client, you're headed into Google Sheets territory, and things get more complex fast.
This guide walks you through every reporting option Google Forms offers, including the step-by-step Google Sheets method that most tutorials stop at. It also covers what Google Forms genuinely can't do, practical tips to get more out of what it does offer, and how forms.app handles reporting if you'd rather not spend time writing COUNTIF formulas.
What Is a Google Forms Report?
Before diving into the steps, it helps to know what "a Google Form report" actually means, because the tool offers three distinct view options for form results and a sync option for Google Sheets.
The Summary tab shows aggregate results for the whole form: bar charts for multiple-choice questions, word clouds for open-text answers, and basic totals. It's automatic and requires no setup, but it can't be customized, filtered, or exported as a formatted document.
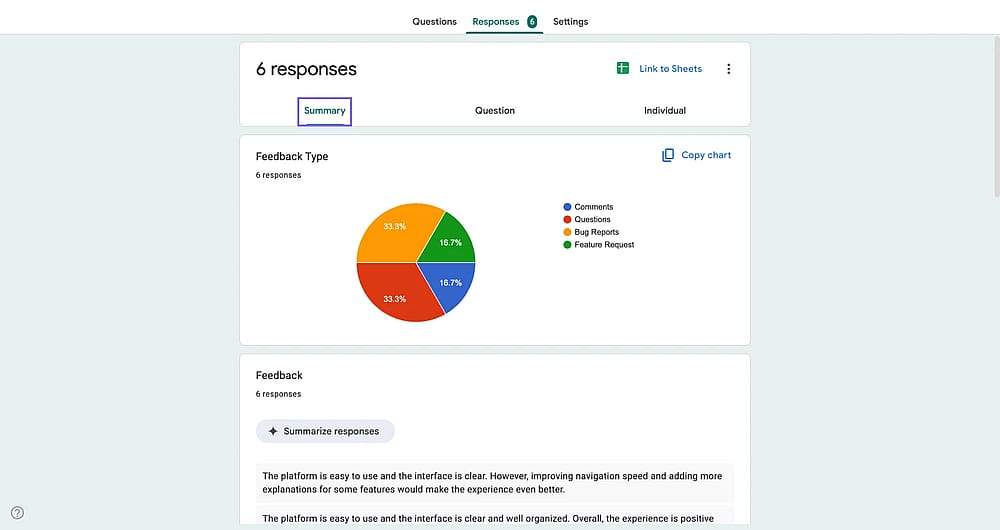
Summary tab on Google Forms
The Questions tab lets you select one question and see the answers to that question.
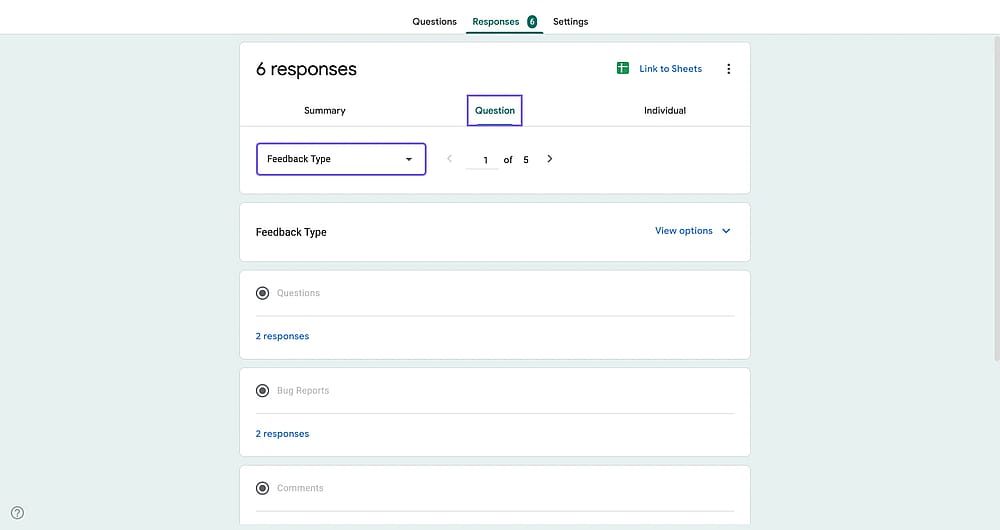
Questions tab on Google Forms
The Individual tab shows you each submission one at a time, which is useful for reviewing a specific respondent's answers but impractical for analysis across many submissions.
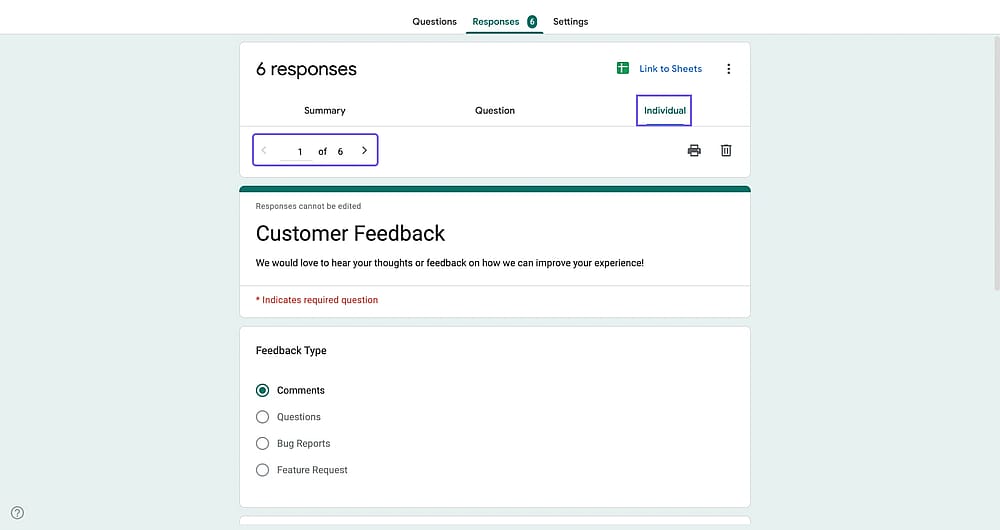
Individual tab on Google Forms
The Google Sheets export sends all responses into a linked spreadsheet, where you can build actual charts, apply formulas, and create something that looks like a report. This is what most people mean when they talk about generating a Google Forms report, and it's the process this article covers in detail.
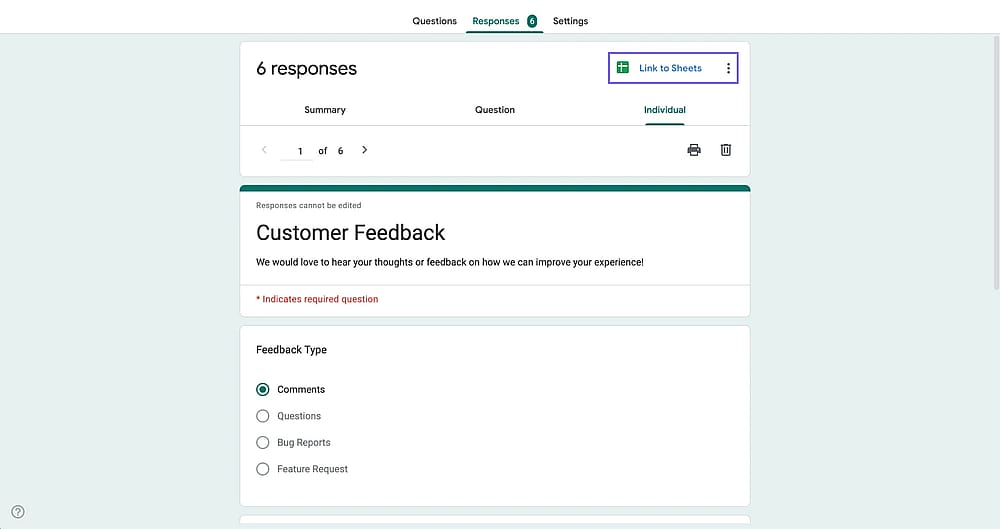
Google Sheets linking option on Google Forms
How to create Google Forms reports (The simplest way)
This is where a real report takes shape. In this process, you will export your raw response data into a clean sheet and turn it into charts you can present or share.
1. Export your responses to a new spreadsheet
To create a new spreadsheet, you must open your form in Google Forms, select Responses at the top of the page, and click “Link to Sheets” to export your survey results.
Pro tip
Alternatively, you can click on the three dots and download your results in a CSV file, then open it with MS Excel or use it otherwise.
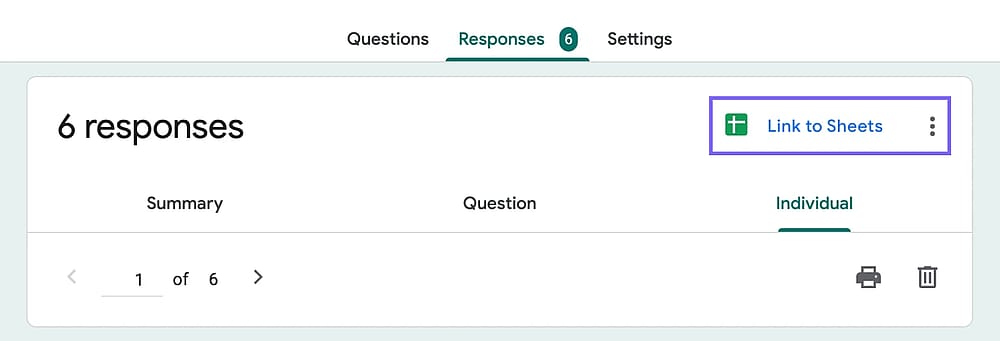
“Link to Sheets” option under the responses tab
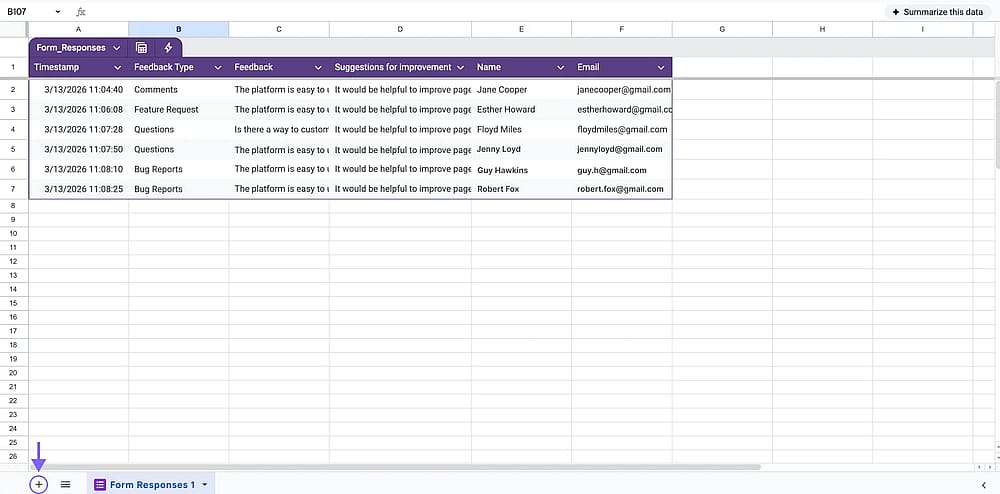
2. Select a data range
Click the letter at the top of the column to highlight all the responses for a question. You can select multiple columns using CTRL + left click.
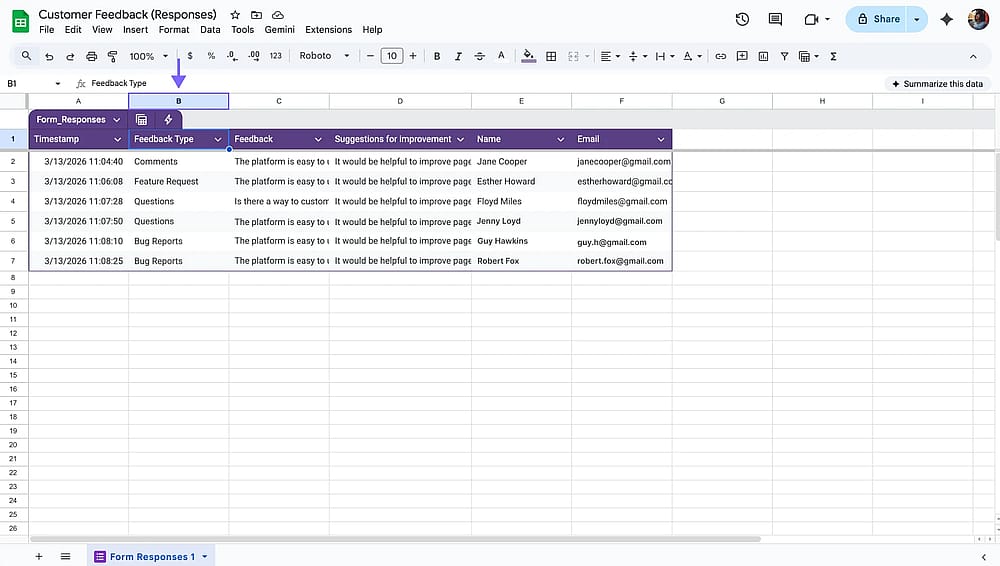
Selecting a range of data in Sheets
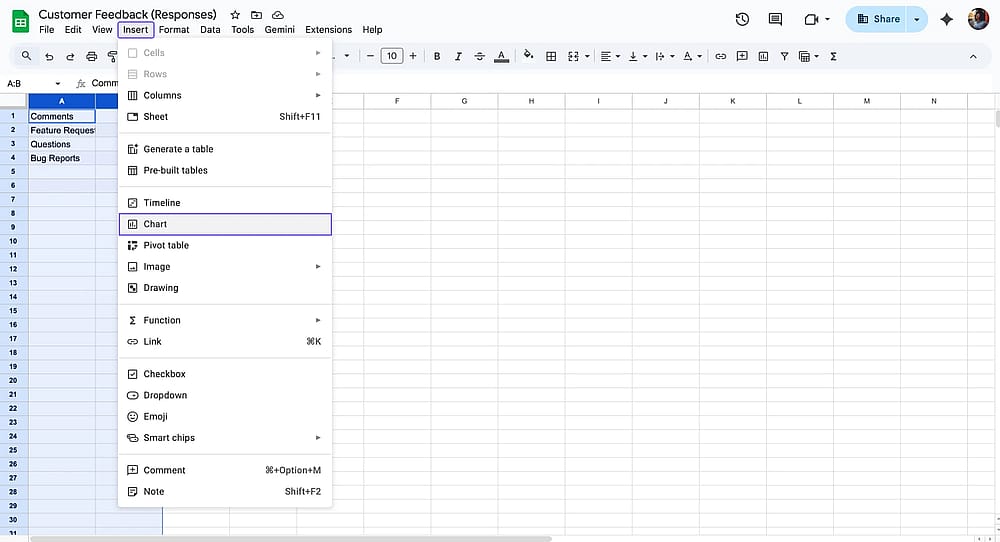
3. Insert a chart
Click Insert, then Chart from the menu bar. Google Sheets will automatically read the selected column and generate a chart.
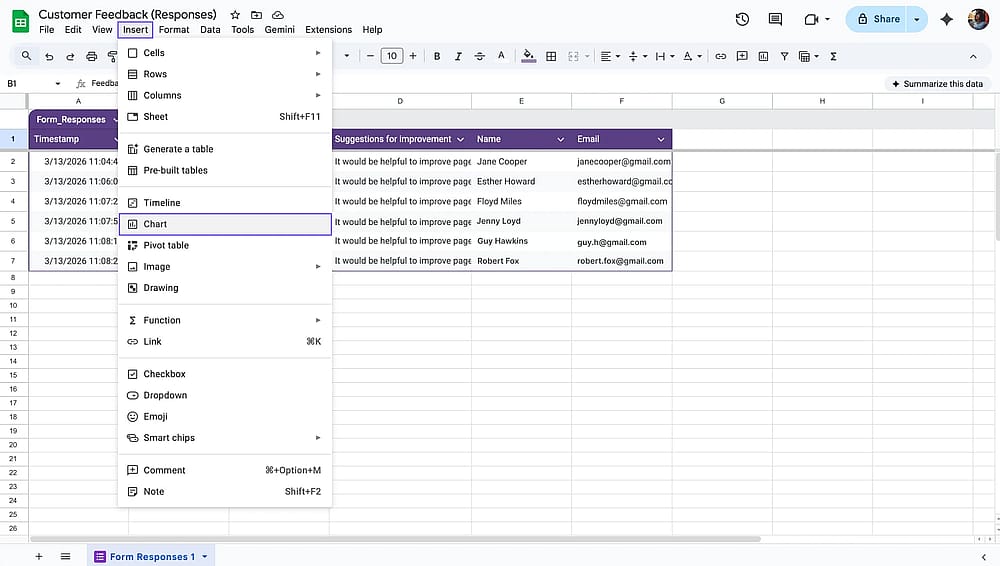
Inserting a chart in Google Sheets
4. Customize the chart
Open the Chart editor panel on the right to switch the chart type (pie, bar, column, etc.), and the data ranges under the Setup tab. You can also adjust the title, colors, and labels under the Customize tab.
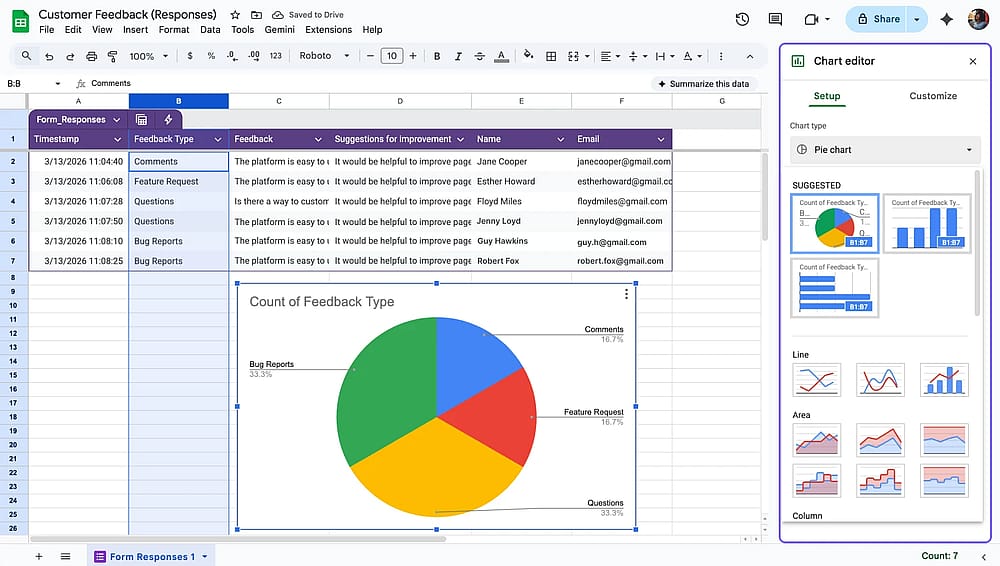
Customizing a chart in Google Sheets
5. Share or download
Use the Share button to give colleagues access to the spreadsheet, or go to File, then Download to export as a PDF or Excel file.
Sharing the Google Form report using the Share button
How to create a Google Forms report (The advanced way)
Google Sheets is an ocean. Once you export your option, there are quite advanced ways to create reports, and even dashboards! Here’s one of the advanced ways of creating a Google Forms report on Google Sheets.
To create more advanced reports, check out this detailed tutorial on how to create dashboards on Google Sheets by David Benaim.
1. Export to Sheets & name your data ranges
Export your Google Forms results to Google Sheets following the same steps as above.
In the Sheets, select a column, click Data from the toolbar, and select Named Ranges.
Afterward, type in the name of the range, and be careful not to give it a name with no spaces or punctuation or begin it with a number. Then click Done. For example, you can enter feedback_type (with no spaces, no punctuation, and you can't start with a number). Repeat this for each question you want to include in your report.
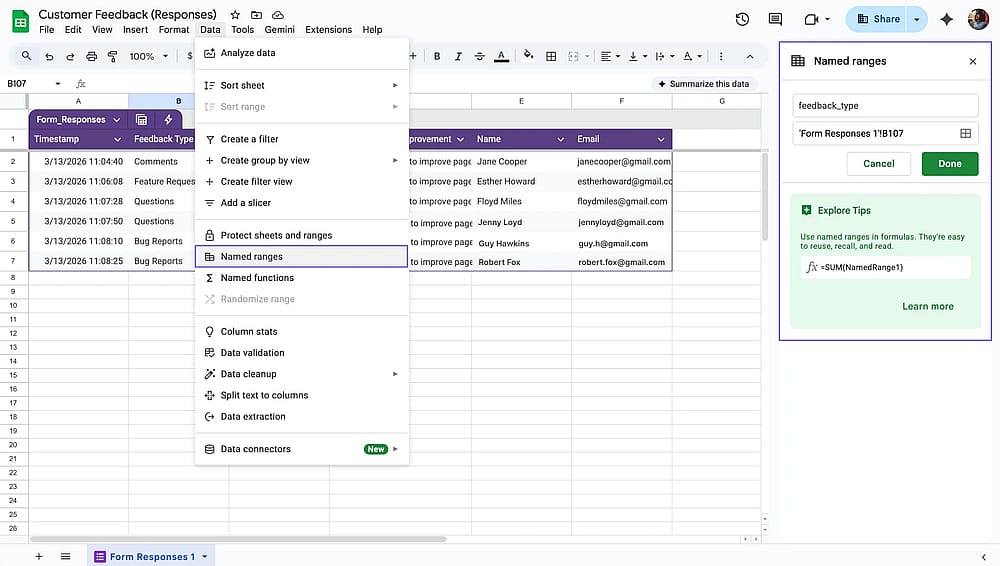
Naming data ranges in the linked Google Sheets
3. Create a summary sheet
Click the + icon at the bottom left of the spreadsheet to add a new sheet. In column A of this new sheet, list all the possible answer options for the question you named in Step 2. If the question used a 1–5 rating scale, list 1, 2, 3, 4, and 5 vertically down column A.
Creating a summary sheet by clicking the plus button on the bottom left
4. Apply the COUNTIF formula
In cell B1 of your summary sheet, enter the following formula:
=COUNTIF(feedback_type, A1)
Replace feedback_type with the name you gave your range. Google Sheets will typically offer to auto-fill the same formula for all rows below. This formula counts how many times each answer appeared in the original data.

Entering the COUNTIF formula to count and fetch answers
5. Create a chart
Highlight all data in columns A and B, then click Insert, then Chart. This time, the chart is built from your summarized counts rather than raw text, which produces much cleaner and more accurate results. Choose your chart type under the Setup tab and customize the appearance under Customize.
Creating a chart for the selected columns
Limitations of Google Forms Reporting
Google Forms works well enough for simple data collection, but its reporting capabilities have real gaps that are worth understanding before you commit to a workflow built around it. To visualize, here’s a comparison table between Google Forms’ reporting capabilities and forms.app’s results page.
Feature/Tool | Google Forms | forms.app |
Basic response charts | ||
Google Sheets is needed | ||
Time filters | ||
Device breakdown | ||
Location/country data | ||
Drop-off analysis | ||
Average completion time | ||
AI response analysis | ||
Customized PDF exports | ||
Shareable live report |
You have a better option: forms.app
Creating a new Google Forms report on Google Sheets can be like learning a new language. It is hard to follow and even harder to remember. You must have a blank form, deal with formulas, and many other things. It is an outdated way of creating forms. Fortunately, there is a much better and easier way.
forms.app is a solid alternative to Google Forms and a powerful online form builder that allows you to create forms effortlessly. It has a drag-and-drop interface and makes collecting and analyzing form data a breeze. The Results tab of our page allows you to see everything. You can also check out our survey report article to learn more about survey reports in general.
Insights
The insights give you a summary of your form results. On the insights tab, you have:
- Filters for time, device, and location.
- The AI insights option to find patterns, outliers, and get a summary.
- A timeline chart to see how your form fares on time.
- A drop-off analysis to find where your respondents leave the form without submitting.
- A world map to visualize from which locations you get responses.
- A device & platform breakdown.
The insights within forms.app is the complete package to get a picture of your form results.
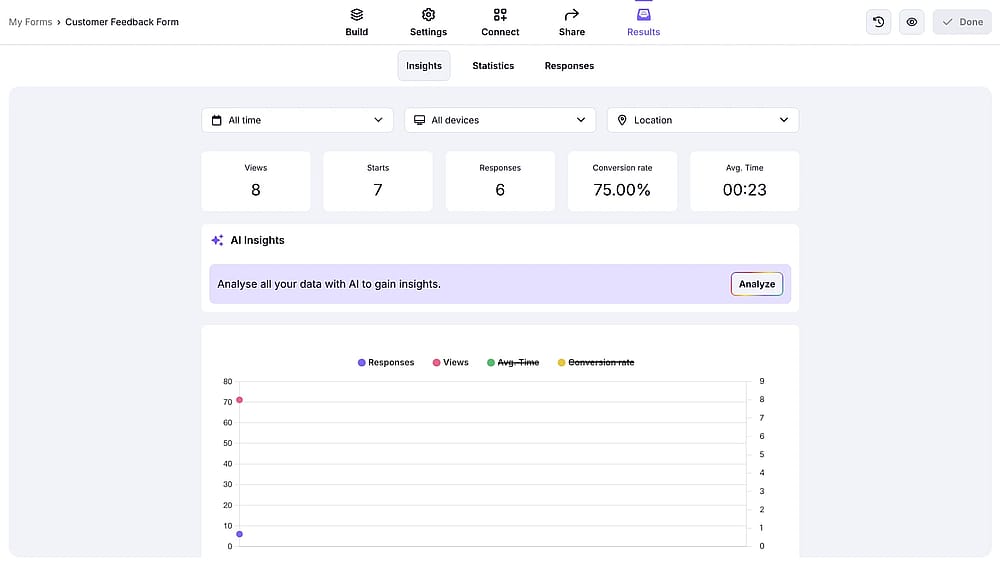
The Insights tab on forms.app
Statistics
On the Statistics page, forms.app gives you a chart for each of your questions, so you can see which options are selected the most, as well as the fill percentage. Plus, the filters can be applied here, just like on the Insights page.
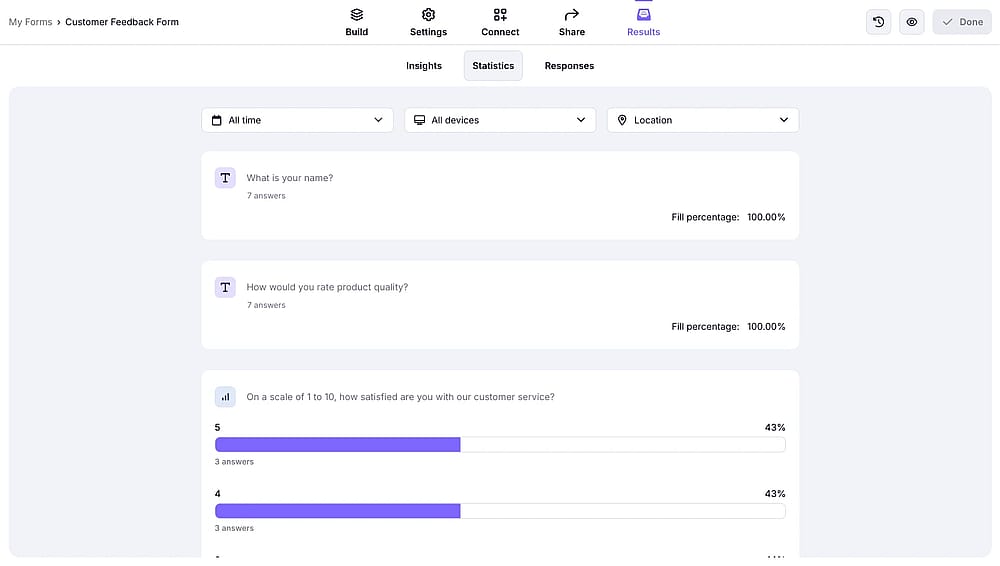
The Statistics tab on forms.app
Responses
This tab allows you to see every individual answer that is given to a question, and you can also sort these answers based on a number of filters. Furthermore, you can then share these responses with your team, archive them, or write a personalized message to the participant who completed the survey.
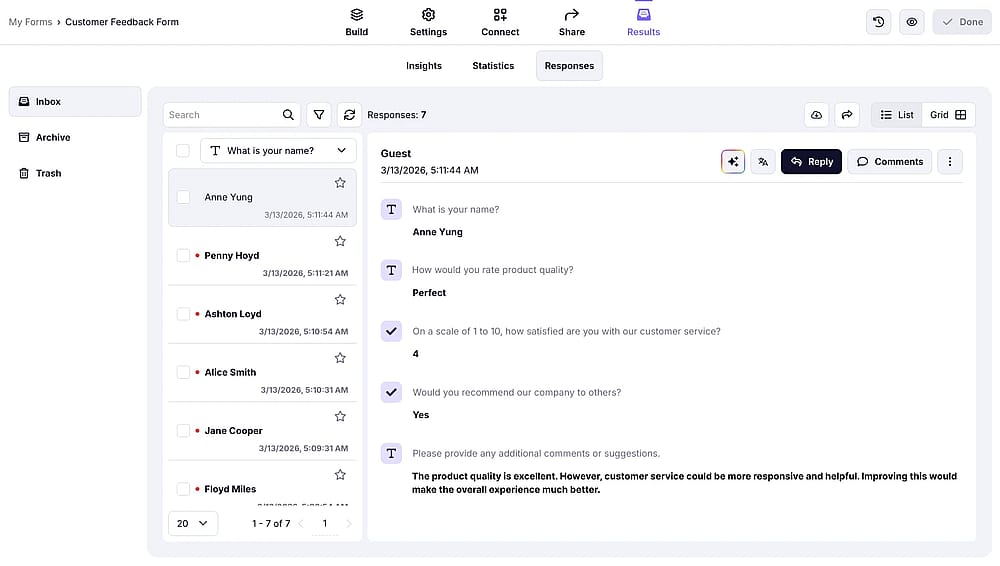
The Responses tab on forms.app
Frequently asked questions about Google Forms reports
Final words
Google Forms is a capable tool for straightforward data collection, and its Google Sheets reporting method is workable once you learn it. But it asks more of you than most people expect, e.g., named ranges, COUNTIF formulas, and manual chart setup. Even after all that work, it still won't tell you where your respondents are from, how long they spent on your form, or what device they used.
If you need a quick report and you're already comfortable in Google Sheets, the method in this guide will get you there. If you'd rather have that information appear automatically, with charts, location data, AI insights, and PDF generation built in from the start, forms.app is the more practical choice.
In this article, we have covered how to create a Google Forms summary report in a simple way and covered creating Google Form spreadsheet for reports in an advanced way. We’ve also touched upon Google Forms’ limitations when it comes to reporting and shared how you can get better form reports on forms.app. We hope you find this Google Forms guide helpful.
Contributors
Researched & written by
forms.app, your free form builder
- Unlimited responses
- Unlimited questions
- Unlimited team members