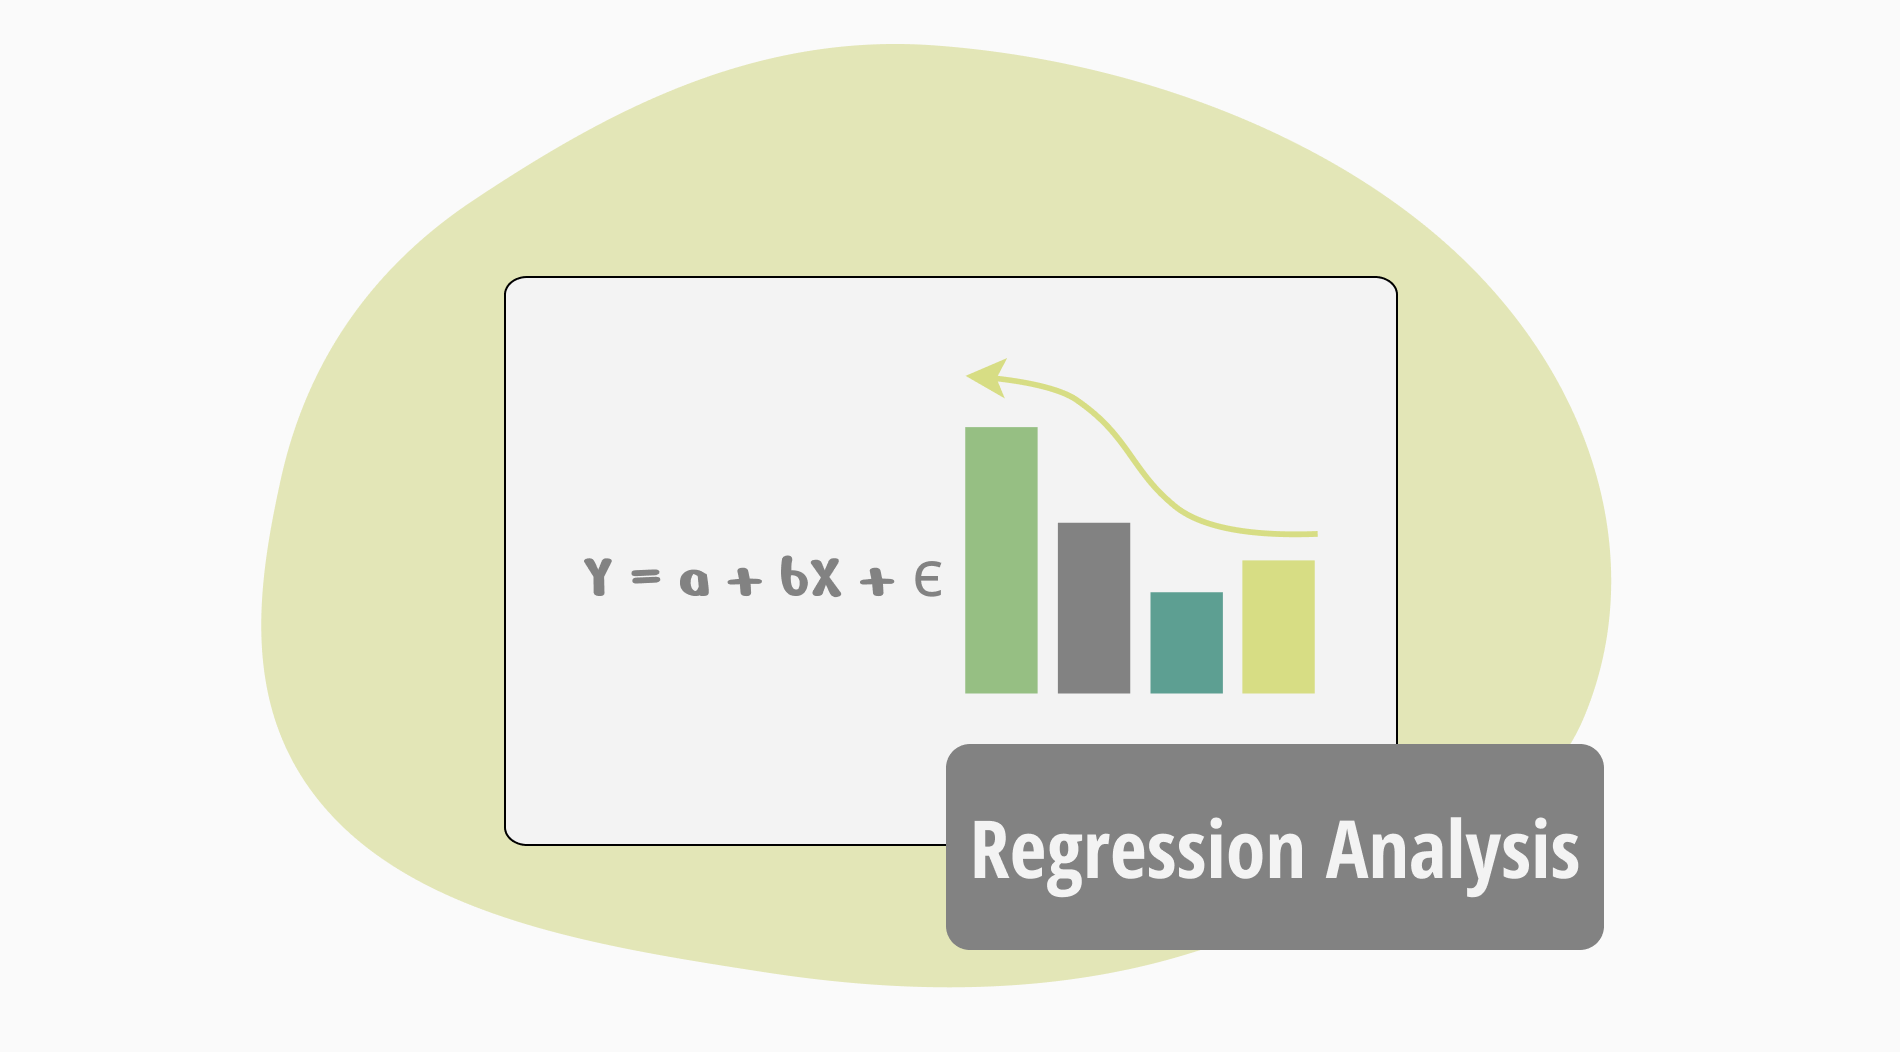
Regression or simple regression is an analysis method that is widely used by the finance world and related disciplines. Are you going to invest? Do regression analysis. Are you going to examine commodity prices? Regression is the solution. You can benefit from regression analysis when making decisions that will affect the finances of your business.
In this article, a simple definition of regression analysis will be given. The main types of analysis and their examples will be listed. Its advantages will be outlined so that you understand why you should use this analysis. Then don't wait any longer and start reading the article.
What is regression analysis?
Regression analysis is a research method used to measure the connections between one or multiple independent variables and a dependent variable.
It helps estimate the value of a dependent variable by examining the changes occurring around it. This is generally objective because it is mathematical data. It is used with data visualization with appropriate tools and reveals curved or straight-line patterns of data points. Thus, businesses will have preliminary information about future situations using this analysis method.
Regression analysis types & examples
While performing the data analysis, you can utilize several methodologies. Each methodology contains unique calculations and offers effective insights into different topics.
You can always take advantage of different kinds of data analysis techniques, such as cluster analysis and conjoint analysis. However, regression analysis will always be your first reference for statistical modeling. For now, regression analysis examples for each type will be mentioned below:
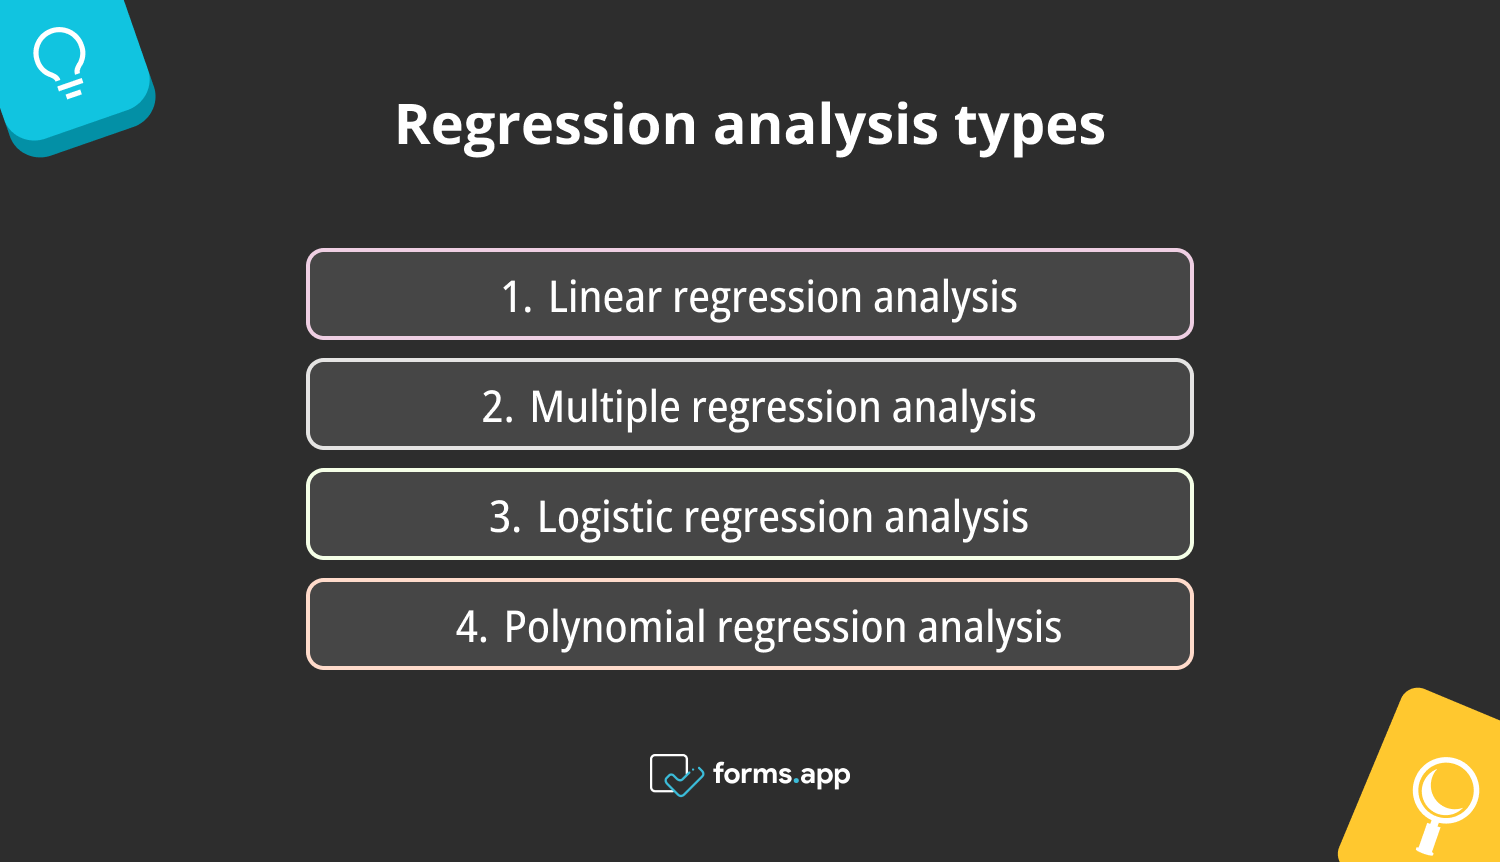
Types of regression analysis
1. Linear regression analysis
Simple linear regression is a statistical method used to model the relationship between a single independent(predictor) and a dependent variable. Here, a linear relationship is assumed. That is, if there is a change in the predictor variable, there is a proportional equivalent in the dependent variable. The purpose of this method is to make predictions about the dependent variable. It will also be used to prepare for more complex regression modeling.
Regression formula:
Y = a + bX + ϵ
Y – Dependent variable
X – Independent variable
a – Intercept
b – Slope
ϵ – Residual (error)
Example: You want to make a model to find the shop that suits your purpose and estimate shop prices. Let's say a specific shop price is a dependent variable. This is X dollars. Independent variable is building area. You analyze the relationship between two variables. With the line of best fit, you make shop prices visible and predictable in modeling.
2. Multiple regression analysis
Multiple regression analysis is performed by adding more than one variable to the simple linear regression model. The aim here is to find the coefficient of each value with a linear combination. It allows you to understand how simultaneous changes in different predictors affect the dependent variable.
Example: In this type of analysis, you add features to the shop you are looking for above. For example, it may have a cellar, a parking lot, an attic, etc. When architectural features are added, you observe whether the shop prices change.
3. Logistic regression analysis
This method is non-linear and is used to estimate the probability of events occurring with one or more variables. A logical binary variable is used here, i.e., yes/no, true/false. The probabilities are mapped to a function known as a sigmoid curve. That is, combinations are converted into probabilities between 0 and 1.
Example: You want to calculate the probabilities of whether your customers will choose your new product. First, you prepare a data set that includes your customers' demographics and attitudes toward the products you have previously released. With logistic modeling suitable for this data, you can learn the possible outcomes in binary form. You can also further analyze customer behavior with narrative analysis.
4. Polynomial regression analysis
This is a regression technique used to model variables in a nonlinear relationship. It provides a more flexible data analysis. Polynomial regression analysis is your reference source, especially when you make a poorly performing model and realize that it does not match the actual values. It allows you to predict the best-fit line by following the patterns of data points.
Example: You want to analyze whether a food product sells more depending on the seasons. You collect data on the food products you sell according to the months and seasons. However, it is obvious that there is no linear relationship, so you apply polynomial regression analysis. With the polynomial curve, you can predict seasonal fluctuations more precisely. Thus, the environment is prepared for the strategies of the new market.
Advantages of regression analysis
As mentioned, regression analysis measures the influence of independent variables on dependent variables. Businesses use this analysis to make business predictions on many different issues. In this way, you will have a more conscious and objective decision-making mechanism. Below are the main advantages to give you an idea:
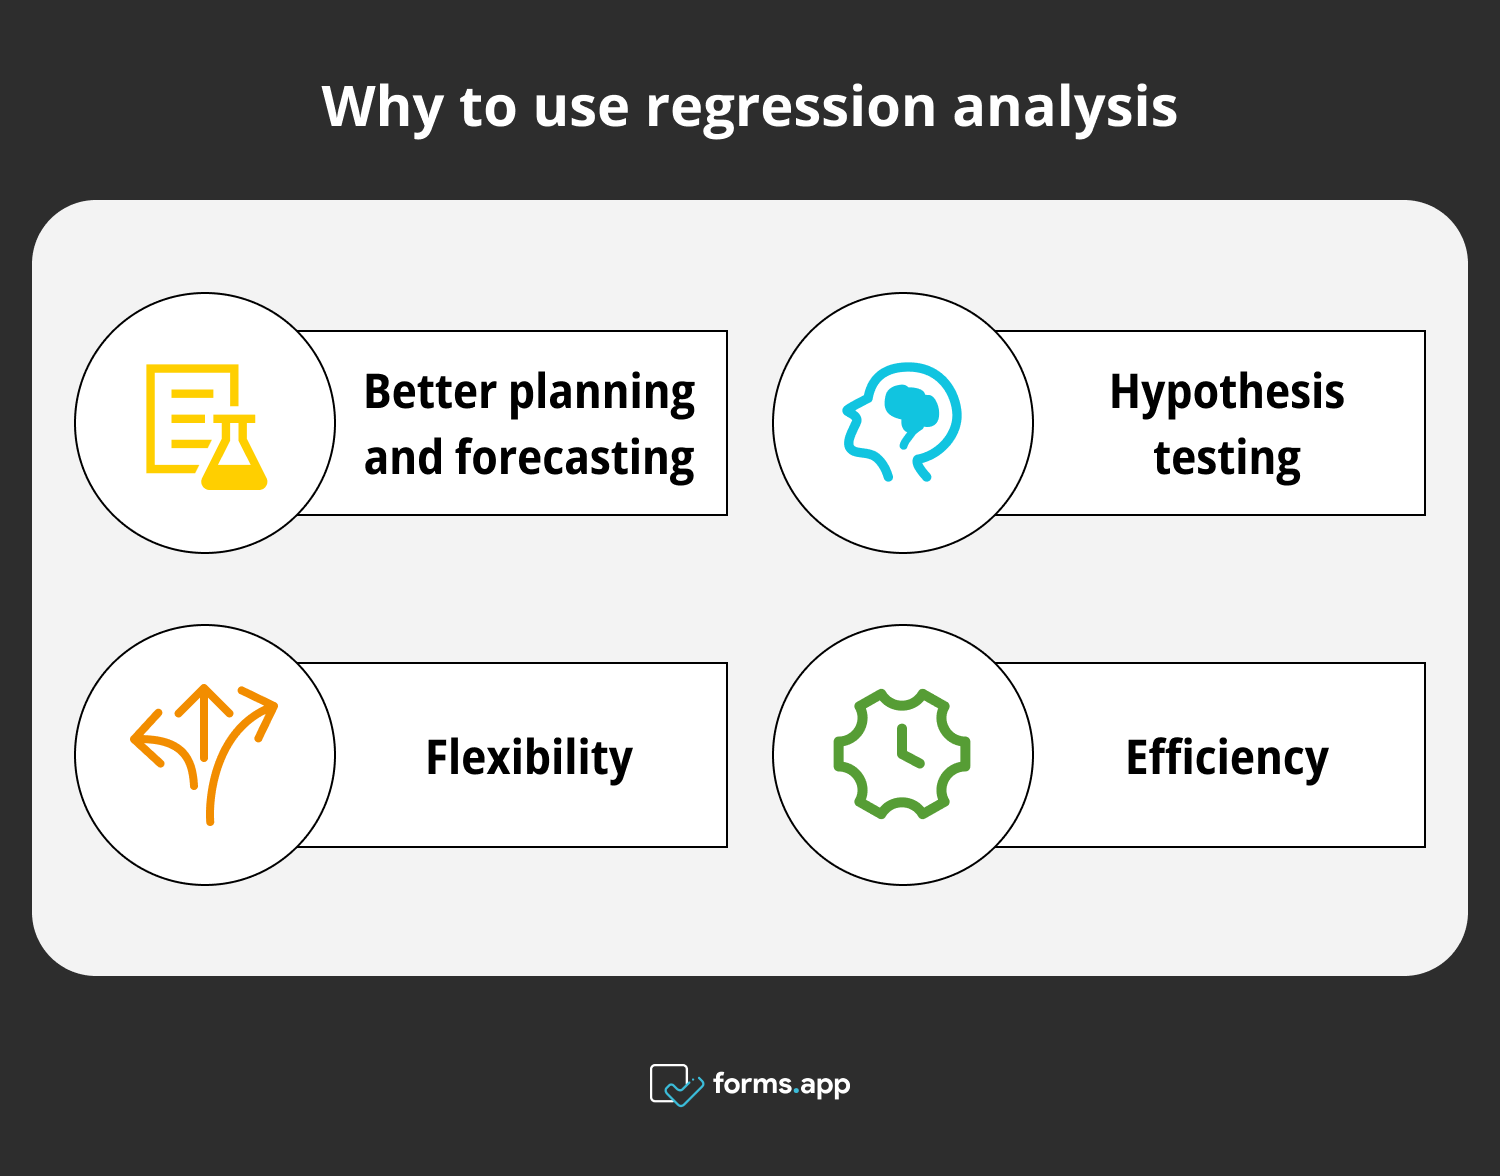
Pros of regression analysis
- Better planning and forecasting: Regression models can visually show you trends so you can have better data when planning.
- Hypothesis testing: As with every type of analysis, regression analysis can be used to evaluate a specific hypothesis.
- Flexibility: With linear and non-linear regression modeling, solutions to different data types and research questions are easier to find.
- Efficiency: It prepares your business for more practical solutions and effective methods.
Frequently asked questions about the regression analysis
Welcome to the FAQ on regression analysis! You can check here to get more information about this subject or to reinforce your knowledge.
Regression analysis tells you about the changes, relations, and order between variables. A dependent variable is taken as a basis here, and the analysis tries to make sense of the dependent variable and its connections with other independent variables.
The application area of regression analysis is wide and can adapt to many situations. Businesses use it, especially in market research, to understand customer attitudes and develop market strategies. Apart from that, companies use it to examine and calculate their financial situation, shares, inflation, or interest rates.
It is especially useful when trying to understand future trends and economic situations using historical data. Apart from these, it is also found in the operation phase, field studies, social studies, health, and sports sectors.
Naturally, you do it first when you want to analyze data and uncover patterns. You do it to predict any situation and uncover possibilities. You do it to evaluate a data model, test it, and learn its usefulness. Or you have a hypothesis, and you use regression analysis to test it.
Regression and correlation are two different statistical techniques. They both examine relationships between variables, but they differ from each other according to their purposes. The main difference between regression and correlation is that regression focuses on prediction and modeling.
It examines the action and reaction of an independent variable with one or more independent variables. On the other hand, in correlation, the linear relationship of variables with each other is examined. As a result, it enables summaries to be made more easily and understand cause-and-effect situations.
Conclusion
To sum up the subject, regression analysis is generally mentioned in this article for businesses. Although the intricacies and features of regression data analysis are not limited to this article, its main parts and statistical significance have been shown to you.
The parts mentioned here are the definition of regression analysis, regression and multiple regression analysis, other nonlinear types and examples, and, finally, its benefits. After reading this article and understanding the statistics world, predicting the future is one step closer to you in the real world.
forms.app, your free form builder
- Unlimited views
- Unlimited questions
- Unlimited notifications
