Decision trees: Definition, types, & examples
Do you know how companies manage to get so many variables into one decision? Or how they accurately identify fraudulent transactions? Decision trees are the answer to all this. Basically, decision trees break down decisions into more observable and manageable pieces, providing the framework for data analysis and insight into your decisions accordingly.
What is a decision tree?
A decision tree is a diagram used as a data analysis tool to enhance the decision-making process.
The reason for the tree structure analogy is that the nodes consist of roots, branches, and leaves, which represent the initial decision or problem, different opinions or tests, and final results and classifications, respectively.
Decision trees are powerful and simple tools that segment complex decisions into smaller, manageable parts. This allows easy visualization of the data analysis used to make accurate predictions, thereby allowing strategizing in many diversified fields accordingly.
When to use a decision tree
There is no specific time or situation for you to use a decision tree. It is a simple tool that can help you cope with most situations, even everyday problems. However, some situations under which the decision tree would be an appropriate inference procedure include:
⏰When explanations and interpretability of the results are of main concern
⏰When using it on the classification task (identifying spam emails and fraudulent transactions)
⏰When doing a regression analysis
⏰When preparing a predictive model
⏰When discovering non-linear relationships
⏰When turning insights into actions
Use cases of decision trees
Decision trees are versatile tools that can be used in various domains, such as healthcare, education, finance, marketing, and human resources. Here are two common use cases:
1. Churn prediction
Decision trees in the business world are used especially to offer subscription-based products or services. The churn event takes its place as the initial node; then, branches are created to list the factors that can cause churn.
In addition, statistical data such as customer satisfaction, the company's communication with customers, the user purchase rate, and the number of regular and abandoned customers are placed in the appropriate branches of your tree. When the decision tree is complete, churn patterns will emerge. Then, suggestions are made for measures to prevent churn.
2. Medical diagnosis
In the health field, diagnosing patients simply by using a decision tree is possible. You place the patient's height, weight, age, history, symptoms, test results, etc., into branches to do this. Then, you make predictions by creating probability branches. Finally, you compare the probabilities, determine your final decision, and diagnose the patient.
How to create a decision tree (step-by-step)
Creating a decision tree is a fairly simple process. You can either use technology programs or simply draw with a pen on paper. If we assume that you have a specific research purpose or problem and that your data has already been collected, you can create a decision tree in three steps.
1. Drawing the initial node: First, select the most important attribute affecting your decision, which will be your root node. Start creating branches based on the root node attribute and divide the data you have prepared before. Continue by labeling the branches as you create them.
2. Expanding nodes: Create branches that include different decisions by considering the next steps of the branches you have labeled. These branches represent probabilities and definitive results. You should draw two of them in different ways so that it will be easier to interpret later.
3. Reaching final nodes: Continue doing step two until you don’t need to add new branches. Then, each of these branches will end with a result node. This is necessary to facilitate comparison between result nodes and to perform the evaluation.
Examples of the decision tree
Here are two sample cases to give you an idea of how to create nodes in a typical decision tree. Although the examples here are in the field of market research, you can think of them as a decision tree template and adapt them to your own field of work.
Example #1
A game company aims to release a new type of game to the market. However, they want to find the target audience of the game by placing the data they collect into nodes in a decision tree to reach a final decision.
Root node: Age
Branch 1: Under 18s
Internal node: Gaming Platform Preference
Branch a: PC
Leaf node: Interest in sandbox games
Branch b: Mobile
Leaf node: Interest in casual games
Branch 2: Age 18-30
Internal node: Gaming experience history
Branch a: Role-play games
Leaf node: Interest in online role-play games
Branch b: Strategy games
Leaf node: Low interest in general
Example #2
A clothing company wants to learn about its customers' purchasing habits to provide them with better service.
Root node: Shopping Frequency
Branch 1: Frequent buyers
Internal node: Types of products purchased
Branch a: T-shirts
Leaf node: Increased rates, especially in summer
Branch b: Jeans
Leaf node: Increased rates, especially in autumn
Branch 2: Rare buyers
Internal node: Types of products purchased
Branch a: Bags
Leaf node: Increased rates, especially in spring
Branch b: Coats
Leaf node: Increased rates, especially in winter
Pros & cons of using the decision tree
Decision trees have advantages and disadvantages, as is the case with any analytical tool. Knowing what these are aids in deciding when and how to effectively implement a decision tree in various scenarios.
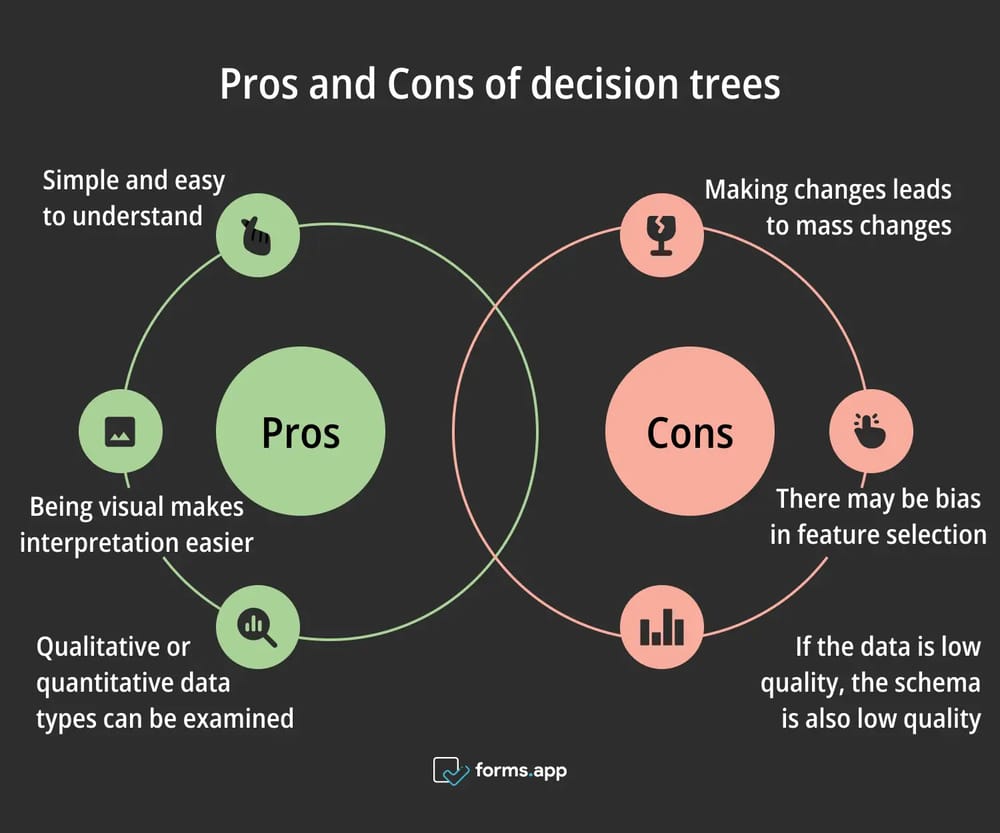
Advantages and disadvantages of using decision trees
➕Simple and easy to understand: Decision trees require no expertise, so they are easy to use when making a decision.
➕Being visual makes interpretation easier: It facilitates comprehension thanks to its visuality when sharing information with others.
➕Qualitative or quantitative data types can be examined: Examining two different types of data provides a more comprehensive analysis opportunity.
➖Making changes leads to mass changes: It is sensitive to data variations; be careful when making significant changes.
➖There may be bias in feature selection: Certain branches and features may become particularly prominent, inadvertently shaping decision-making.
➖If the data is low quality, the schema is also low quality: If your data collection step is incomplete or incorrect, you will not get an efficient result.
Frequently asked questions about the decision trees
You can take a look at the FAQ below to read answers to questions directly related to decision trees.
A decision tree is a tree-like structure used as a diagram. There are primarily several types of decision trees, distinguished by their purpose and the nature of the decision-making process. These include classification trees and regression trees. Classification trees are used when the outcome variable is categorical. It classifies data into distinct groups, such as determining whether a transaction is legitimate or fraudulent.
On the other hand, regression trees are employed when the outcome variable is continuous. It aids in the prediction of numerical values. This is particularly useful for forecasting, such as predicting sales revenue based on various input factors. Both types of decision trees offer a clear and structured method for analyzing data. They can be used to make informed decision-making.
A decision tree can be a tool a company uses to decide whether launching a new product or service is a good idea. In such an example, the root node is the first decision or question made. "Are we going to launch the product or service?" The internal nodes are the factors surrounding this decision or problem. In particular, factors such as market research, product/service production and supply costs, and customer satisfaction are listed.
These internal nodes can also branch out and show different results. There may be branches like "Production costs are low" or "Customer satisfaction is high." Finally, the final decisions are found in the leaf nodes. With decisions such as "cancel the product," "launch the product immediately," or "launch the product with a delay," the tree reveals the entire decision structure, allowing you to evaluate all the factors easily.
A decision tree consists of three main branches: the root node, the internal nodes, and the leaf nodes.
- The tree's root node comes to symbolize the initial decision and represents the entire data set.
- Then, there are internal nodes, also called decision nodes, which stand for different decisions or tests of attributes, and it leads to further branching.
- Lastly, there are the leaf nodes, also called terminal nodes, representing the final result or prediction.
In this regard, each branch of the decision tree aids in making decisions in an organized and systematic manner by breaking down complex decisions into more straightforward and manageable components.
Key points to take away
All in all, decision trees offer a simple visual method in the decision-making process. They can be utilized in more complex data analysis techniques to enhance stability. They are capable of representing qualitative and quantitative data so that they can be used in many different disciplines.
Although it has some disadvantages, such as instability, it is a tool that will always continue to be used with its simplicity and usability. This article explains decision tree examples with solutions so that you can now be informed and take action. It is your turn now.
Contributors
forms.app, your free form builder
- Unlimited views
- Unlimited questions
- Unlimited notifications