If you are running a business, you should value customer expectations. You exist because of the product or service you sell them. So, the customer’s preference and the experiences of the customer’s journey are really important. If you want to get better at your work, you better listen to them.
Customer satisfaction survey statistics are an excellent option for that. If you want to improve your customer satisfaction rates but do not know where to start, business customer satisfaction statistics is a good place because they will guide you well. If you want to learn 50+ customer satisfaction statistics for 2023 and more, start reading now!
Why do you need to keep an eye on customer satisfaction statistics?
Customer satisfaction surveys may seem complicated at first glance. However, when you see its advantages, they will change your mind immediately. So, the survey done before makes up the customer satisfaction statistics. Statistics can give you excellent insights, including these:
- Increase brand loyalty
- Customer-centric decisions
- Improve the rate of sales
- Understand your customers
- Plan the future better
- Lose less time and money
For these reasons, you should definitely check statistics before taking action. At this point, it would be better not to underestimate the power of customer satisfaction statistics. We all need them because they help us to make more informed and sophisticated decisions.
50+ Great statistics about customer satisfaction in 2023
The importance of customer satisfaction statistics is undeniable, as we have discussed so far. Each customer feedback carries huge importance for the business, and this feedback turns into solutions for customer support. If you want to learn lessons from both positive and negative experiences, you need to consider these 50+ great statistics about customer satisfaction:
General statistics about customer satisfaction
If you know how to use customer data, you can create excellent solutions for both your customers and your company. As long as you know how to read them, customer satisfaction statistics can give you excellent tips. Have a look at these general statistics about customer satisfaction:
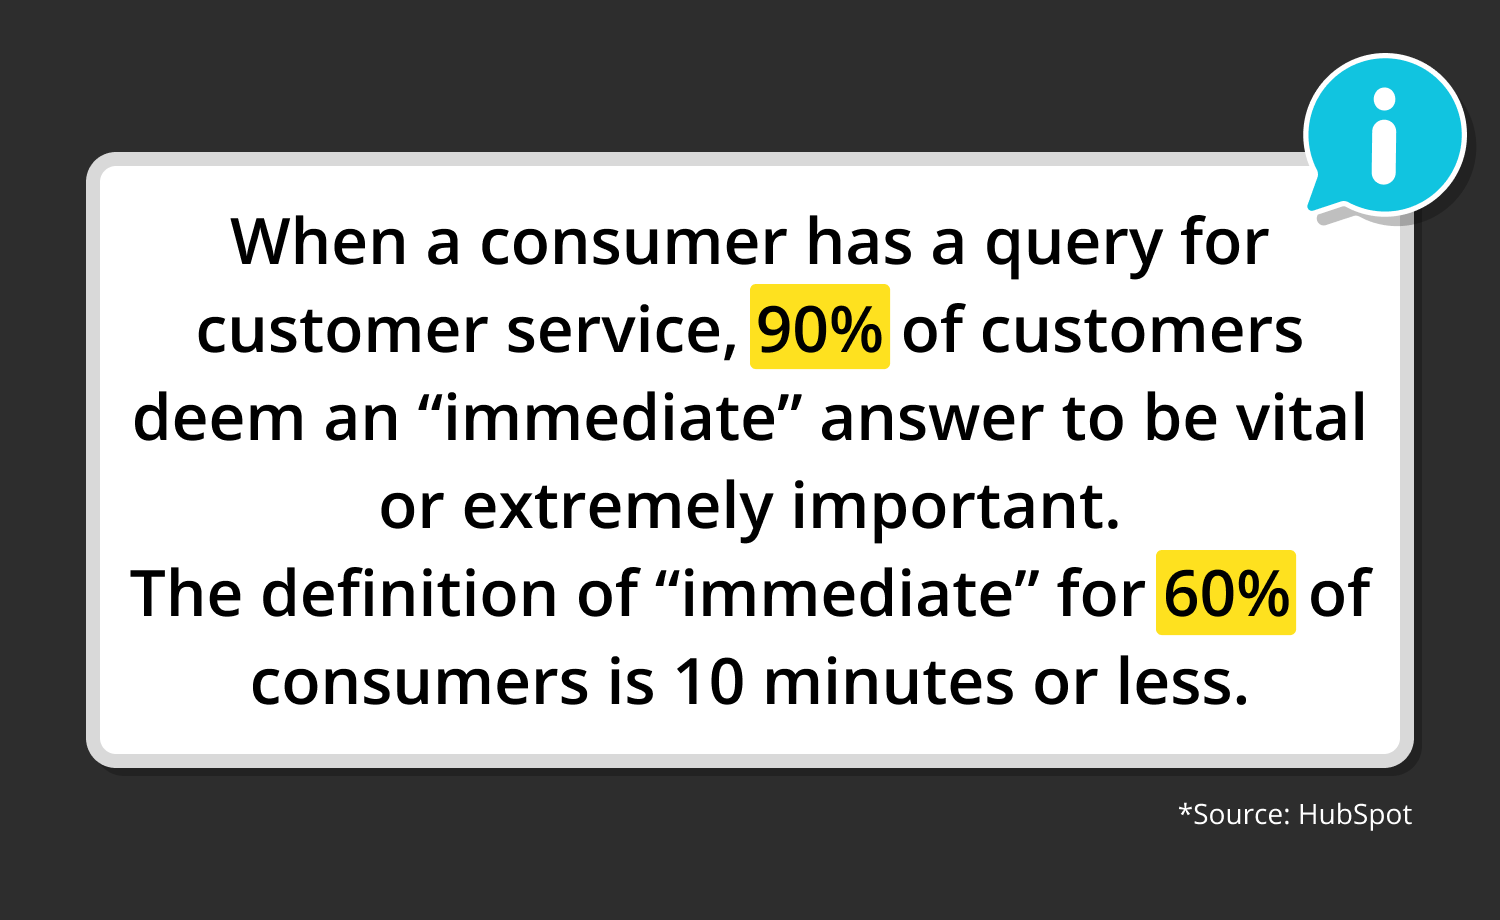
1. When a consumer has a query for customer service, 90% of customers deem an “immediate” answer to be vital or extremely important. The definition of “immediate” for 60% of consumers is 10 minutes or less. (Hubspot)
2. Nearly 90% of customers have faith in a business to meet their demands if they have given it a “very good” rating for a service. (Qualtrics XM Institute)
3. How the client behaves they are being responded to determines 70% of the purchase experiences. (McKinsey & Company)
4. When clients are unhappy with service, they transfer brands 34% of the time. (Verint)
5. Businesses that prioritize customer satisfaction get 4-8% better revenue growth than the rest of their success. (Bain &Company)
6. A %10 cost reduction results in the same rise in earnings as a 2% increase in client retention (SuperOffice)
7. After receiving good customer service, 89% of consumers are more inclined to make another purchase. (SalesForce)
8. It takes 12 great interactions to make up for a bad transaction for every bad customer experience(Experience CRM)
9. In 12 months, 47% of the respondents said they decided to quit doing business with a brand due to poor customer service. (Microsoft)
10. When customers have a bad experience, they usually tell 16 people about it. (Monitor Deloitte)
11. Customers are more likely to remain loyal to companies that address their issues, according to 83% of consumers. (Khoros)
12. Nearly 97% of customers will recommend businesses that provide very good customer service. (Ameritas)
Source: Hubspot
Customer satisfaction statistics about websites
Today, the place of the website for a company or business is undeniably important. With the help of a good website, you can easily grow your business. Also, you can improve customer satisfaction in eCommerce as long as you value their top priority or purchase decisions. So, you need to consider these customer satisfaction statistics for websites:
13. The design of a website was cited by 48% of respondents as the most important aspect in determining a business’s credibility. (Virtual Window)
14. For an average website, 47% of users anticipate a loading time of no more than two seconds. (Sweor)
15. If a website takes longer than three seconds to load, 40% of visitors will leave. (Neil Patel)
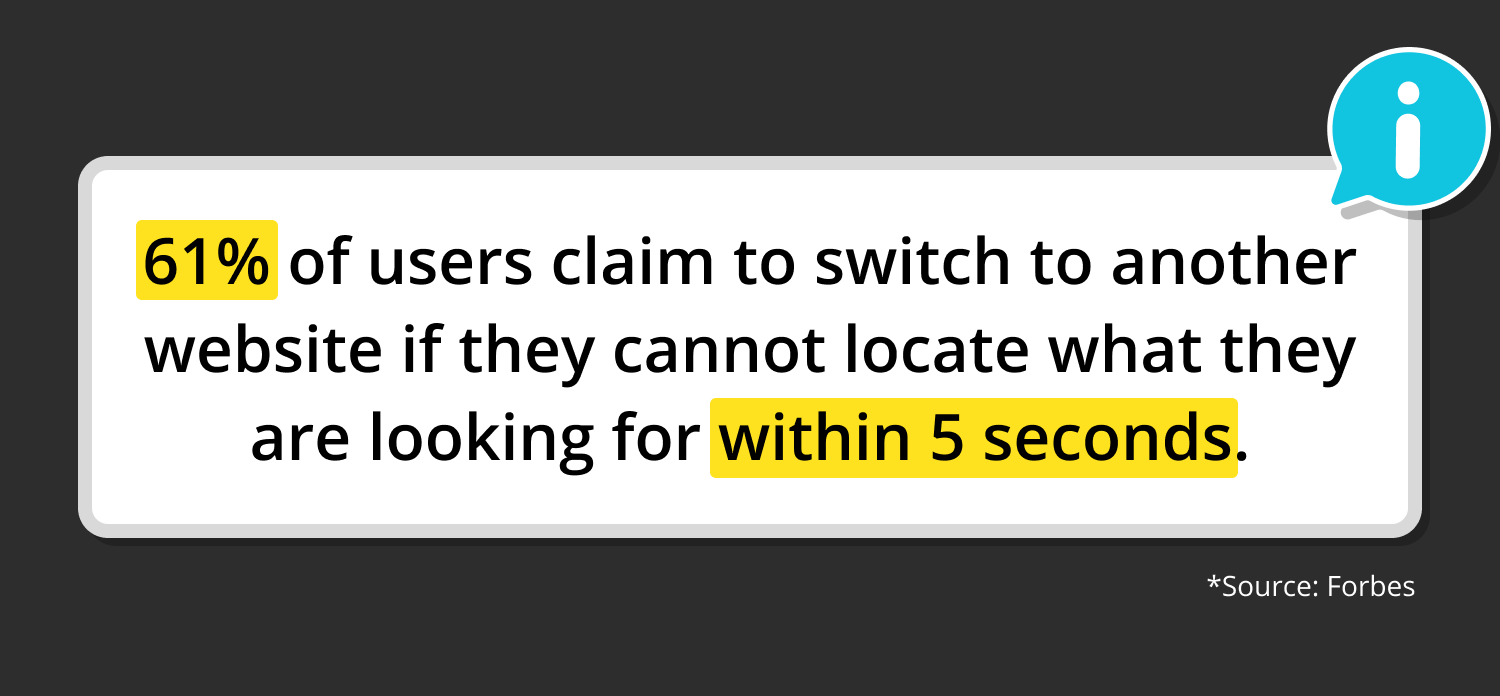
16. 61% of users claim to switch to another website if they cannot locate what they are looking for within 5 seconds. (Forbes)
17. If a website is mobile-friendly, users are 67% more likely to make a purchase there. (Launch North)
18. 57% of internet users said they will not recommend a company if their mobile website is badly developed. (Sweor)
19. If a website’s design is ugly, 38% of visitors will not interact with it. (Sales Lion)
Source: Forbes
Customer satisfaction statistics for restaurants
It is important to make your customers happy if you own a restaurant. Good customer experience always gains you more people and money. Especially in the food sector, consumers expect you to answer their requests. If you want to be more informed about the topic, here are your customer satisfaction statistics for restaurants:
20. A one-star improvement on Yelp in a 5-9% revenue gain. (Harvard Business School)
21. Restroutans are one the most important industries where cleanliness has a significant influence (75%) on customer satisfaction. (BusinessWire)
22. Consumers claim that 68% of them are prepared to pay more for goods and services from companies with a reputation for providing excellent customer service. (Hubspot)
23. 78% of customers will return to a firm after an error if the customer service is top-notch. (SalesForce)
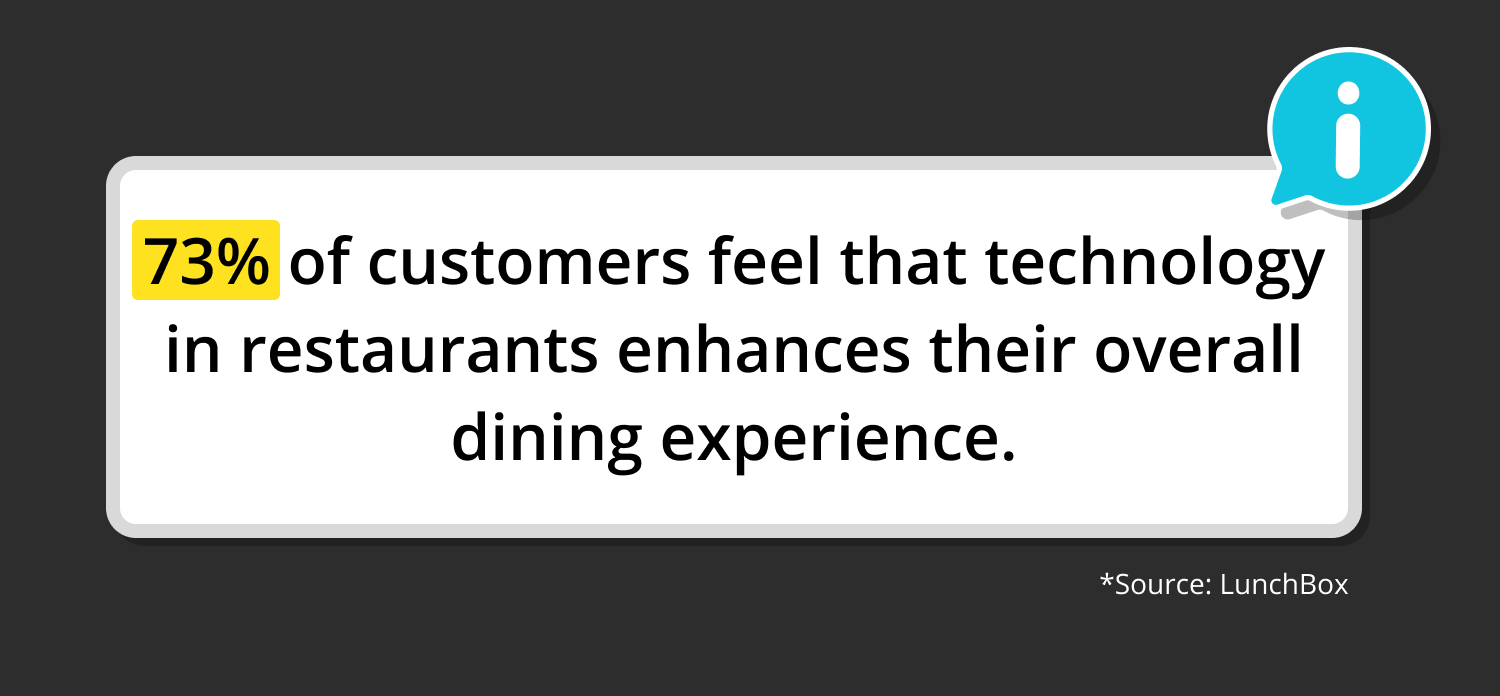
24. 73% of customers feel that technology in restaurants enhances their overall dining experience. (LunchBox)
25. Customers do not trust businesses or restaurant owners with ratings of less than four stars on review websites, with the most popular filter being applied to just businesses with ratings of four stars and higher. (LunchBox)
Source: LunchBox
Customer satisfaction statistics for mobile apps
The mobile apps make all the customers’ jobs much easier. They not only connect the brands with customers better but also provide them with a better service. Thanks to them, more people have access to the brands. However, it does not mean that mobile apps make everything flawless. Look at the customer satisfaction statistics related to mobile apps and realize their importance:
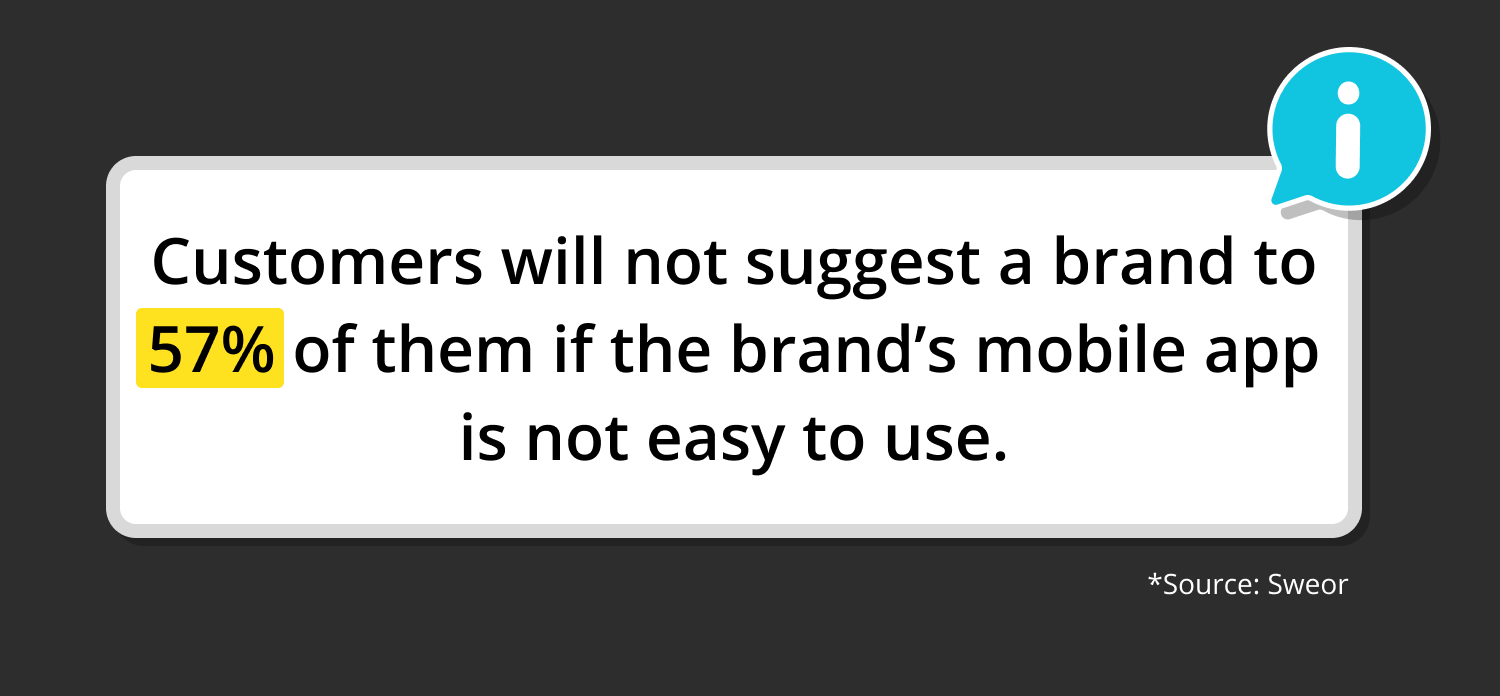
26. Customers will not suggest a brand to 57% of them if the brand’s mobile app is not easy to use. (Sweor)
27. 50% of customers will stop the app if it is not mobile-friendly. (SuperOffice)
28. 52% of customers feel disappointed because of the mobile app experience, even though they like the company. (SuperOffice)
29. 84% of brands who identify themselves as customer-centric are concentrating on mobile customer service experience. (SuperOffice)
30. 90% of consumers say they had a bad experience while contacting customer support via mobile devices. (Software Advice)
31. 51% of smartphone users are more inclined to utilize a brand’s app while buying on a mobile phone. (Google)
32. 58% of smartphone users have a higher positive impression of brands whose mobile apps keep track of their identity or previous activity. (Google)
33. According to 85% of adults, a company’s mobile app should be just as good as its desktop form. (Inside Design)
34. Because of its simpler purchasing process, 39% of mobile phone users are more willing to shop on a brand’s mobile app. (Google)
35. 76% of customers say they prefer buying via the brand’s mobile app instead of visiting the website. (Cordial)
Source: Sweor
Customer satisfaction statistics for banking
When it comes to banking, trust is mutual. When you make your bank customers happy, you can improve the customer retention rate more easily. So, at the end of the day, the bottom line should be making your customers satisfied. If you want to be convinced more, here are the customer satisfaction statistics for banking:
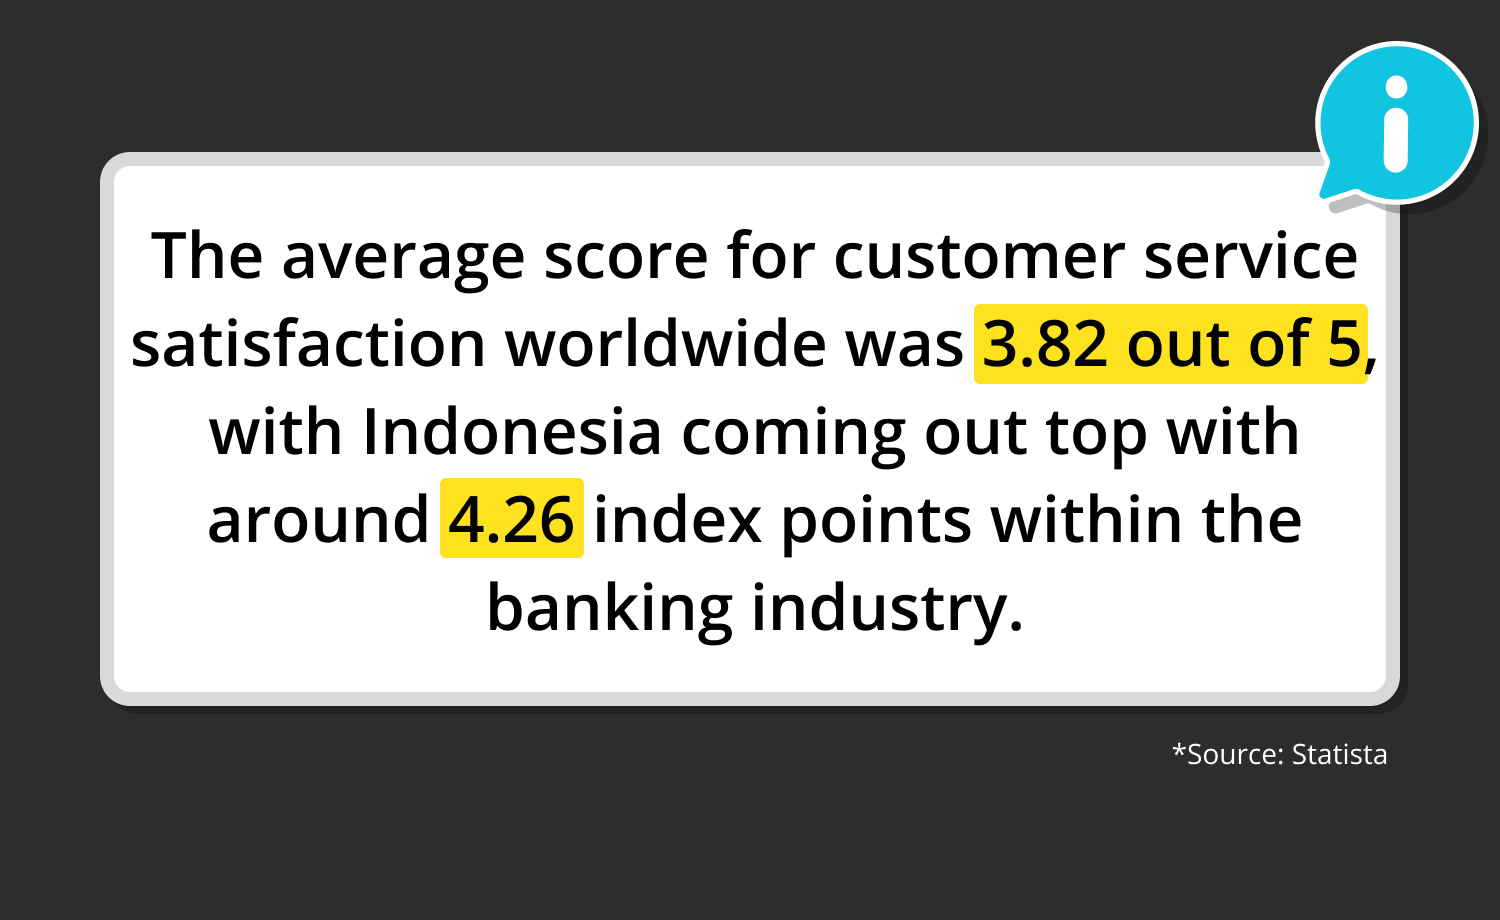
36. The average score for customer service satisfaction worldwide was 3.82 out of 5, with Indonesia coming out top with around 4.26 index points within the banking industry. (Statista)
37. More than 75 thousand consumers from 28 different countries were surveyed, and the majority of them said they were satisfied with their banks. (Statista)
38. Customer experience is the primary factor influencing customer loyalty in banking. (Lightico)
39. The research found that 84% of respondents would transfer banks if the new bank offered better customer service and reduced costs. (Lightico)
40. Since 2012, customer satisfaction rates have decreased by more than 30%. (Lightico)
41. Capital One has the highest level of customer satisfaction with retail banking. (J.D Power)
Source: Statista
Customer satisfaction statistics for social media
Today, it is impossible to have any idea about social media. Social media helps marketing via digital channels. While using social media for marketing, it is essential to pay attention to the customer satisfaction level because they reflect honest reactions. If you need social media statistics related to customer satisfaction, here are them:
42. Statistics prove that 67% of customers look for solutions to their problems on social media. (SocialMediaToday)
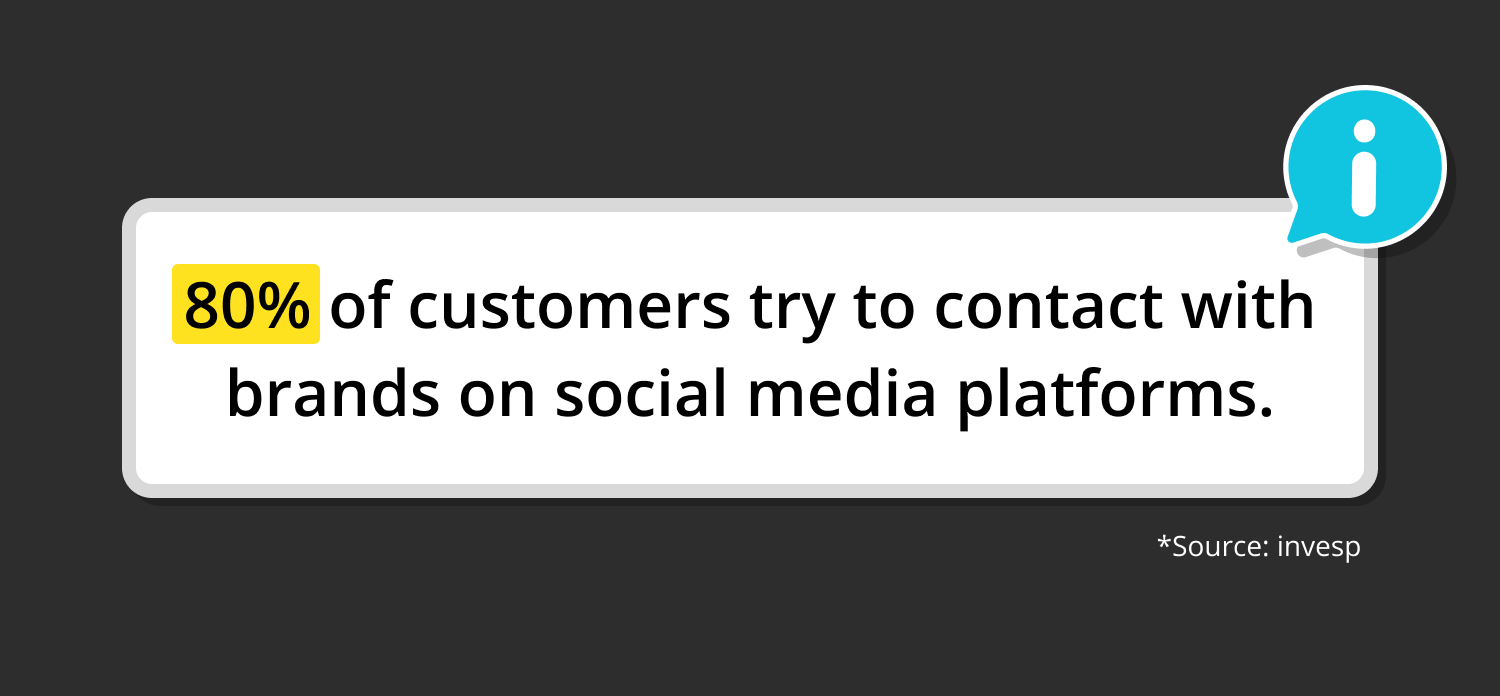
43. 80% of customers try to contact with brands on social media platforms. (invesp)
44. Responding to a customer complaint on social media platforms can increase customer satisfaction by up to 25%.
45. The amount of money spent on the brand increases 20-40% more when brands reply to their customers. (SocialMediaToday)
46. 23% of the customers believe that it is an excellent opportunity to have 24/7 service. (Smart Insights)
47. One in three customers of social media prefer customer support over phone or email. (SocialMediaToday)
48. 77% of X users claim that they feel more positive about the brand when they are replied to. (Brandwatch)
49. 53% of X users wait for a response from the brand within an hour. (HubSpot)
50. According to the statistics, the level of customer satisfaction increased by 19%. (Brandwatch)
Source: invesp
Şeyma is a content writer at forms.app. She loves art and traveling. She is passionate about reading and writing. Şeyma has expertise in surveys, survey questions, giveaways, statistics, and online forms.
