Do you want to create visually appealing tables in Google Sheets? Then, you’re at the right place to learn. Effective table design can turn complex information into easy-to-understand visuals, aiding in quicker analysis and decision-making. Utilizing Google Sheets' table formatting options allows for a structured and organized display of information.
In our guide, you'll discover how to make a table in Google Sheets that not only organizes data efficiently but also catches the eye. We'll cover the steps to build tables and the techniques to enhance their functionality and aesthetic. Let’s begin with the importance of the tables in Google Sheets!
Importance of tables in Google Sheets
Tables in Google Sheets are very important for organizing and understanding data well. They help keep data tidy and clear, which reduces mistakes. They also make analyzing and comparing data easier. Also, they work well with formulas and functions to automatically calculate and update data, saving time and increasing efficiency:
- Organizes data well, making it clear and structured
- Highlights the key details so it's easy to see what's important
- Simplifies analyzing data, helping you spot trends and patterns
- Improves decision-making by presenting data neatly
Table formatting
Arranging tables well makes data clearer and easier to read. We'll show how to organize rows and columns, making your Google Sheets straightforward. This method ensures that navigating through your data is a breeze, laying a good foundation for further table formatting skillsUsing Google Sheets' create table feature helps you quickly set up structured and accessible data tables, enhancing the organization and analysis of your information.
Number formatting
It shapes how numbers appear. Choose currency, percentages, or dates to suit your data. This formatting clarifies the type of information you're working with and ensures consistency. To access this feature in Google Sheets, select the cells you want to format, click on the "Format" menu, and then choose "Number" to select the specific format you need.
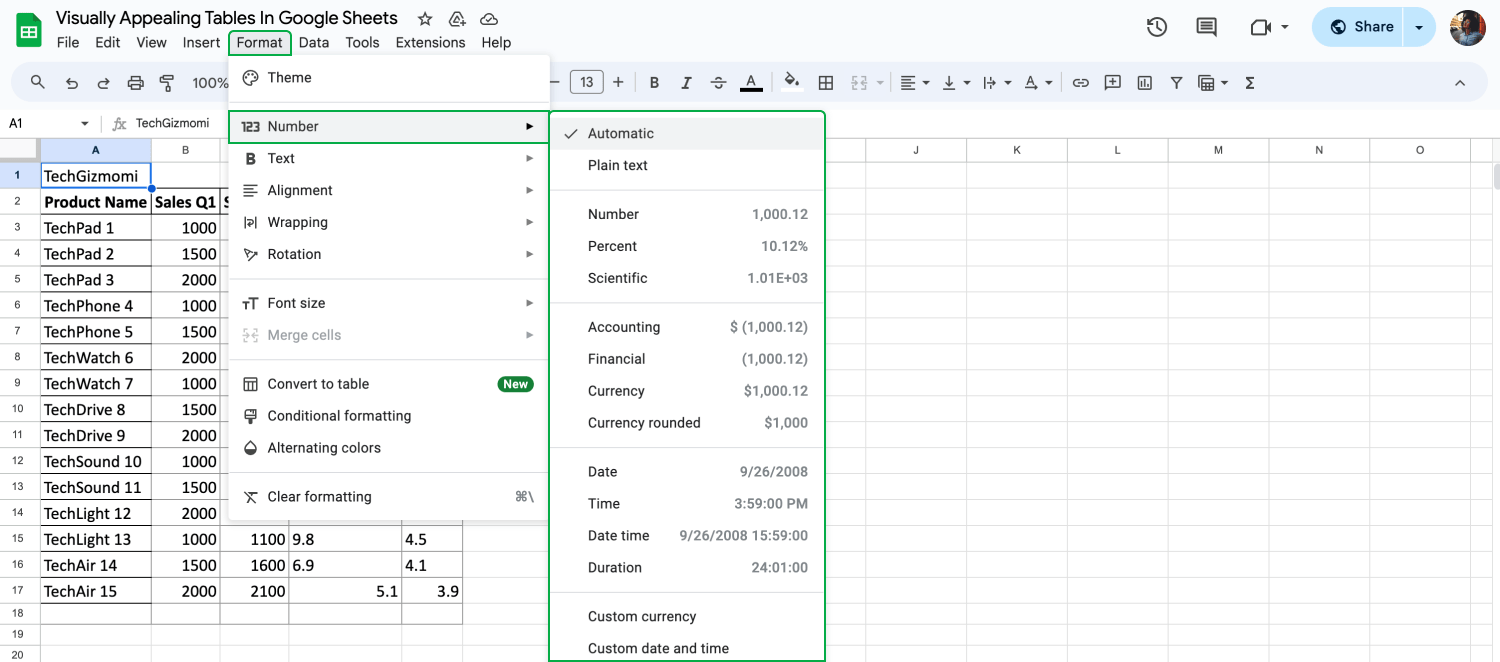
Format the numbers
Alignment for clarity
Proper alignment of text and numbers could aid in quicker comprehension, making the data easier to follow. In Google Sheets, you can align content by selecting the cells, then clicking on the "Format" menu, and choosing "Alignment" to adjust the text and numbers as you wish.
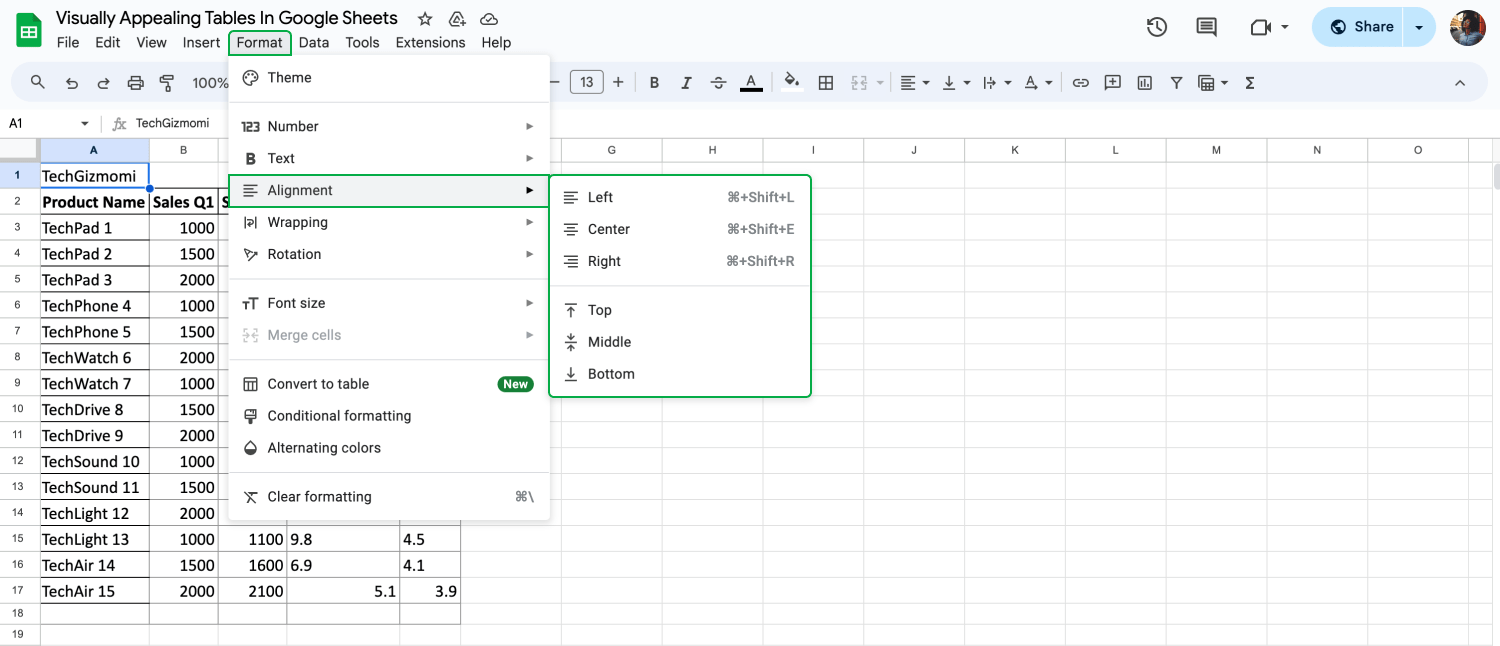
Align the text
Wrapping text
Wrapping text within cells might prevent overflow, ensuring all information is visible and the table remains orderly. To wrap text in Google Sheets, select the cells you want to modify, go to the "Format" menu, and click on "Text wrapping" to choose the wrapping option that best fits your data.
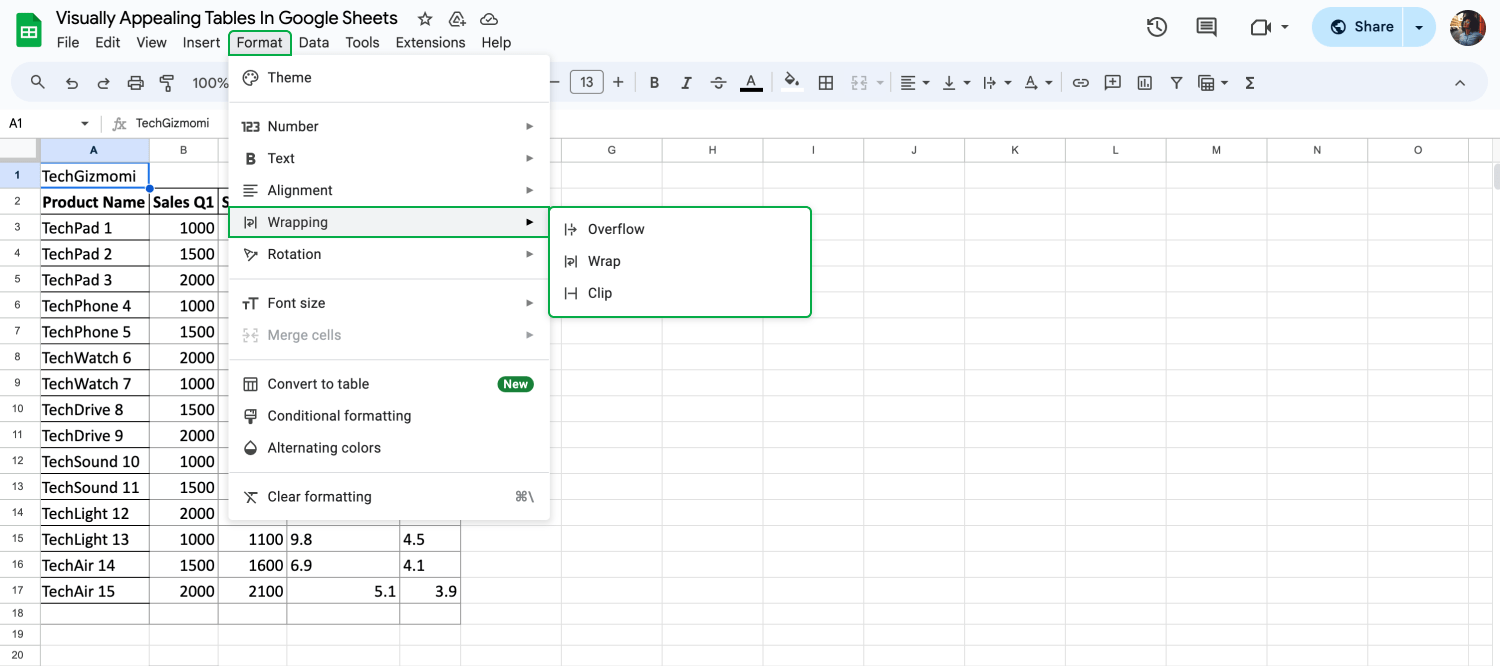
Wrap the text
Text rotation
Rotating text in headers might save space and add style. It can make the table look organized and distinct, catching the viewer's eye. To rotate text in Google Sheets, select the header cells, click on the "Format" menu, go to "Text rotation," and then select the rotation style you prefer.
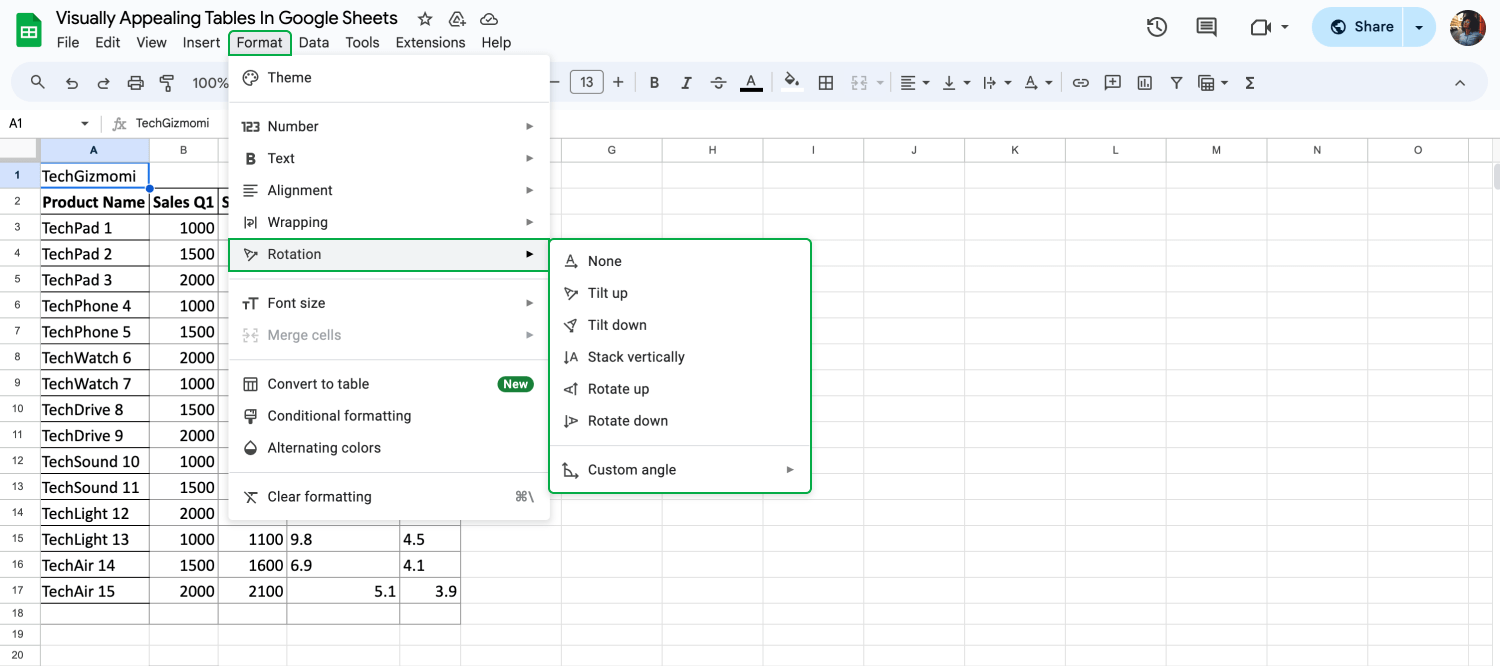
Change the text rotation
Style your table
Various options are available to enhance your tables in Google Sheets. Using the right colors, fonts, and cell merging techniques can make your tables more organized and eye-catching. Text styles
You can try to pick clear fonts. Bold highlights key info, italics for extra details. This makes the important stuff stand out more. In Google Sheets, access this by selecting the cells, then clicking on the toolbar's "Font style" for options like bold or italics, or choose "Font" to change the typeface.
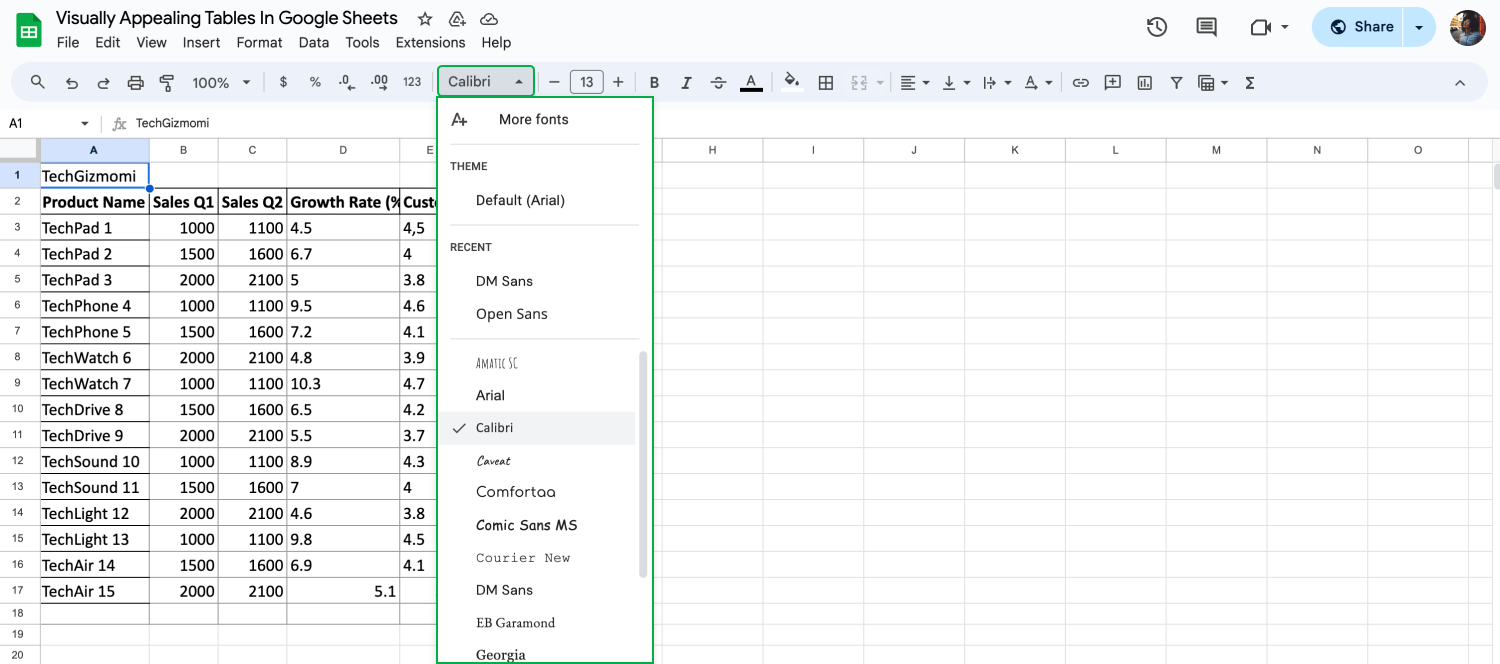
Change the font
Font sizing
Changing font size can highlight key info. Bigger fonts draw attention to important data, making it stand out. Smaller fonts keep less crucial info subtle, helping focus on what matters. Adjust font size in Google Sheets by selecting the cells, then clicking on the "Font size" dropdown in the toolbar to choose the size you want.
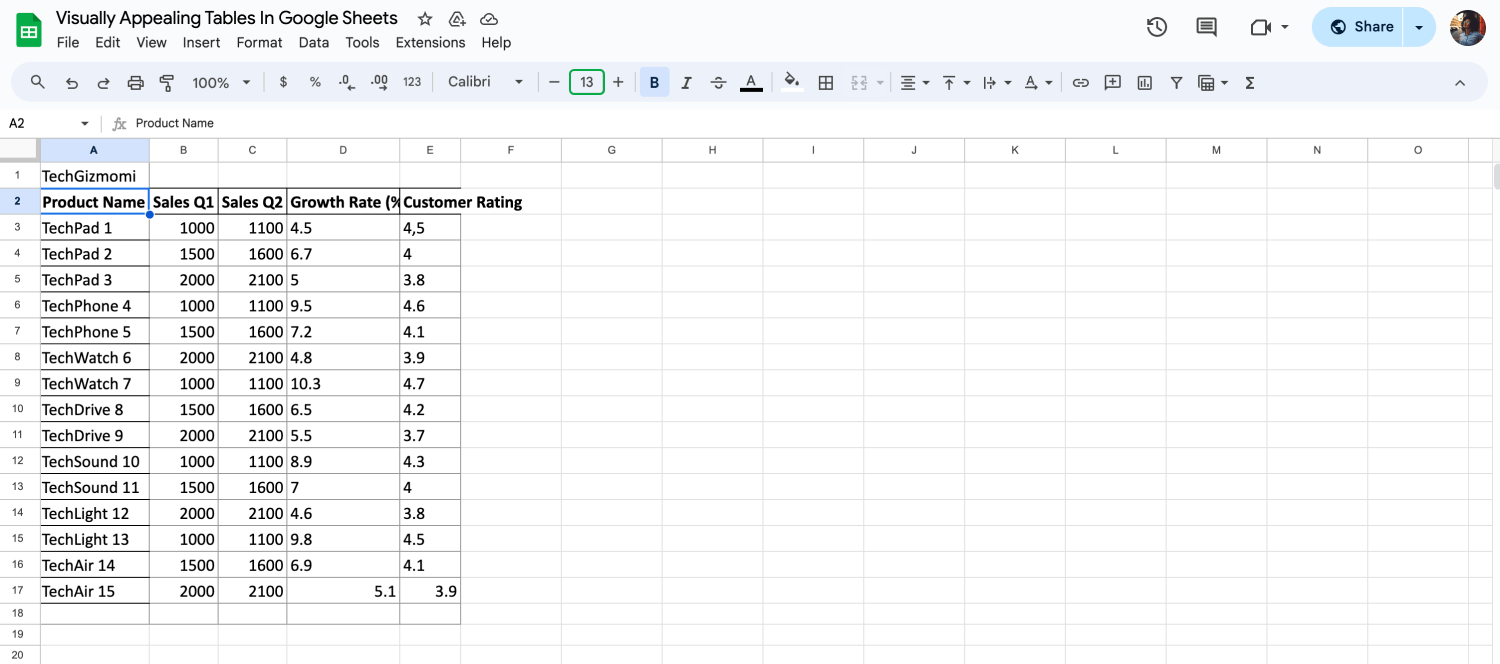
Change the font size
Merging cells
Merging cells combine them into one big cell. It's good for making titles or showing grouped data. It makes the table look cleaner and more organized. To merge cells in Google Sheets, select the cells to merge, right-click and choose "Merge cells" or use the "Format" menu and select "Merge cells."
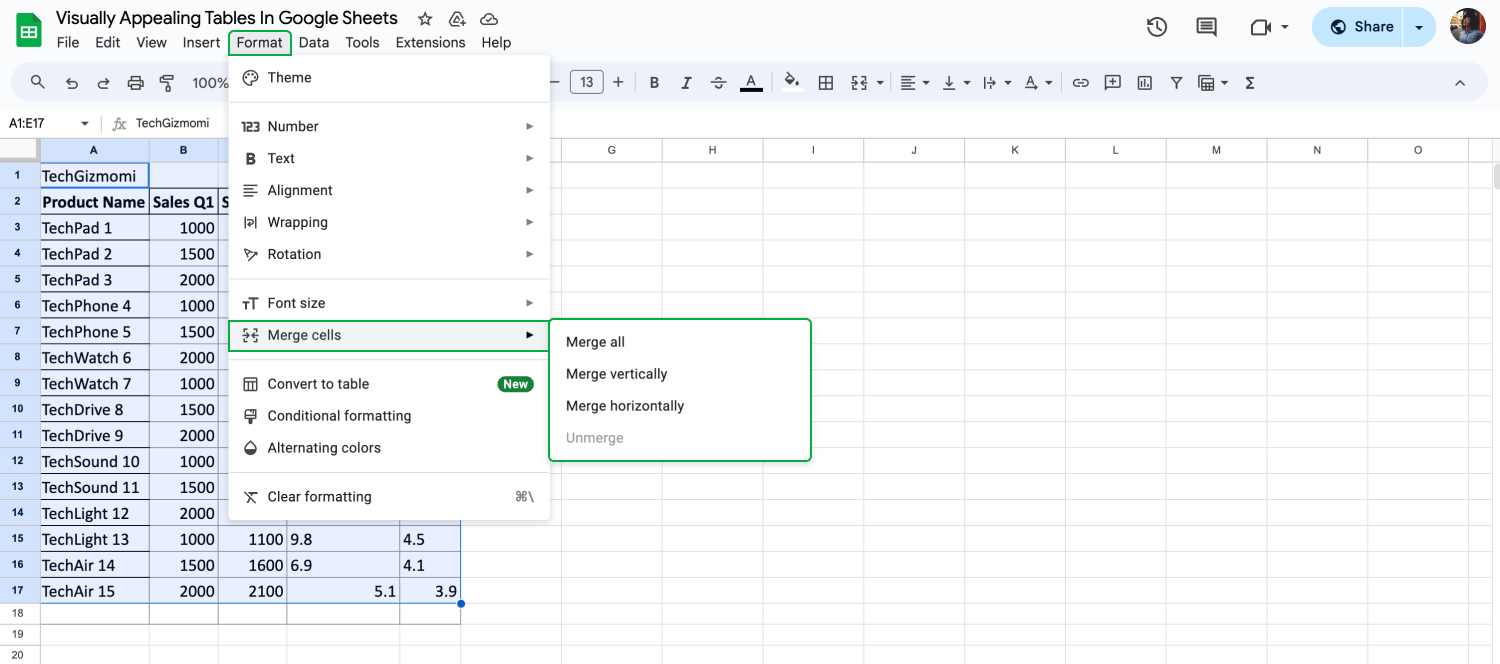
Merge cells
Conditional formatting
You can set up conditional formatting to change colors in cells depending on the data. This way, you quickly see key figures or trends. It turns tables into dynamic tools for easier data analysis. In Google Sheets, select the cells, then go to "Format" and choose "Conditional formatting" to set up rules that change the cell appearance based on their values.
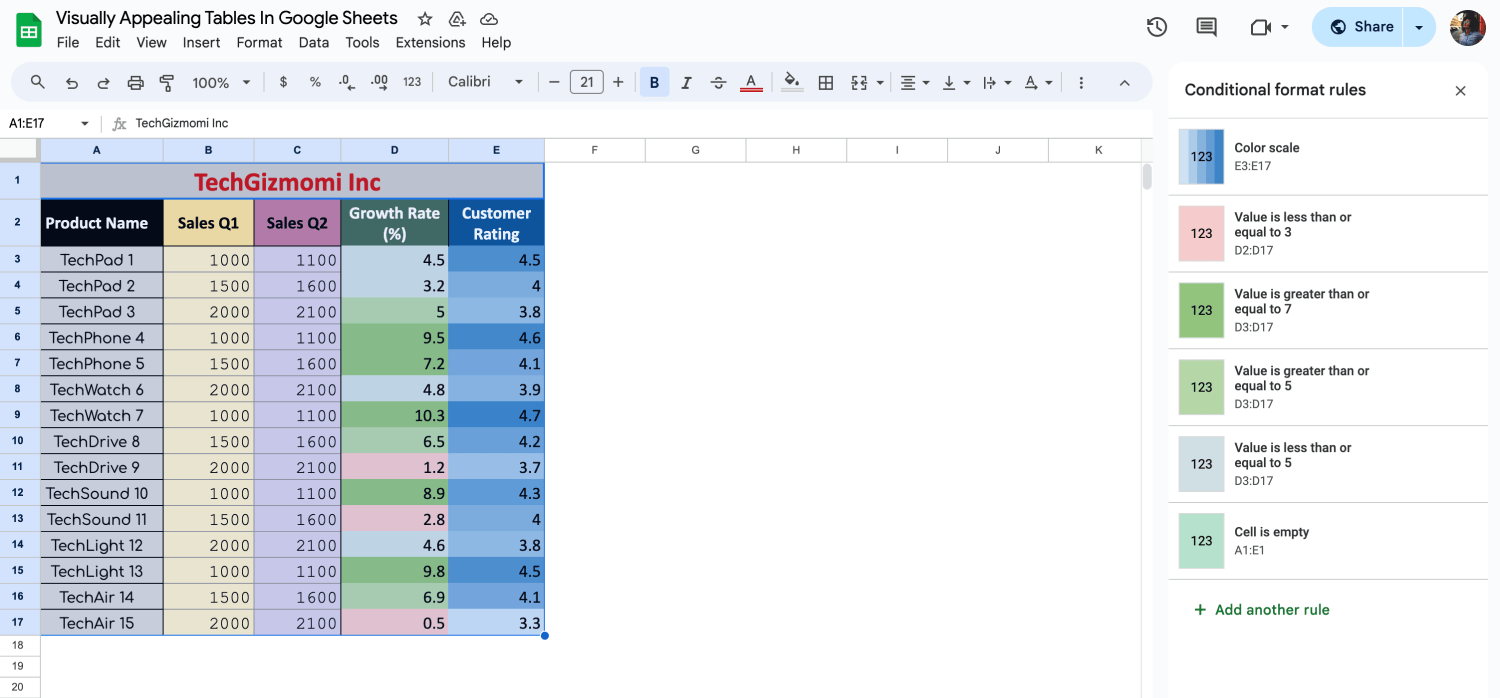
Use the conditional formatting
Bonus tips for Google Sheets tables
The tables feature in Google Sheets helps manage large amounts of data. It enables you to create a large table that is both functional and informative. By effectively using this feature, you can organize data to enhance clarity and improve analysis.
💡Adding a drop-down menu to your table can make data handling more efficient. It simplifies choosing options and keeps entries consistent across your sheet.
- Try using alternating colors to separate rows for better readability in large tables.
- Sorting and filtering features can help efficiently organize and access large data sets.
- Creating a filter can assist in focusing on specific data points in big tables.
- Defining a range of cells can streamline targeted analysis and operations.
- Consider using data validation to maintain accuracy and consistency in data entry.
- Utilize freeze panes to keep table headers rows visible while scrolling through extensive data.
Frequently asked questions about Google Sheets tables
In our FAQs section about Google Sheets tables, we cover common questions, including how to create a table in Google Sheets. This part aims to clear up any confusion and provide straightforward answers to enhance your table management skills in Google Sheets.
💡You can add a date picker to your Google Sheets table to simplify date entry. This feature lets users pick dates from a calendar, reducing errors and speeding up data entry.
Yes, you can create tables in Google Sheets by entering data into rows and columns and then using the toolbar to add borders and shading, creating a distinct table appearance.
To display data tables in Google Sheets, arrange your data in a grid, then apply formatting options like borders, colors, and text styles to define and highlight the table area.
To style a table in Google Sheets, select your data and use the formatting options for borders, cell colors, and text styles to create a cohesive and visually appealing design.
To enhance the appearance of your Google Sheet, experiment with different formatting styles such as cell color fills, font choices, and alignment options to make the information clear and engaging.
Final words
To wrap it all up, making tables in Google Sheets helps us see and understand data better. It’s crucial for presenting information clearly, aiding in sound decision-making. Effective tables allow us to easily spot trends and gain insights, making data analysis more meaningful and impactful. That’s why it is important to customize and edit your tables using the techniques in this article.Google Sheets formulas are great for working with data faster and more accurately. Learning more about them can really improve your use of Google Sheets, making your data work smarter and your tasks easier to handle. If you want to learn more about Google Sheets formulas and functionality, stay tuned with us!
Behçet is a content writer at forms.app. He is a music producer and enjoys blending electronic and acoustic tunes. Behçet has expertise in Google Sheets, survey questions, and online forms.
