How can I see the statistics of my form?
Statistics allow you to understand how people are interacting with your form. This information can help you track the success of your form and determine whether or not it is meeting its goals. Luckily, forms.app offers great insights with its statistics page for your form responses.
What can you learn on the statistics page?
Statistics offers a number of valuable pieces of information for you, as a form owner. You can access the statistics for your form responses on the results tab. Once you are there, you will be able to see data about each form question, the selection rates of each option, and the fill percentage.
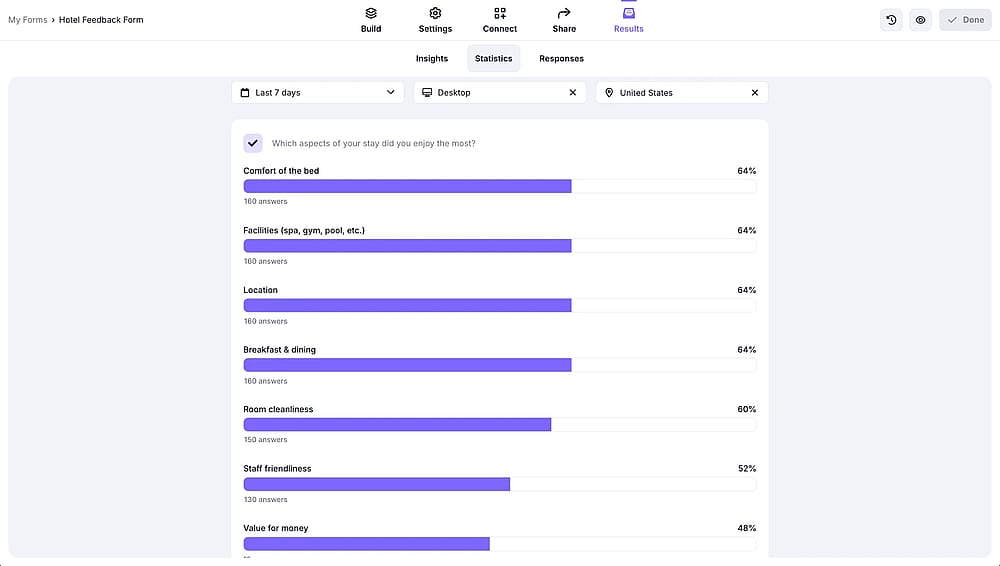
An image showing the statistics page
Besides statistics, you can access other information about the form responses. Make sure to check our articles for Insights, and take a look at the results page yourself.
How can you filter statistics?
In order to see statistics for the specific time frame, in a specific location, or on a specific device, simply use the filter options above. The statistics will change based on the filters you use. You can combine multiple filters to dig deeper into your data.
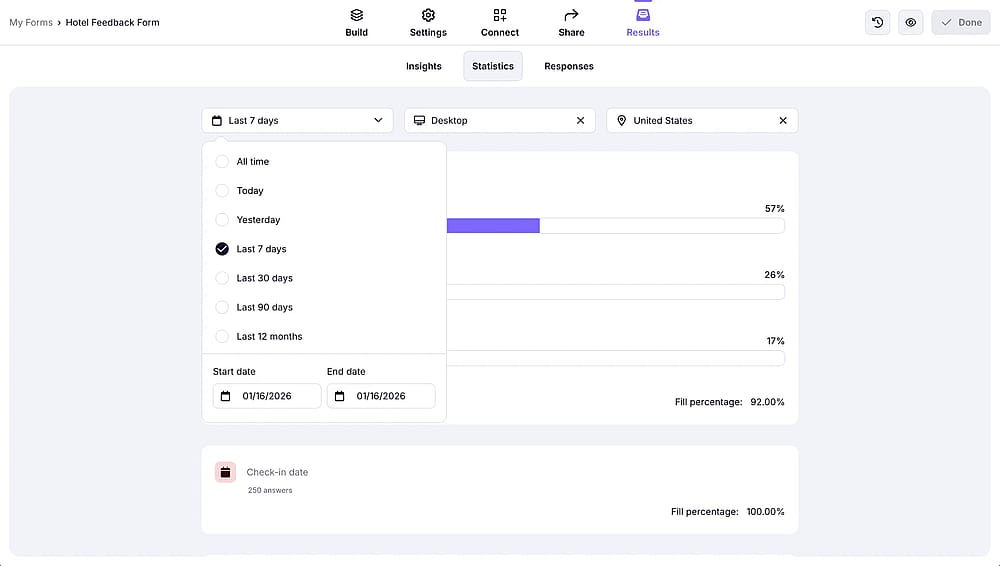
An image showing how filters work in the statistics page
While it is not possible to reset the statistics of a form, you can always duplicate your form and start getting new responses from the start. Alternatively, you can apply filters to see only the statistics beyond a certain date.