Numbers, measurement, and objectivity.
Take a good look at these three words because they are the simplest definitions of quantitative data. It is possible to encounter it almost everywhere in your life. For example, the answer to the question "How often do you go to the movies?" is quite an example of quantitative data. Examining the prices of markets selling your favorite biscuits is also a quantitative analysis.
However, businesses and organizations use this analysis in ways that are more detailed and serve different purposes than yours. Various methods, tools, modeling techniques, and programs are used for this. This article aims to enable you to collect and analyze quantitative data professionally. Thus, you can start by first learning its definition.
What is quantitive data analysis?
Quantitative data analysis is the research method of any dataset that has a measured value that can be objectively counted.
It is used to make sense of what, how much, how many, and how often. So, close-ended questions are the essence of quantitative data. It is used to create units so that a definition can be made scientifically. As can be seen in every aspect of life, businesses use it to create mathematical calculations, statistics, and algorithms.
When to use quantitive data analysis?
In fact, quantitative data analysis does not have a specific time to be used. However, certain times may be more suitable depending on your own needs. These times are, of course, thresholds where important decisions will be made about your business or organization. To help you better understand which thresholds they are, a few examples are listed below:
- You may want to expand your sales to a new region, and that's why you need proper market research. You can use it when you need to examine large datasets such as market trends, customer preferences, and competitor companies in the market.
- Your business may be in financial trouble. You can conclude exactly why you are in this situation by comparing old and current company data. In this way, you mitigate both current and future risks.
- You may want to offer better opportunities to your customers. But for this, you need to know them better than they do. Therefore, you can collect quantitative data necessary for your analysis by conducting various surveys and monitoring websites and social media traffic.
Types of quantitive data analysis
Quantitative data is used quite frequently, and therefore, it is familiar to many research types. The situations in which quantitative data analysis methods are used are characteristically different in each. It will be presented with quantitative data analysis examples for your better understanding of these various types.

Quantitive data analysis types
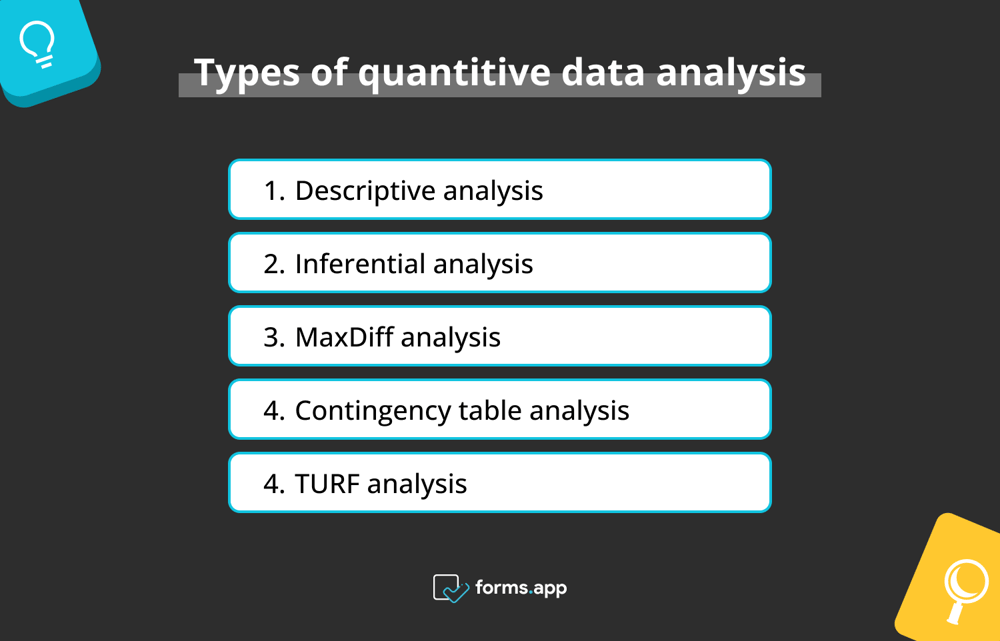
1. Descriptive analysis
Descriptive analysis is the type most frequently used in quantitative data analysis, with its objectivity and ability to reveal the situation as it is without any interpretation. As many will remember from mathematics lessons, it starts with the calculation of mean, median, and mode (i.e., measures of central tendency).
Then, standard deviation and variance are calculated to provide tangible numerical data. However, as mentioned, this analysis only describes what is, that is, the interpretation of the resulting data is entirely based on human input.
2. Inferential analysis
Testing your hypothesis, conducting regression analysis, or measuring confidence intervals are the main techniques of this type. The main purpose of this type is to make predictions about a population. It achieves this by examining sample data. By using this type, companies have a guide to future trends, problems, and solutions.
3. MaxDiff analysis
MaxDiff analysis, which is short for maximum difference scaling, is a type of analysis that helps classify the preferences used in market research. Although it has common aspects with conjoint analysis, it is preferred because it is simpler.
Because according to the working logic of this analysis, survey participants are asked to choose the best and worst options. Researchers examining these options obtain proportion and frequency data according to preferences.
4. Contingency table analysis
A contingency table is a type of analysis used not only for quantitative data but also for qualitative data. However, it is one of the most frequently used methods in the quantitative data analysis process.
Because it simply helps create inferences from different data sets. The relationship of each cell in the table to each other is displayed and analyzed in this format. In conclusion. It is a suitable method for investigating variables in an observable way.
5. TURF analysis
TURF analysis, which stands for Total Unduplicated Reach and Frequency, is one of the quantitative market research methods. It is used to understand consumer preferences and product sales by examining the total market reach of a product. It is utilized in market research to find the most interesting combinations and techniques.
Examples of quantitive data analysis
Data analysis in research has examples in every aspect of one's life. These can be any field where mathematical data reaches. To give examples of these, both in general and in terms of businesses:
💡While the satisfaction rate of customers using brand A is 6 out of 10, the satisfaction rate of those using brand B is 4 out of 10.
💡I spend at least $100 every week, and at the end of the month, I have $20 left over.
💡The number of people attending this year's fair will be over a thousand.
💡While 77% of Americans have adopted online shopping, this rate is lower in Europe.
💡The business's website receives 100 thousand hits per week.
💡The company's revenues have increased by 30% in the last decade. Despite this, the customer scale did not change, and the number of new customers increased by 5%.
These data are quantitative data that are not complex and have a small sample size. It can be evaluated without being subjected to detailed research. However, situations where there is a lot of raw data and relationships between variables need to be revealed with techniques such as data visualization are more detailed.
Frequently asked questions about quantitive data analysis
If you read this article and still have issues that you are not satisfied with, the frequently asked questions below may help you.
Analyzing quantitative data gives precise results based on natural observations of mathematics. Since objectivity is at the forefront, researchers' personal opinions and hypotheses do not matter much. On the other hand, quantitative data seems insufficient to make sense of human life because it is not always possible to make an inference only with the data obtained. Therefore, quantitative data is insufficient where descriptive measures are required.
Quantitative data reflects a concrete reality by dealing only with numbers and measurements. On the other hand, qualitative data is shaped by people's thoughts, observations, and judgments. Both are used quite frequently by businesses. For example, quantitative analysis is used to examine the company's financial situation, while qualitative analysis is used to explore the company's relationship with its customers.
The three main types of quantitative data analysis are descriptive analysis, inferential analysis, and predictive analysis. You can use descriptive analysis to summarize your data, inferential analysis to test your hypothesis, and predictive analysis to forecast and understand the future situation.
First, make sure the data you have is perfect for analysis. Cleaned and organized data is important for quality. Then, explore your data using appropriate analysis techniques and programs. Test your hypotheses and make inferences. Finally, the analysis should be interpreted and used as actionable insight.
Final words
As a result, when used competently, quantitative data analysis is a valuable source of insight for businesses and organizations. It is a process that requires systematically collecting, processing, using methods, analyzing, and interpreting data.
This blog post aims to help you by giving details about these processes and quantitative analysis examples to grasp the topic. Now that you have a better level of statistics and analysis skills, you can start using quantitative data analysis in your research. It is time to start quantitative data collection!
forms.app, your free form builder
- Unlimited views
- Unlimited questions
- Unlimited notifications


