Screen time has naturally increased across all segments of society. Whether for work, school, or leisure, people spend much time in front of screens. Too much screen time comes with its own set of problems. Eye diseases, fatigue, and work inefficiency are some of the negative effects of too much screen use.
This is where dark mode comes in. Various studies have proven that dark mode or night mode reduces eye strain. It can also increase focus on work, making people who use dark mode more productive compared with the people who use white backgrounds. We've compiled 35+ dark mode usage statistics to help you better understand the benefits of dark mode. Now, let's move on to our article.
Highlighted statistics about dark mode
No matter what you use it for, enabling dark mode background colors on your phone or other devices will help your device's battery life more than light backgrounds. Another benefit of dark mode is that it is effective in reducing glare and some blue light. Now, take a look at the highlighted statistics we have compiled from our categorized statistics.
Here are some highlighted statistics you need to know:
- The dark mode usage in forms.app is 28%.
- With AMOLED screens, the dark mode can save up to 63% on battery life (Night Eye).
- According to a recent study, using several popular Android apps in dark mode at maximum brightness can save up to 58.5% on display battery consumption (The Small Business Blog).
- In December 2021, Chrome Platform Status found that users with the "prefer dark" setting accounted for 22% of web traffic (Web.dev).
- Dark mode is used by 81.9% of 2,500 Android users on their phones, in apps, and other situations. 9.9% alternate between the light and dark settings (LinkedIn).
- According to a 2021 survey, users may now choose to use dark mode in almost 90% of well-known programs, demonstrating the widespread use of this feature across multiple platforms (Gitnux).
- According to a Mailjet survey, 11% of marketers say they're always using dark mode, and only 28% of respondents said they have no plans to use dark mode in their emails (Mailjet).
- 29% of subscribers using Outlook for Mac with macOS and iOS used Dark Mode in 2020. This number was then expected to rise to 40% by the end of 2022 (Litmus).
35+ Eye-opening dark mode statistics you need to know
Experts claim people with light sensitivity or vision impairment may benefit from using dark backgrounds. Before deciding whether to use dark mode settings or not, check out the statistics we've compiled for you. It will give you enough information on the subject. You will also learn about the popularity of dark mode and dark mode email. Here are 35+ dark mode statistics:
General statistics about dark mode
General dark mode statistics will give you an overview of the topic without going into detail. The general dark mode statistics will provide you with certainty before you start using dark mode on your phone or computer. Here are general statistics about dark mode to get an insight:
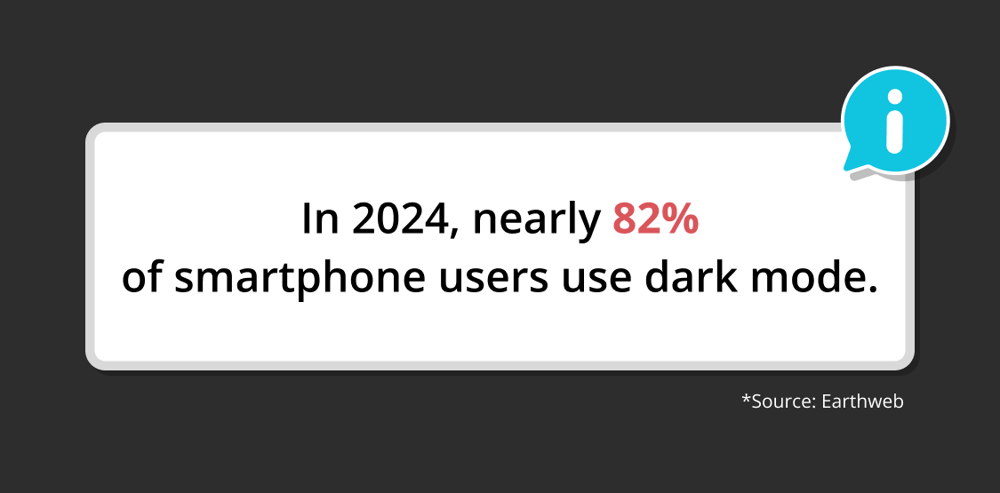
1. In 2024, nearly 82% of smartphone users use dark mode (Earthweb).
2. With AMOLED screens, the dark mode can save up to 63% on battery life (Night Eye).
3. When the screen was at 100% brightness, utilizing dark mode reduced power consumption by an average of 67% (Nielsen Norman Group).
4. Dark mode makes it easier to code for more extended periods, according to 70% of software professionals globally (The Small Business Blog).
5. According to 31% of marketers, one of the main issues with dark mode is automatic color inversion (Mailjet).
6. Researchers discovered that only 3% to 9% of energy was saved while moving from low to mid brightness in dark mode (Android Authority).
7. In December 2021, Chrome Platform Status found that users with the "prefer dark" setting accounted for 22% of web traffic (Web.dev).
8. At 30% screen brightness, the average power saving achieved by using dark mode is 14% (Nielsen Norman Group).
9. According to a recent study, using several popular Android apps in dark mode at maximum brightness can save up to 58.5% on display battery consumption (The Small Business Blog).
10. Among the population addicted to cell phones/laptops with bright white screens, 59% complain of dry eyes, irritation, neck and shoulder pain, headaches, and visual impairment (Sigma Telecom).
11. After 10 p.m., about 82.7% of users put their phones in dark mode, revealing a particular usage trend (Helpfultech).
Source: Eartheb
Dark mode popularity statistics
Reading statistics about the popularity of dark mode will give you an idea about its prevalence and uses. These statistics will also encourage you to use dark mode in work and everyday life. You will be able to make comparisons between the light and dark modes and adapt them for yourself. Check out these dark mode popularity statistics:
12. 64.6% of users want websites to switch to dark mode automatically (Earthweb).
13. Dark themes are optimized in the UX design of 283 of the top US companies (Increditools).
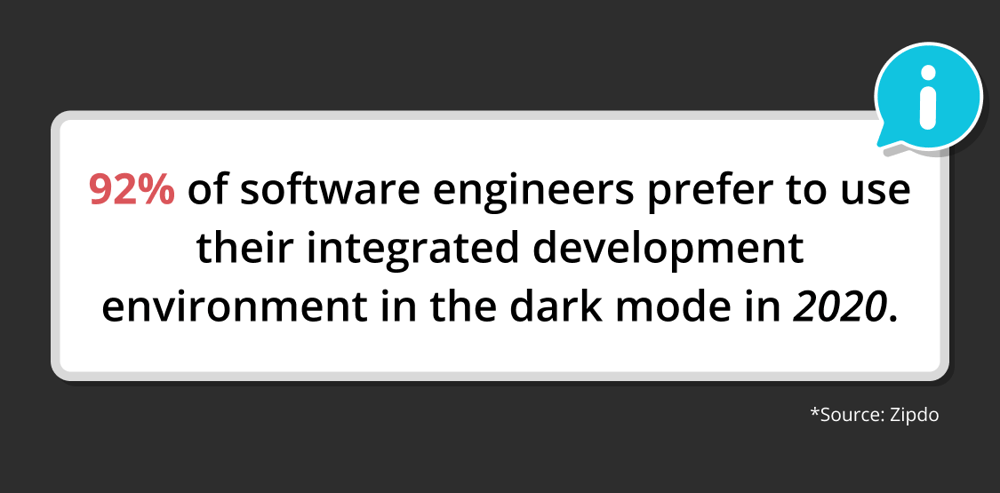
14. 92% of software engineers prefer to use their integrated development environment in the dark mode in 2020 (Zipdo).
15. According to a 2021 survey, users may now choose to use dark mode in almost 90% of well-known programs, demonstrating the widespread use of this feature across multiple platforms (Gitnux).
16. In early 2020, a survey showed that around 82% of users preferred Android's Dark Theme (Litmus).
17. Around October 2019, the term "dark mode" became popular on Google Trends as more users started to notice and show interest in it (MarketSplash).
18. Among Apple iOS users, dark mode adoption rates range from 55% to 70% (Earthweb).
19. 82.7% of respondents to a Medium survey stated they use the dark mode on their operating system (Medium).
20. About one-third of respondents to a poll conducted by Nielsen Norman Group among 115 mobile users indicated they typically use their smartphones in dark mode, one-third in light mode, and one-third in a combination of the two (Nielsen Norman Group).
21. Dark mode is used by 81.9% of 2,500 Android users on their phones, in apps, and in other situations. 9.9% alternate between the light and dark settings (LinkedIn).
22. Dark Mode preference in Microsoft Office products, including Word, Excel, and PowerPoint, climbed by 60% in 2020 (Zipdo).
23. Dark mode was activated by 39.6% of users within 24 hours of the release of macOS Mojave (LinkedIn).
24. According to Litmus research, around 25% of Litmus subscribers prefer Dark Mode (Litmus).
💡Check out our 40+ SaaS business statistics if you are curious about more statistics.
Source: Zipdo
Dark mode email statistics
Dark mode email statistics will guide you on how to use dark mode with your email clients. You will see the optimization rates of dark mode in emails, and you will be able to make acquisitions for your own business. Without further ado, check out these dark-mode email statistics:
25. According to a Mailjet survey, 11% of marketers say they're always using dark mode, and only 28% of respondents said they have no plans to use dark mode in their emails (Mailjet).
26. 29% of subscribers using Outlook for Mac with macOS and iOS used Dark Mode in 2020. This number was then expected to rise to 40% by the end of 2022 (Litmus).
27. In September 2022, 5.4% of emails analyzed by Sendview contained code targeting the dark mode style (Sendview).
28. In 2022, 35% of consumers used dark mode when opening emails (Litmus).
29. According to Sendview, between September 2021 and November 2021, the number of campaigns optimized for dark mode climbed from 2.1% to 4.4%. Another increase occurred in December, rising to 4.9% (Sendview).
30. About 37% of iOS users have embraced dark mode, even though only 7.5% of users utilize it with Apple Mail (Email Uplers).
31. A Sendview survey conducted in December 2020 found that 0.4% of emails were dark mode optimized. This percentage was 0.6% in March 2021. By Summer 2021, that percentage had increased to slightly more than 1.5% (Sendview).
32. 72% of marketers in the Mailjet survey use dark-mode emails. Of all emails, 44% are specially designed to be viewed in dark mode at least sometimes (Mailjet).
33. By April 2022, 5.2% of all analyzed emails contained dark mode, up 0.3 percentage points from December 2021 (Sendview).
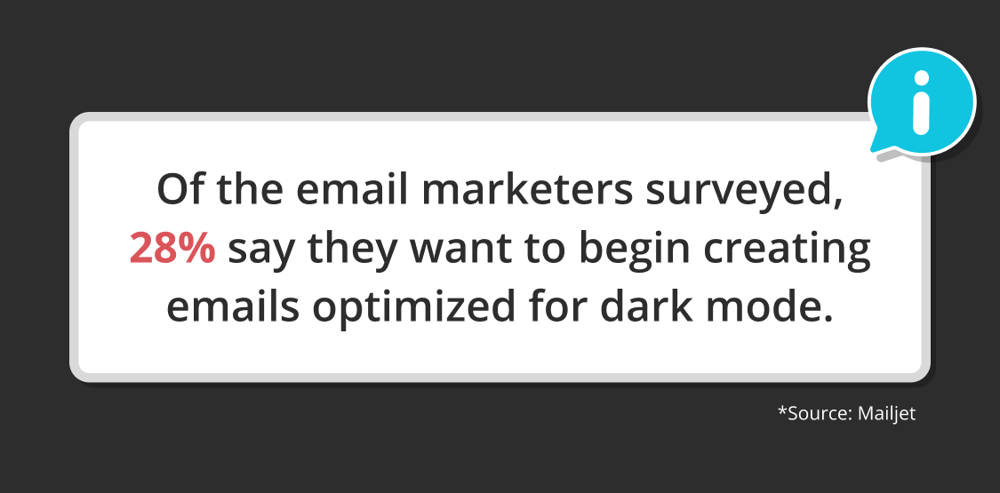
34. Of the email marketers surveyed, 28% say they want to begin creating emails optimized for dark mode (Mailjet).
35. The percentage of emails that adopted dark mode increased to 6.7% between December 2022 and January 2023 but fell to 5.9% in February 2023 (Sendview).
Source: Mailjet
Conclusion
Using dark mode on your phone or other electronic devices can benefit both your eyes and your device's battery life. In addition to reducing eye strain, it also makes you more productive and effective when working on your computer. You have seen some crucial data regarding dark mode in our article by examining statistics in different categories.
By analyzing more than 35 dark mode statistics, you can start using dark mode in your work or everyday life. Our statistics will provide you with sufficient knowledge on the subject. You will be able to compare data and make better decisions. Now you have seen everything necessary about the topic!
forms.app, your free form builder
- Unlimited views
- Unlimited questions
- Unlimited notifications
