Special offers and discounts offered by brands on Black Friday lead to lines in stores and increased online traffic on shopping websites. On Black Friday, brands compete with each other for discounts and offer appealing deals to customers. This leads to a worldwide shopping spree.
The shopping spree on Black Friday has also become an excellent opportunity for companies. Black Friday offers companies the opportunity to increase sales and strengthen brand awareness. We've compiled 75+ Black Friday statistics to help you better understand the subject. You can develop strategies for Black Friday for your company with the help of these statistics.
Interesting facts about Black Friday
On Black Friday, the number of purchases peaks, and consumer spending massively increases. It is now a habit applied everywhere in the world due to globalization and technological advancement. Before we get to our inspiring statistics, let's look at some interesting facts about Black Friday:
- The phrase "Black Friday" originated in the 1800s to describe the stock market crashes.
- The phrase "Black Friday" describes when businesses make a profit or are in black ink, as opposed to when they first recorded losses or in red ink.
- People in the United States spend more time shopping on Thanksgiving weekend than they do in Disneyland.
- The NY Times reported in 1975 that the phrase "Black Friday" originated in Philadelphia.
- On Black Friday, some products are priced similarly to their standard in-store cost.
- Black Friday used to be known as "Big Friday".
- Derivative products are frequently offered at sales on Black Friday. These products may not have the same features and quality as the original model but have the same appearance.
- Since 2006, there have been 98 injuries and seven deaths related to Black Friday shopping.
75+ Black Friday statistics to get valuable insights
Making decisions based on statistics and determining sales strategies will put you ahead of your competitors on Black Friday. Check out our Black Friday statistics by year to learn everything necessary about the topic. Our Black Friday report and categorized statistics allow you to approach the topic from different angles. Here are 75+ Black Friday statistics to get valuable insights:
General statistics about Black Friday
Without getting into specifics, general statistics on Black Friday will provide you with a broad overview of the subject. By examining general Black Friday facts and statistics, you can find insights for your company and summarize the information that will benefit you. To help you understand, below are some general statistics about Black Friday:
1. Approximately 166.8 million Americans shopped on Black Friday in 2023 (Demandsage).
2. People from France had the largest budget in Europe, with an average budget of almost 309 euros for Black Friday in 2023 (Statista).
3. On Black Friday in 2023, 76.2 million people shopped in-store, and 90.6 million made online purchases (Fit Small Business).
4. In 2022, Black Friday and Cyber Week exhibited the highest monthly email conversion rate. Automated messages finished at 2.5% and campaign emails at 0.13% (Omnisend).
5. 26% of the Black Friday customers reported being shoved or pushed by other Black Friday shoppers, 7% reported verbally arguing with someone, and 3% have gotten into a physical altercation (Drive Research).
6. In October 2022, Black Friday deals were three times more than average (Queue.it).
7. 58% of consumers learn about Black Friday and/or Cyber Monday offers through emails, while 64% of customers find them on retailer websites (Drive Research).
8. A total of 141 million emails were sent on Black Friday in 2022 (Omnisend).
9. 48% of customers think that brands release lower-quality products on Black Friday (Fit Small Business).
10. According to a recent survey, approximately 40% of US shoppers indicated they will undoubtedly purchase Black Friday goods in-store in 2023 (Statista).
11. 39% of Gen X, 58% of Gen Z, 54% of millennials, and 37% of baby boomers highly depend on Black Friday (CNBC).
12. Between 2021 and 2022, there was a 10% rise in in-store Black Friday sales (Demandstage).
13. On Black Friday, 18% of consumers are willing to wait more than an hour in a checkout line (Drive Research).
14. In 2022, 19% of American consumers said they would shop on Prime Day, Black Friday, and Cyber Monday (Deloitte).
15. Compared to 2021, in-store traffic on Black Friday increased by 2.9% in 2022 (Sensormatic).
16. Based on the findings of a recent survey, Spanish consumers amounted to 273 euros on average for Black Friday in 2023 (Statista).
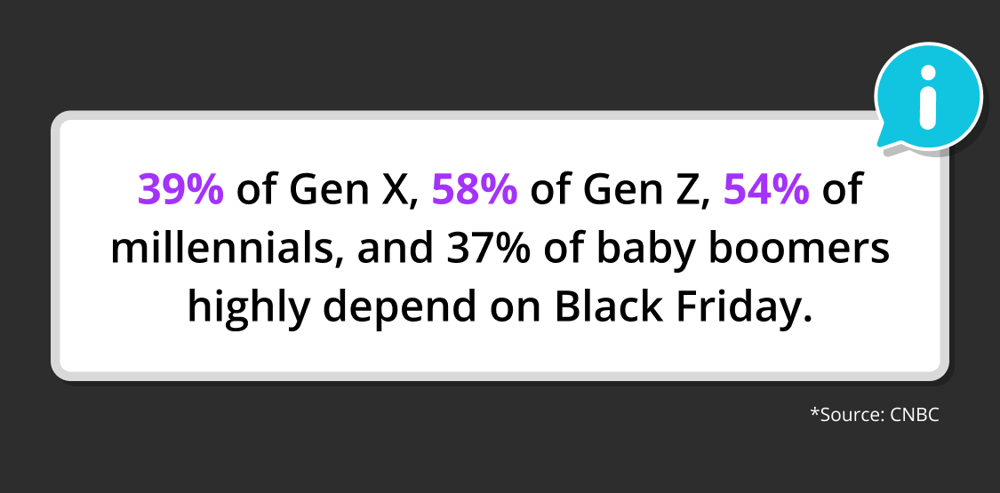
Source: CNBC
Black Friday sales statistics
Black Friday is one of the highest sales days of the year. Some shoppers wait, especially for Black Friday, to shop and buy gifts to take advantage of the discounts. Companies need to meet customers' expectations on this biggest shopping day. Here are some Black Friday sales statistics to guide you in meeting your customers' expectations:
17. According to predictions, Black Friday sales online are expected to reach $9.8 billion in 2024 (Demandsage).
18. Black Friday e-commerce sales increased 8.5% in 2023 compared to the previous year (MasterCard).
19. Sales for the independent retailers who used Amazon reached 1 billion dollars over the four Black Friday shopping days (Demandsage).
20. On Black Friday in 2022, 87.2 million American customers made online purchases; this number is about the same as in 2021 (National Retail Federation).
21. US Black Friday sales increased by +2.5% in 2023 compared to 2022 (MasterCard).
22. Smartphones made up nearly 48% of Black Friday's online sales (Demandsage).
23. In 2023, 23% of consumers intend to spend 1,000 dollars or more on holidays. It is a 15% increase from Black Friday 2022 (Drive Research).
24. In 2022, Black Friday spending increased by 2.3% compared to 2021, reaching 9.12 billion dollars (Adobe Experience Cloud).
25. Over Black Friday weekend in 2023, the most popular purchases were electronics at 73% and clothing and accessories at 82% (Drive Research).
26. Between Black Friday and Christmas, the United States sees nearly 13% of its retail sales (Demandsage).
27. With 1.22 million searches made during the examined period, the Nintendo Switch was the most popular product worldwide for Black Friday in November 2021 (Statista).
28. On Black Friday, US e-commerce sales increased 14% over the previous year in 2023 (Queue.it).
29. In a recent survey, more than 80% of US retailers believe that industry-wide sales events like Black Friday and Cyber Monday benefit only a select group of mega-retailers (Statista).
30. In the US, in 2022, Black Friday ranked as the busiest day for in-store shopping, with 72.9 million shoppers, an increase of over 15% from the previous year (National Retail Federation).
31. On Black Friday, 54% of consumers said they are more inclined to shop at stores that provide in-store online pick-up (BOPUS) (Drive Research).
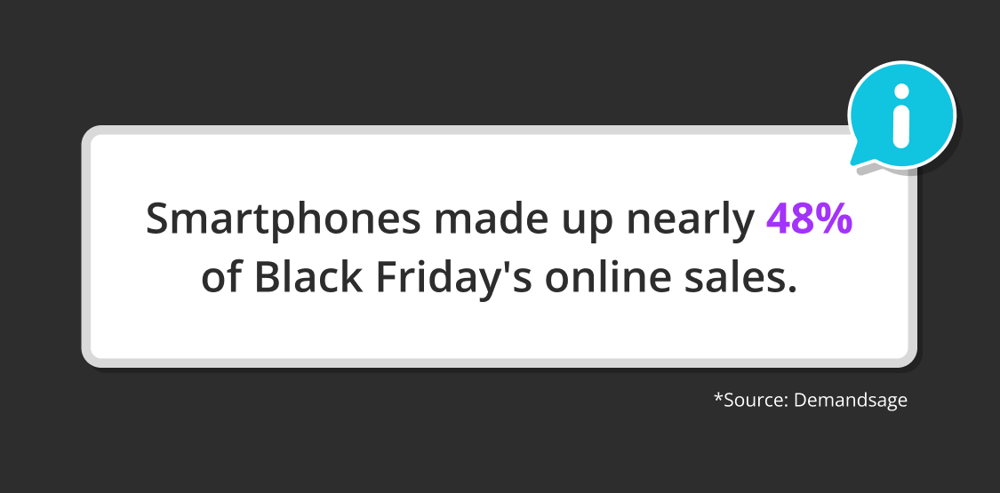
Source: Demandsage
Black Friday discount statistics
Black Friday discounts offer businesses the opportunity to win over customers who are hesitant to make a purchase. By offering customers favorable prices and a good shopping experience on the busiest shopping day, you can build customer loyalty for your brand. Reviewing the discount statistics will help you make comparisons for Black Friday retail and adapt what you learned. Here are Black Friday discount statistics:
32. The average discount offered to customers on Black Friday and Cyber Monday in 2023 was 31% (Demandsage).
33. Roughly 30% of the people in the US thought the Black Friday discounts were worth their money. According to another 34% of customers, the trouble of shopping on that particular day was not always worth it (Statista).
34. The average discount for Black Friday was 28% in 2023, 27% in 2022, 26% in 2021, and 34% in 2020. (Fit Small Business).
35. According to the 2023 survey, 24% of customers said that businesses overpriced products on Black Friday and discounted them on the actual day (Statista).
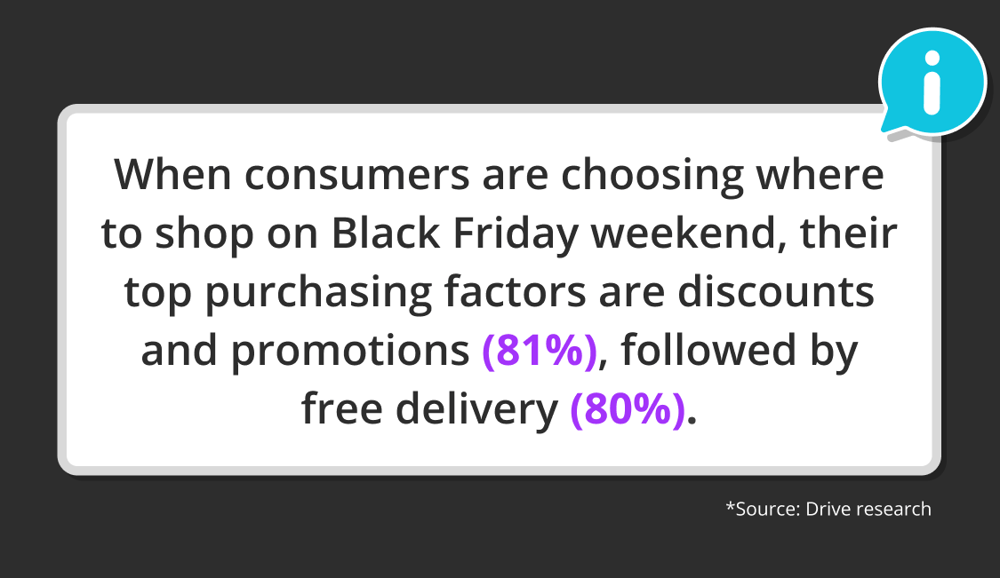
36. When consumers are choosing where to shop on Black Friday weekend, their top purchasing factors are discounts and promotions (81%), followed by free delivery (80%) (Drive Research).
37. Since they believe they can take advantage of the best prices of the season or sales, 73% of customers are shopping in-store on Black Friday (Deloitte).
38. According to PYMNTS, 3.7% of Black Friday online shoppers paid for their purchases with flexible buy now, pay later (BNPL) credit offers (PYMNTS).
39. 60% of Gen Z bought something on Black Friday at a discount they later regretted (Finder).
40. In the UK, 32% of shoppers said they use search engines to get the most excellent Black Friday discounts, while 19% said they visit retailer websites (Statista).
41. On Black Friday, most stores give discounts ranging from 70% to 80% (Demandsage).
42. Because of the increasing inflation rates on everyday products, 67% of consumers are more interested in Black Friday discounts (Fit Small Business).
43. In 2022, 56% of German consumers claimed that their financial situation had worsened, and they relied on Black Friday discounts to buy for Christmas (Statista).
Source: Drive Research
Statistics about customer behavior on Black Friday
Some consumers shop online on Black Friday because they don't want to stand in long lines in stores. Brands need to develop social media and marketing strategies to appeal to these customers who wish to benefit from discounts from the comfort of their homes. To get information about such situations, have a look at the customer behavior on Black Friday statistics:
44. In 2024, 75% of Americans plan to shop on Black Friday or the weekend (Demandsage).
45. A recent survey found that 70% of Italian respondents only made online purchases on Black Friday 2023, while slightly more than 50% of respondents in Spain and France only made online purchases (Statista).
46. On Small Business Saturday, Cyber Monday, and Black Friday, 18% of consumers stated that they wouldn't go shopping (Drive Research).
47. Compared to 2022, 13% of Black Friday shoppers used Apple Pay in 2023, which is an increase of 8% (Demandsage).
48. In 2023, 57% of women and 44% of men were likely to participate in Black Friday sales (Finder).
49. 45% of consumers who shop on Black Friday will leave the store in less than 30 minutes (Drive Research).
50. People spent about 70% of their Black Friday purchases on gifts (National Retail Federation).
51. In 2023, 68% of people shopped online for Black Friday, while only 27% physically shopped in a store. In 2022, the figure was 43% (Drive Research).
52. Credit cards were The most popular payment method for Black Friday shopping. 49.4% of the online shoppers use them (Demandsage).
53. 45% of shoppers begin their in-person Black Friday shopping before 10 AM (Drive Research).
54. According to a survey, 68% of Generation Z plan to shop for Black Friday sales. However, Generation Z spends the least, with an average of 357 dollars (Finder).
55. Compared to men (44%), women (53%) are more inclined to take a store's return/exchange policies into account when deciding where to purchase over Black Friday weekend (Drive Research).
56. In 2022, 31% of consumers planned to begin their Black Friday shopping on Thursday, and 15% scheduled to start on Friday between midnight and 5 AM (Dotdigital).
57. According to 59% of British consumers, they search mainly on Amazon for the best Black Friday offers in 2023 (Statista).
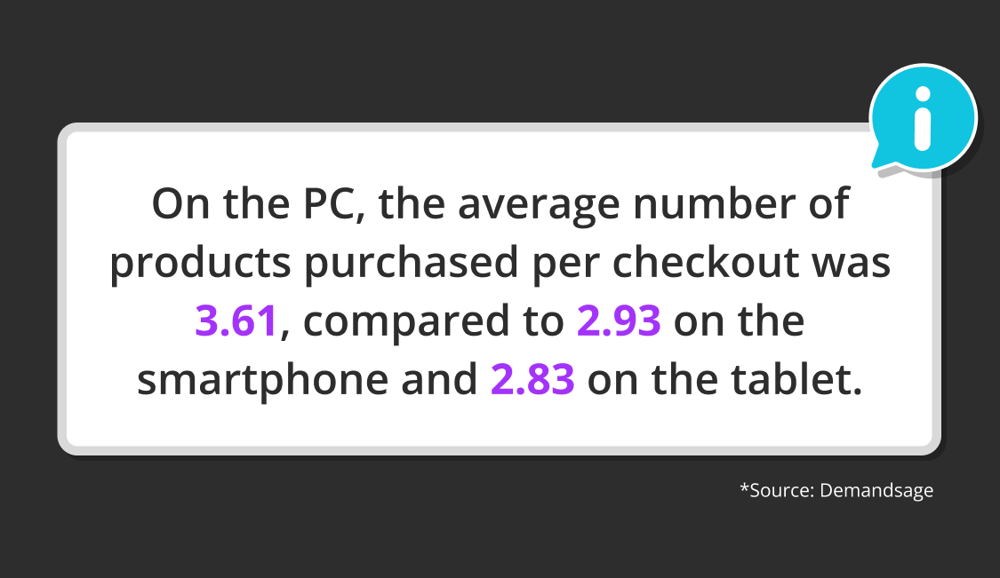
58. On the PC, the average number of products purchased per checkout was 3.61, compared to 2.93 on the smartphone and 2.83 on the tablet (Demandsage).
59. In 2022, 40% of British consumers intended to spend less on Christmas and Black Friday (Statista).
Source: Demandsage
Statistics about Black Friday consumer spending
The increase in consumer spending on Black Friday has a significant economic impact. During this period, it is very important for companies to know the spending habits of customers and what they spend more on. You can learn these data by checking out the statistics we have prepared for you. Here are statistics about Black Friday consumer spending:
60. In 2023, Black Friday sales exceeded 9.8 billion dollars. Compared to 2022, when sales were reported at 9.12 billion dollars, that is a $680 million increase (Demandsage).
61. Compared to men, with 23%, women are more likely to report they will spend less money on Black Friday shopping this year with 34% (Drive Research).
62. Each customer spends 256 dollars on Black Friday and Cyber Monday combined (Demandsage).
63. 11% of customers wait more than 2 hours to enter a store and shop on Black Friday (Drive Research).
64. In 2023, online cart sizes on Black Friday were 3.9 times larger than in-store cart sizes (Square).
65. On Black Friday in 2023, 78% of shoppers intended to spend the same amount or less as in 2022 (Drive Research).
66. On average, men in Great Britain intended to spend slightly less than women did on Black Friday 2023, at barely under 130 GBP (Statista).
67. In the US, the shopping rate on Black Friday was as high as 663% compared to regular days. This is the highest rate compared to rates in other countries (Moosend).
68. Nearly 78% of men in the United States who expected to shop online on Black Friday or Cyber Monday in 2023 said they were specifically going to buy electronics (Statista).
69. More than 52 million customers purchased from Shopify stores during the Cyber Monday and Black Friday weekend in 2022 (Influencer MarketingHub).
70. In 2023, 2/3 of consumers said the main reason for their Black Friday shopping was to buy Christmas gifts for friends and loved ones (Statista).
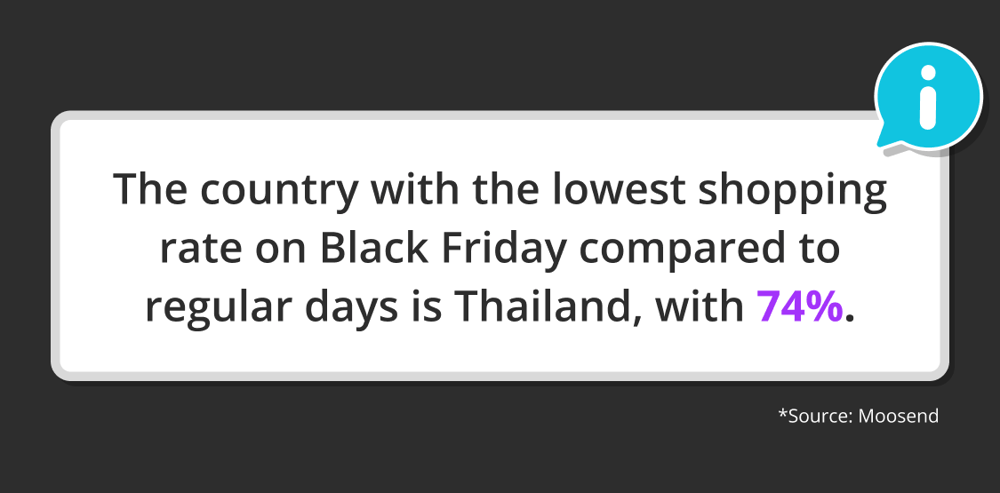
71. The country with the lowest shopping rate on Black Friday compared to regular days is Thailand, with 74% (Moosend).
72. In 2023, more than 60% of women in the United States intended to purchase electronics on Black Friday, yet clothing and accessories were the most popular purchases made by women (Statista).
73. On Black Friday, online toy sales rose by 285% over a typical day. Sales of electrical and audio equipment increased by 200% when compared to a typical day (Demandsage).
74. In 2022, Cyber Monday was predicted to have the highest average spend of 218 dollars, followed by Black Friday at 205 dollars and Prime Day at 193 dollars (Deloitte).
75. Consumers were expected to spend a total of 8.74 billion pounds over the Black Friday weekend in 2023, including 3.9 billion in stores (Statista).
Source: Moosend
Final words
Black Friday is an excellent opportunity to increase your brand awareness and sales. Analyzing categorized Black Friday statistics can help you learn about important topics such as Black Friday discounts, customer behavior, and consumer spending. Having information on these topics will give you the opportunity to make comparisons with other examples and guide you.
By determining your strategies on Black Friday, you can make the right choices and be successful. Checking out the 75+ Black Friday statistics in different categories will help you take the first step in this regard.
forms.app, your free form builder
- Unlimited views
- Unlimited questions
- Unlimited notifications
