A full guide to the Time Series Analysis
Will sales be good next month? Are you ready for the winter season as a business? Is your annual turnover stable? If you are wondering about the answers to these and similar questions, time series analysis will help you in this subject. Get excellent results for your research by examining trends and patterns depending on the time variable. Now, let's dive deeper into time series analysis, starting with its definition.
What is the time series analysis
Time series analysis is a statistical method used in data science to examine a series of data points collected at regular intervals over a period.
Many different variables affect an event, but the time series analysis primarily examines time. Therefore, in this method, data is not recorded randomly but continuously at regular intervals.
Time series data is unique because it can reveal the change of variables over time, highlight critical periods, and clearly show the factors that affect the outcome. But to do this successfully, you need many data points. Only then can you understand whether the patterns are really changing at a regular rate and whether the monthly and seasonal variables are well-defined. Ultimately, you can use the data turned into information to make predictions and plans about the future.
When to use time series analysis
Time series analysis is one of the analysis techniques used for future trend prediction. It uses historical data and reveals the pattern between past events. So, you use it most basically when you want to make a rough prediction about the future. Apart from that, you can also use it in the following situations:
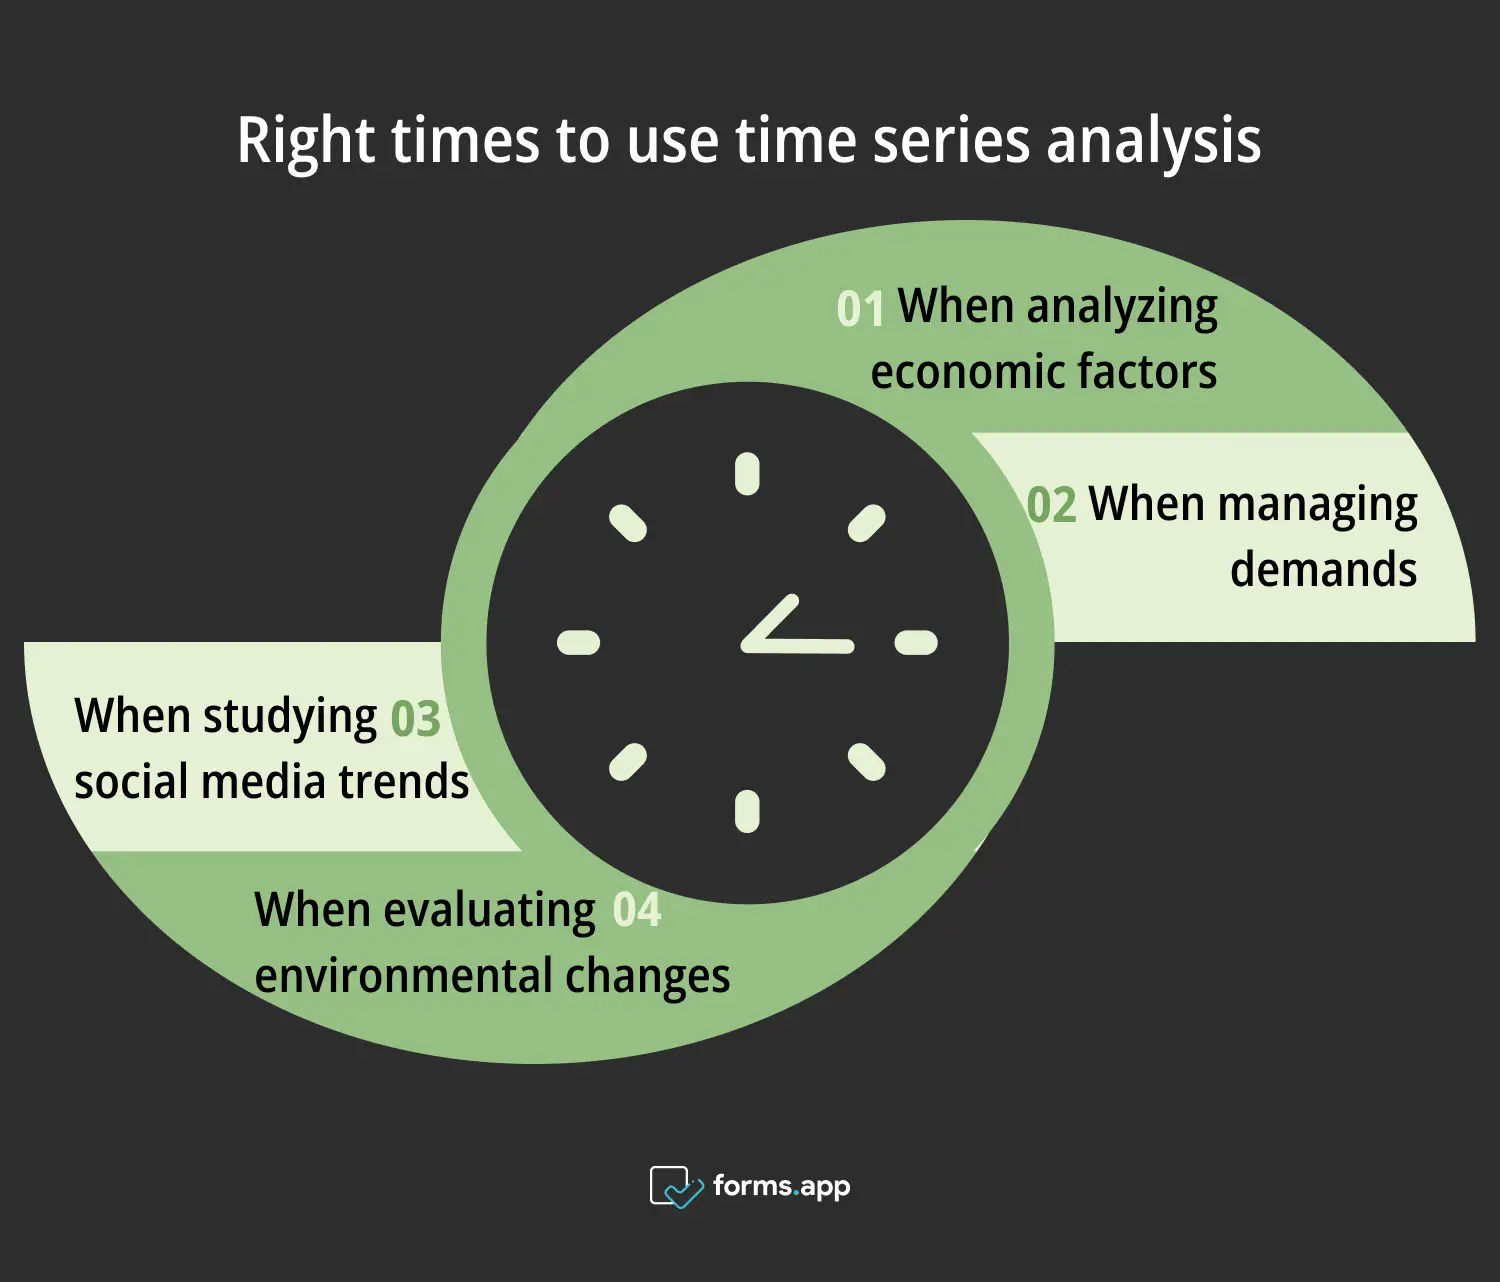
Correct times to use time series analysis
⏰When analyzing economic factors: It can be used to examine any economic scenario, big or small. It is an ideal tool to track the country's general inflation rate, unemployment, and salaries and plan accordingly.
⏰When managing demands: It can be used to adjust the supply-demand situation when you enter a new market or want to pre-supply for future sales.
⏰When studying social media trends: Analyzing the social media interactions of your customers or potential customers can be used to make adjustments to the current and future direction of your business.
⏰When evaluating environmental changes: This research is useful for the Ministry of Environment. However, since it is also research that businesses that interact with the environment should do, this analysis can be used to examine variables such as climate change and ocean temperature.
Why to use time series analysis
There are many reasons why organizations and businesses use time series analysis. First and foremost among these are the positive aspects of examining data over time. To expand on this further and give other examples, here are the objectives of time series analysis:
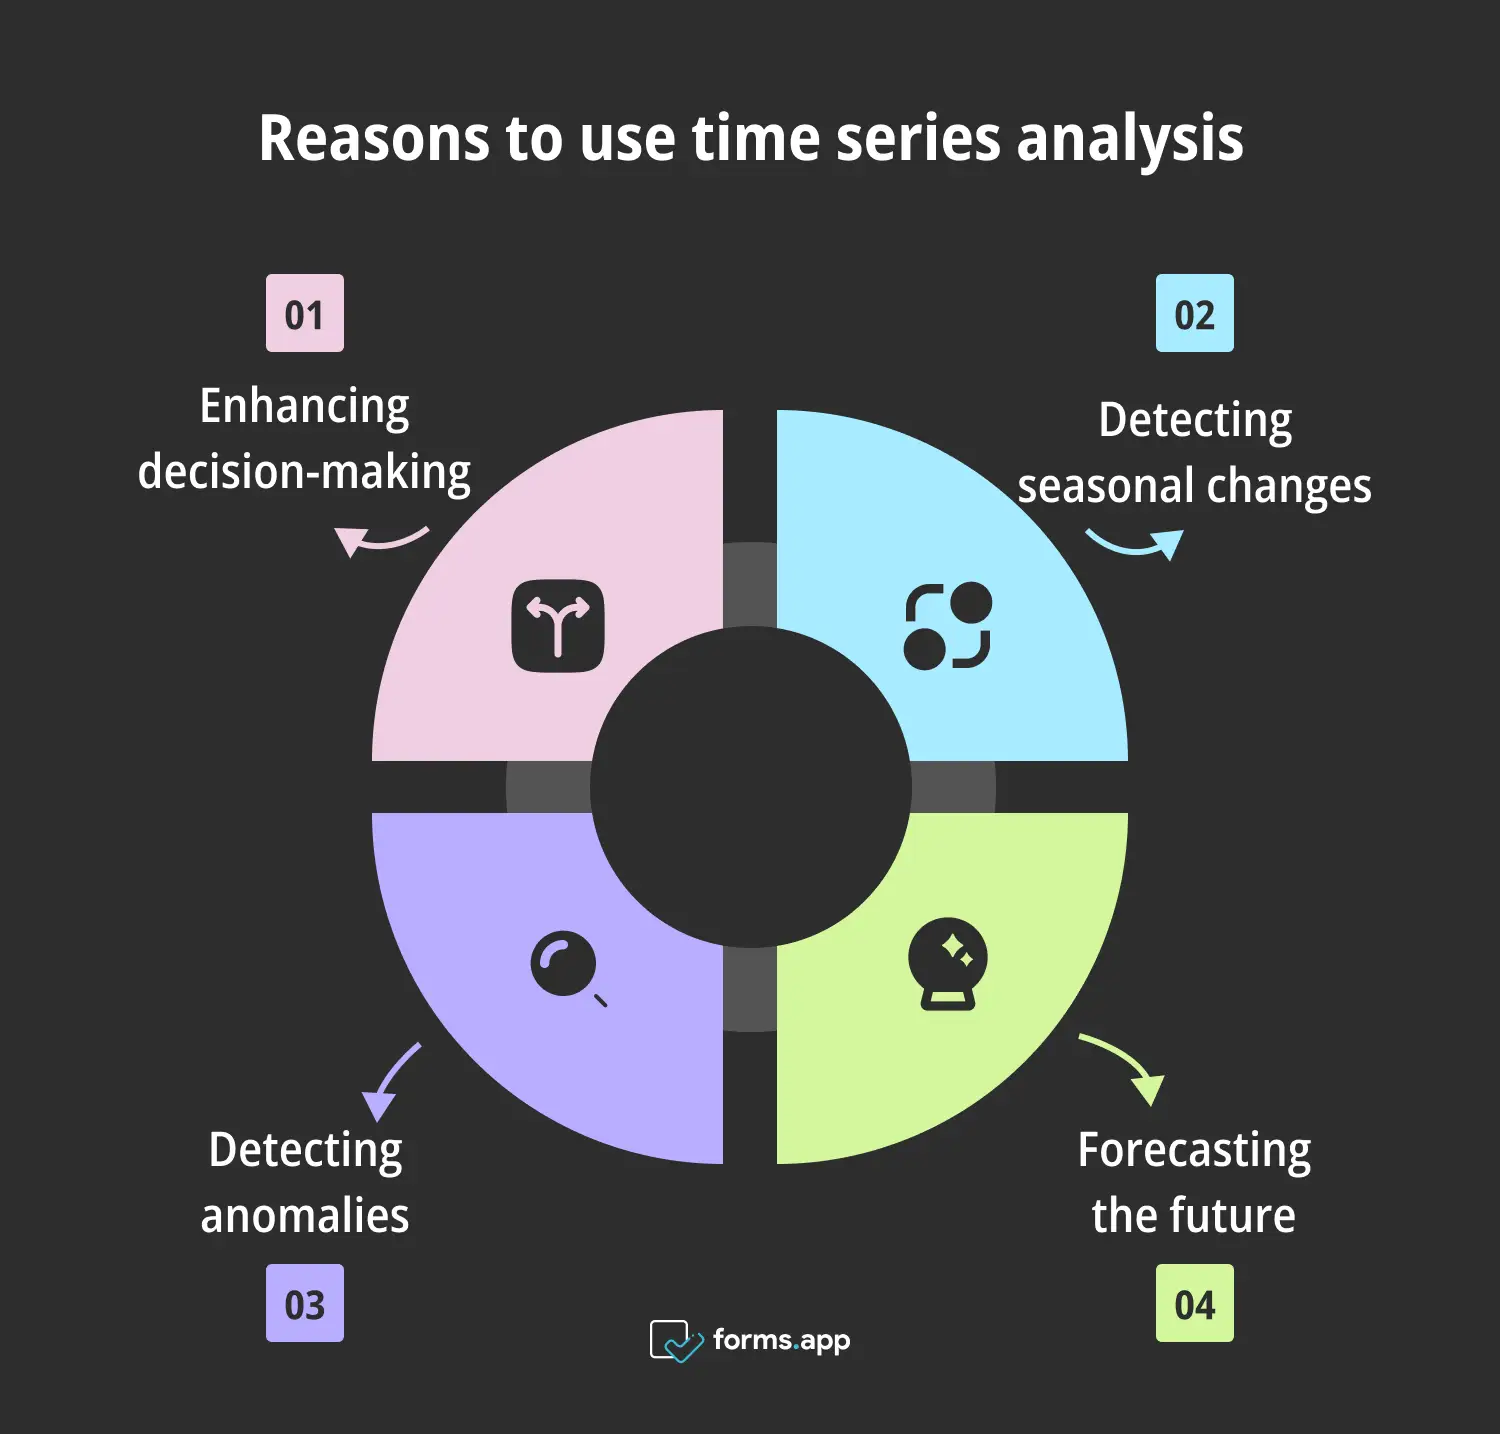
Great reasons to use time series analysis
✅Enhancing decision-making: Understanding past phenomena makes it easier to predict future trends so you can make final decisions with more confidence.
✅Detecting seasonal changes: You can use it to uncover regular seasonal changes and detect if there are irregularities. This way, you can understand seasonal demands.
✅Detecting anomalies: By detecting irregularities, you can minimize risk situations and notice the wrong course of events early.
✅Forecasting the future: The most important thing in matters such as budgeting and replenishment is to be able to make realistic forecasts. For this reason, you cannot find any other perfect type of analysis than time series analysis for forecasting because it examines time as the main variable.
Time series analysis types
The data in time series analysis consists of large datasets that can contain many different variables. This often requires refinement with more complex methods. There are many different methods, but you cannot use all of them because you need to choose according to your purpose. Otherwise, even if you perform time series analysis correctly, you will reach inaccurate results due to errors in modeling.
Here are some analysis types of time series you can use:
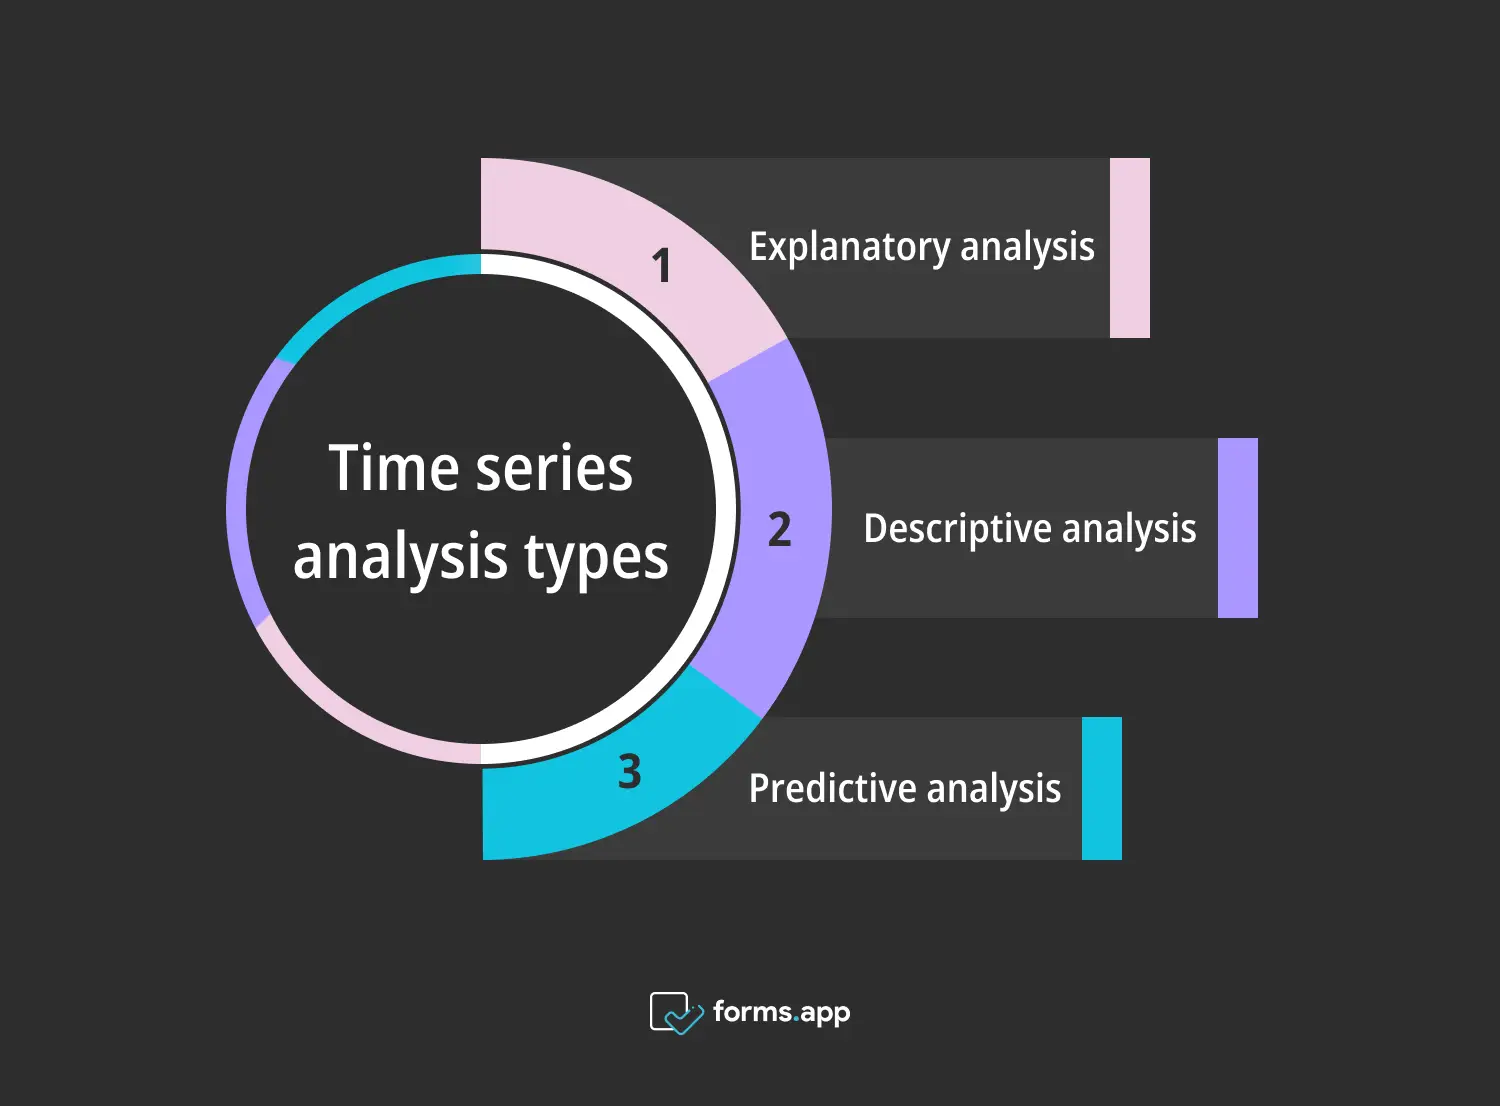
Types of time series analysis
1. Explanatory analysis
It is used to learn more about observed patterns. It aims to answer a situation as to why it occurred at that time. It is used to explain the underlying reasons for observed patterns in time series analysis. For example, it is used to reveal the reason for trend patterns or seasonal effects observed in certain months. In this way, analysis models produce more comprehensible outputs.
2. Descriptive analysis
This analysis, which describes any situation or problem, is used in time series analysis to describe exactly what the past situations were. In time series analysis, it is used to summarize data results and classify them if necessary. It provides a better understanding of historical data and forms a step towards more complex analyses.
3. Predictive analysis
It is an analysis used to make comments and predictions about the future, usually based on historical data using machine learning. When used with the inputs of descriptive analysis, it allows for the distinguishing of variables and patterns more easily and the production of values accordingly. Especially when supported by techniques such as ARIMA, it leads to an effective decision-making process for businesses.
Time series components
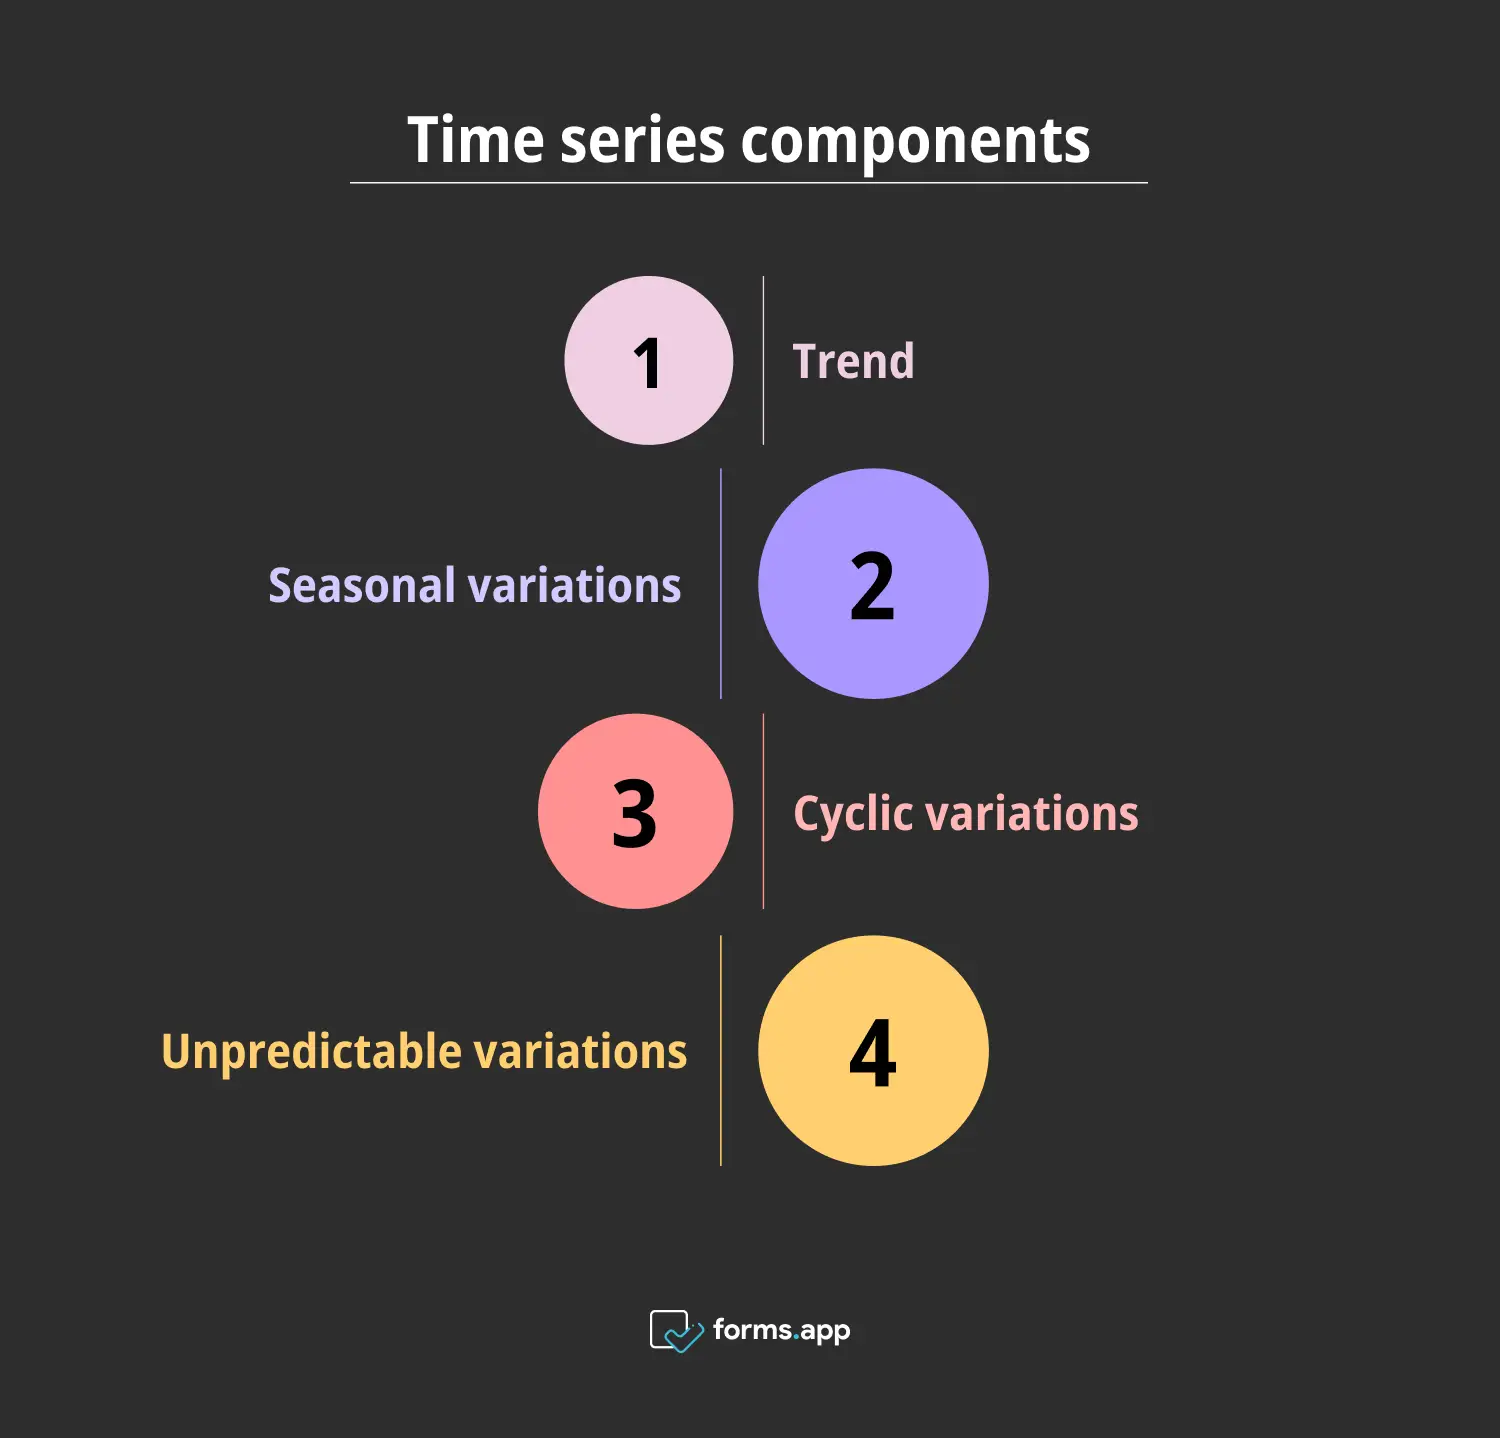
To understand time series analysis, you need to understand its components. These components make it easier to classify the data, allowing you to get information more easily and, therefore, make more accurate predictions. The four main components of the analysis are the trend, seasonal variations(seasonality), cyclic variations, and unpredictable variations(irregulars).
Components of time series
- Trend: It shows the general direction in which data is moving and generally excludes short-term fluctuations. In graphs, this can be represented as an upward, downward, or straight line.
- Seasonal variations: Although its name is seasonal, it refers to seasonal trends and patterns at daily, weekly, monthly, and annual intervals. What is meant by season here are external factors such as weather conditions and public holidays during a certain period.
- Cyclic variations: Cyclic variations are like longer-term, unpredictable versions of seasonal patterns. They are usually associated with economic cycles and refer to tracking of commercial situations such as stock markets, inflation, etc.
- Unpredictable variations: Unpredictable variations refer to random fluctuations that occur outside the course of the natural order as a result of an unexpected external factor, such as a natural disaster. These are classified in data processing but are not used in future predictions.
Examples of the time series analysis
Time series analysis is a robust method used in many different disciplines, from scientific research to economic research, education, health, and so on. The reason why this method is so popular is that it explains the situations that change over time very well. In other words, due to this feature, it is widely used in areas that require prediction, such as weather or stock markets. Now let's look at some examples of time series analysis here:
Rainfall measurements
A meteorological institution has studied the rainfall patterns of a certain region for the last fifty years. Their aim is to make agricultural improvement and planning. For this, they started to do a time series analysis.
- First, they examined the general precipitation trend in the fifty-year period. Accordingly, they found out the climate of the region and observed if there was a climate change.
- They then researched seasonal variables according to months and seasons. This allowed them to understand which months were rainy and which were dry and to plan crop farming accordingly.
- Then, they noticed abnormal rainfall patterns in some years. They thought these might be irregularities from that period, such as ocean currents or sudden climate changes. So, they noted these irregularities as a possibility in future planning.
- Finally, they prepared a model and an information table showing the rainfall regime for the coming years. They then presented this to the authorized institutions, allowing them to develop agricultural policies.
Stock prices
A financial consultant analyzes the daily closing prices of a company's stock over the last ten years. Their aim is to understand past patterns and produce investment strategies.
- First of all, the stock price was examined over a ten-year period, and it turned out that the data showed a stable trend.
- Later, it was observed that there were decreases in some periods and increases in other periods. It was thought that these could be due to factors such as holidays, hot days, etc.
- Then, the economic situation of the country and the company was examined, and the cyclical patterns in which the market experienced recession emerged.
- Ultimately, anomalous patterns were eliminated, and a solid long-term investment plan was produced using time series forecasting methods.
Time series techniques
You can use modeling techniques for time series analysis to reflect data results more effectively. Since this is necessary to produce more precise insights, it is best to utilize them. Roughly four techniques will be discussed here:
Techniques of time series
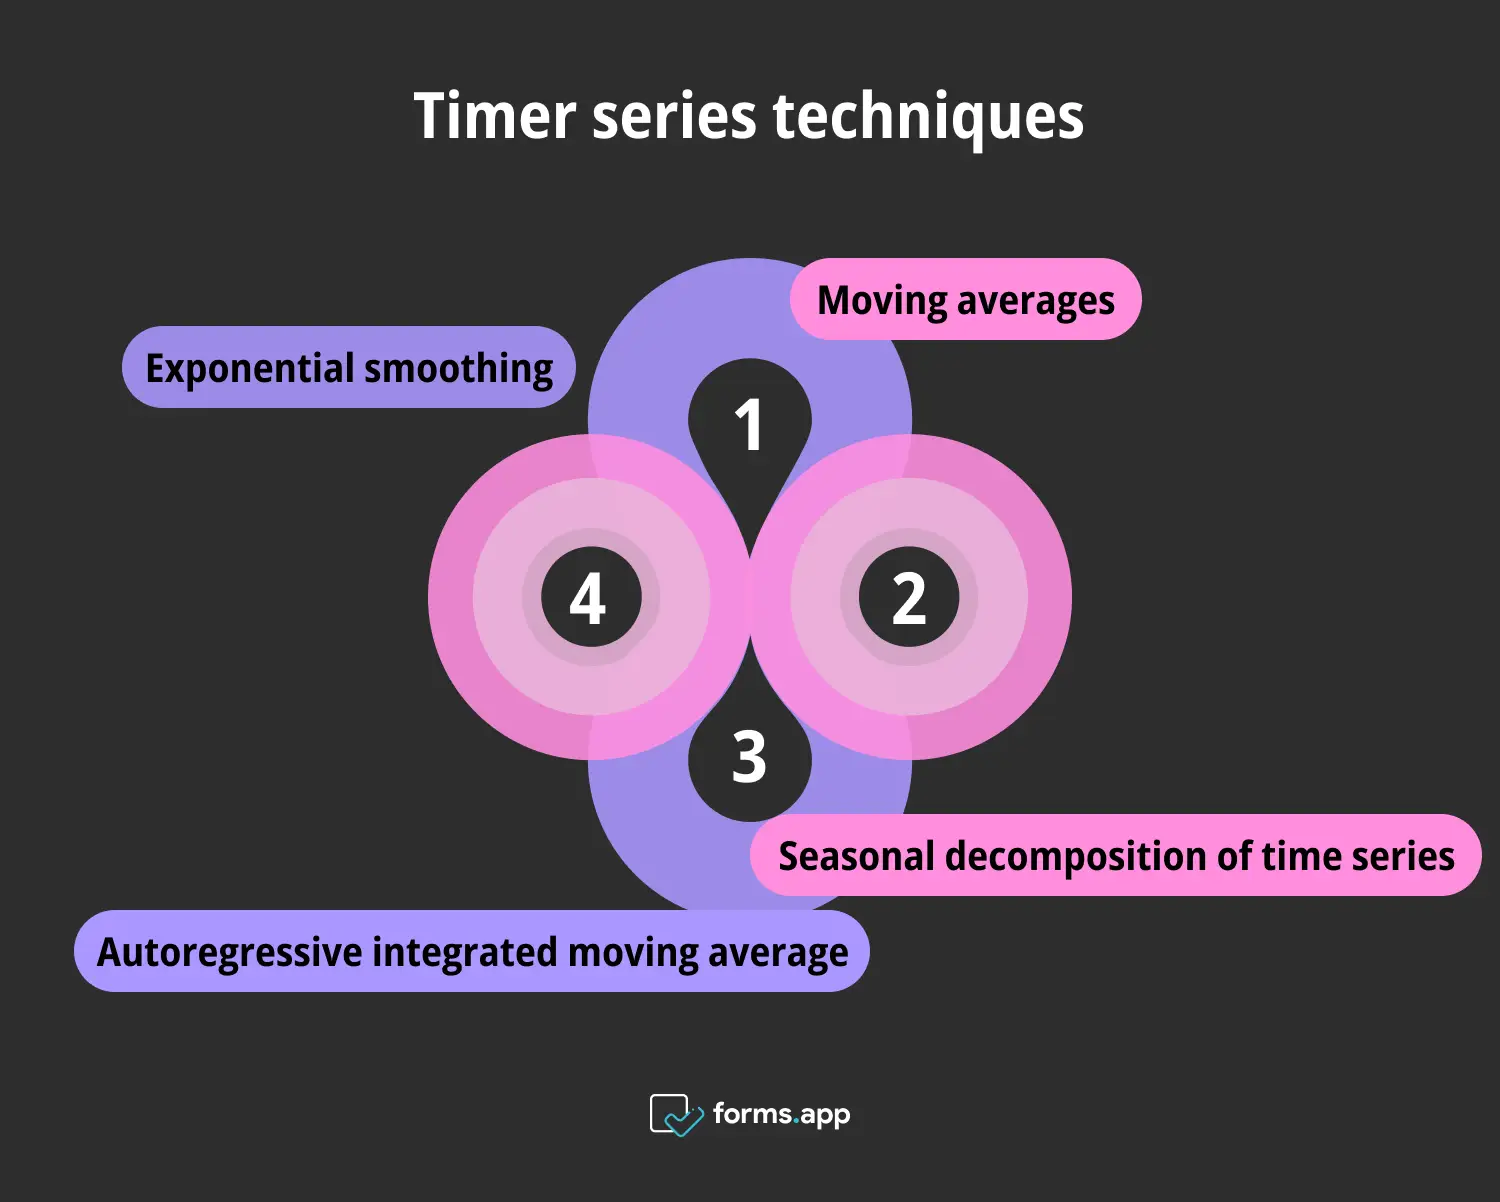
💡Exponential smoothing: This method is used to format data for shorter-term predictions. Therefore, recent data points are more important than the older ones. With this method, you can reach precise and consistent results, especially about trends and seasonal varieties. There is a more complex technique called Holt Winter’s forecasting, also known as triple exponential smoothing, which you can use to make short- or medium-term forecasts.
💡Moving averages: This method is used to highlight trends by reducing fluctuations in data. It involves calculating the average of a set number of consecutive data points and doing this repeatedly to calculate the overall average. With this method, you can eliminate unwanted information in the data and emphasize recent data.
💡Autoregressive integrated moving average (ARIMA): The ARIMA model is a statistical technique that combines three components(AR, I, and MA). The AR component examines the dependencies to model the data. The I component eliminates trends or seasonal variations and makes the data stationary. The MA component reveals the pattern and completes the modeling.
💡Seasonal decomposition of time series (STL): The STL technique reduces the time series analysis components to three: trend, seasonal variety, and noise. It separates seasonal changes from other components for better analysis. Thus, it allows you to understand situations with complex seasonal factors.
Frequently asked questions about the time series analysis
A statistical technique like time series analysis needs to be explained in detail, but this article focuses on the key points. Accordingly, you can find the critical points you are curious about in the frequently asked questions below.
There are roughly five steps in time series analysis.
Step 1 is data collection, in which you gather data and organize it for analysis.
Step 2 is data analysis, in which you perform an exploratory analysis to find patterns.
Step 3 is decomposition, in which you divide four components of a time series.
Step 4 is model selection, in which you choose to represent your findings.
Step 5 is validation, in which you evaluate the results and make plans for the future.
The four components of time series analysis are trends, seasonal variations, cyclic variations, and unpredictable variations. The trend is the general direction in which the data moves over an extended period. Seasonal variations are consistent, repeating patterns or changes that occur at specific intervals, such as monthly or seasonal. Cyclic variations are long-term fluctuations or cycles in the data, typically linked to economic or business cycles. Unpredictable variations are random, irregular changes in the data outside of pattern relationships.
While both time-series and regression analyses are statistical techniques of data analysis, their application area and purposes differ in context. The data source of time series analysis consists of data collected at certain time intervals. Its purpose is to reveal patterns and changes over time.
On the other hand, regression analyzes the relationship between a dependent variable and one or more independent variables to predict or explain an outcome. Time series data is sequential and dependent on time and is widely used in economics, weather forecasting, and marketing. In contrast, regression data can either be cross-sectional or longitudinal in nature and is extensively used in areas such as marketing, finance, and healthcare to assess relationships.
Conclusion
All in all, time series analysis is a unique statistical tool with a wide range of applications and consistent results. With this technique, businesses gain information about past situations, which sheds light on future problems.
The table of contents of this article is as follows: The article started with the three Ws (what, when, why) about time series analysis in general terms. Then, the types of analysis, components, usage examples, and techniques were explained to you so that you can learn the importance of time series analysis. In light of all this information, you are now able to use this analysis for your business or organization and get actionable insights.
Atakan is a content writer at forms.app. He likes to research various fields like history, sociology, and psychology. He knows English and Korean. His expertise lies in data analysis, data types, and methods.