When crucial business choices are based on survey results from market research, you should be sure the information you employ is accurate and trustworthy. The margin of error in your survey will tell you how close you are to being entirely representative, even though survey findings can't be so accurate all the time.
Researchers utilize the margin of error to give extra information that aids in interpreting their findings and better understanding the study's methodology. This article will explain the margin of error meaning, how to find the margin of error, and the margin of error formula with all details.
What is the margin of error?
The margin of error is the error level in survey findings using simple random samples. It provides information on how closely your survey results will likely represent the opinions of the general community.

The definition of the margin of error
It is less likely to depend on survey results with a more significant margin of error since there is less assurance that the results accurately represent the population. It is an essential tool in market research since it shows the confidence the researchers should have in the information gathered through surveys.
A confidence interval interprets a survey's estimate of a population feature clearer. It is the degree of unpredictable behavior with a particular statistic. The survey's findings should generally be within a smaller confidence interval. On the other hand, more significant confidence intervals suggest that the survey estimates may be further from the overall population's values.
How to calculate the margin of error
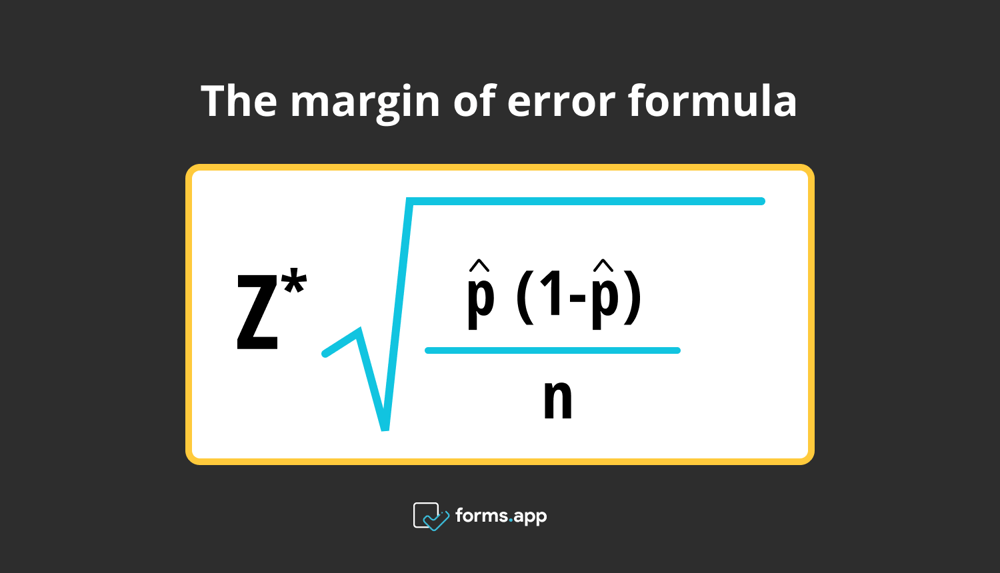
Proportions and percentages are regularly used in survey results. In statistics, multiplying a critical value by a standard error is a common method for calculating margins of error and confidence intervals. Here is the margin of error formula:

The margin of error formula
Z * √((p * (1 – p)) / n)
- Z* is the Z* value for your chosen confidence level.
- p is the sample proportion
- n is the size of the sample.
The percentage of the sample that possesses the trait you are interested in is known as the sample proportion. Since it's a decimal number denoting a percentage, you may express it in hundredths when conducting the math. For a 7% sample proportion, it would be 0.07.
Below are the steps on how to calculate the margin of error:
1 - First, identify the important value. Either a t- or a z- score is the critical value. Use a t-score instead of a small size (under 30) or when you are unsure about the population standard deviation in general. If not, use a z-score.
2 - Then, find the standard deviation or standard error in step two. Therefore, even though they are essentially the same thing, standard deviation calculation requires knowledge of your total population's characteristics. If not, figure out the standard error.
3 - Finally, add the standard deviation or standard error from step 2 to the crucial value from step 1 in step 3.
You can calculate the margin of error by hand using the formula or the margin of error using a margin of error calculator below:
3 margin of error calculation examples
In a confidence interval, the range of values below and above the sample statistic is the margin of error. A technique to display the level of uncertainty associated with a given statistic is through the confidence interval. Here 3 margin of error calculation examples:
1 - When choosing between number 1 and number 2 for a new product, consider that your target market has 200000 potential buyers. 200 of those possible clients will be selected for a survey. Your sample size is this. When you receive the results, you will see that number 1 is preferred by 70% of respondents. A confidence level should be entered into the calculator so the result is ±6.7.
Your level of confidence that the sample correctly captures the sentiments of the entire population is shown by this number. Researchers frequently set it as 90%, 95%, or 99%. To calculate the error, enter the figures from this example. The calculator gives you a 7% error margin.
2 - Let's say you are researching a bird found in Africa; let's say there are 10000 potential birds. 100 of these possible birds will be examined. That's it for your sample size. Your confidence level is %90. The calculator we give you above gives you a %8.
3 - A survey is conducted to estimate the proportion of university students who own a pet. The survey sample size is 500 students, showing that 60% of the sample owns a pet. Assuming a 90% confidence level, it would be about +4/-4 percentage points. This means that the proportion of university students who own a pet is likely between 55.6% and 64.4%.
Frequently asked questions about the margin of error
A data set's margin of error directly impacts the researcher's confidence level in the study's findings. A wider margin of error in your study findings or survey findings typically indicates that the data sets may not be accurate. Here are frequently asked questions about the margin of error.
The sample size and margin of error are related to each other. The margin of error often decreases when the sample size is increased. This is because estimates get more precise as the sample size grows since the sample is increasingly typical of the population.
For instance, a limited sample size might result in a high margin of error and inaccurate estimations. In contrast, if the sample size is smaller, the margin of error would be more considerable, resulting in more accurate assessments than is necessary.
Confidence interval and margin of error offer details on the accuracy of a statistical estimate, but it is expressed as a percentage. It is unique to polls and surveys, whereas the confidence interval is defined as a range of values and can be used to describe the accuracy of various statistical estimates.
The margin of error describes the level of error anticipated in a statistical survey or poll owing to sample variability. On the other hand, the confidence interval is the range of values surrounding a statistical estimate that, to a given degree of certainty, is likely to include the actual value of the population parameter.
The range of acceptable error depends on the measurement's context and goal. Depending on the industry or profession, a small margin of error would be necessary. Examples include scientific research and financial analysis. A few percent of mistakes may be acceptable in other circumstances. The stakeholders involved and the effects of errors ultimately decide the acceptable margin of error.
Conclusion
In conclusion, the margin of error for a survey indicates how close the findings should be to the actual population value. It considers random sampling error. It can not account for phrasing biases, unrepresentative samples, or challenges that exclude specific categories of respondents.
This article has explained the definition of the margin of error and its examples and formula. It would help to consider the differences between your sample data and the target audience because research is focused on gathering samples from a population of interest. The best approach to do is to determine the margin of error of your observation.
forms.app, your free form builder
- Unlimited views
- Unlimited questions
- Unlimited notifications


