Today’s fast-paced business world requires having the right tools to analyze problems. There are many tools and models that can help you identify root causes of issues in processes. By using them, you can visually map out potential factors contributing to the problem. They also help teams in businesses of all sizes find the areas needing improvement.
In this article, we will talk about one of these tools, the Fishbone Diagram. We will cover its definition, types, and practical applications. We will dive into when and why this tool comes in handy as well as guide you through the step-by-step process of using it. Moreover, we will explore fishbone diagram samples, their advantages and drawbacks, and answer some common queries.
What is a Fishbone diagram?
The Fishbone Diagram, also known as the Ishikawa Diagram or cause-and-effect diagram, is a visual tool used to identify potential causes of a specific problem.
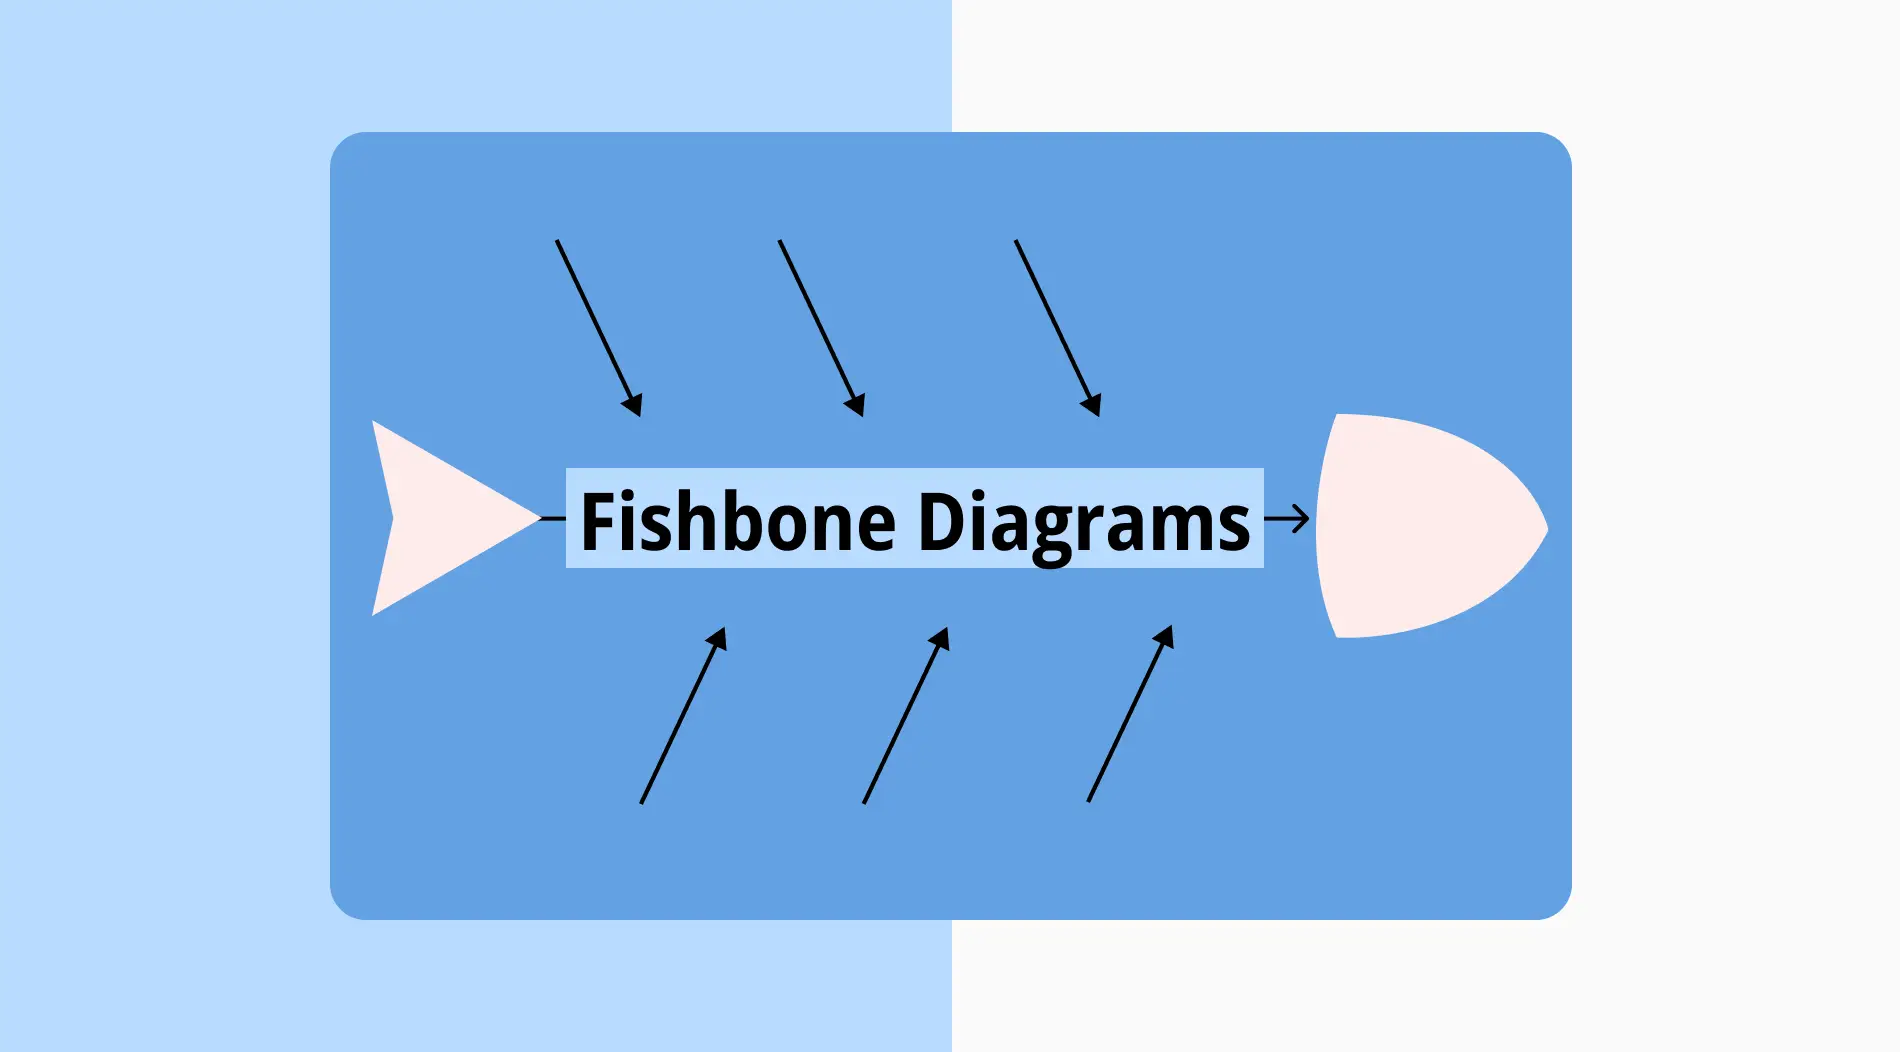
The name fishbone diagram comes from its structure, which is similar to the fish skeleton. The head of the fish represents the problem. The bones branching out from the spine represent different categories of potential issues.
Dr. Kaoru Ishikawa, a Japanese quality control expert, developed this model in the 1960s (hence the name). It has become a vital tool in quality management and problem-solving practices across industries. It is particularly useful in brainstorming sessions, where your team can systematically identify and organize potential causes of a problem. With the Fishbone Diagram, you can break down the problem into manageable categories.
Types of Fishbone Diagrams
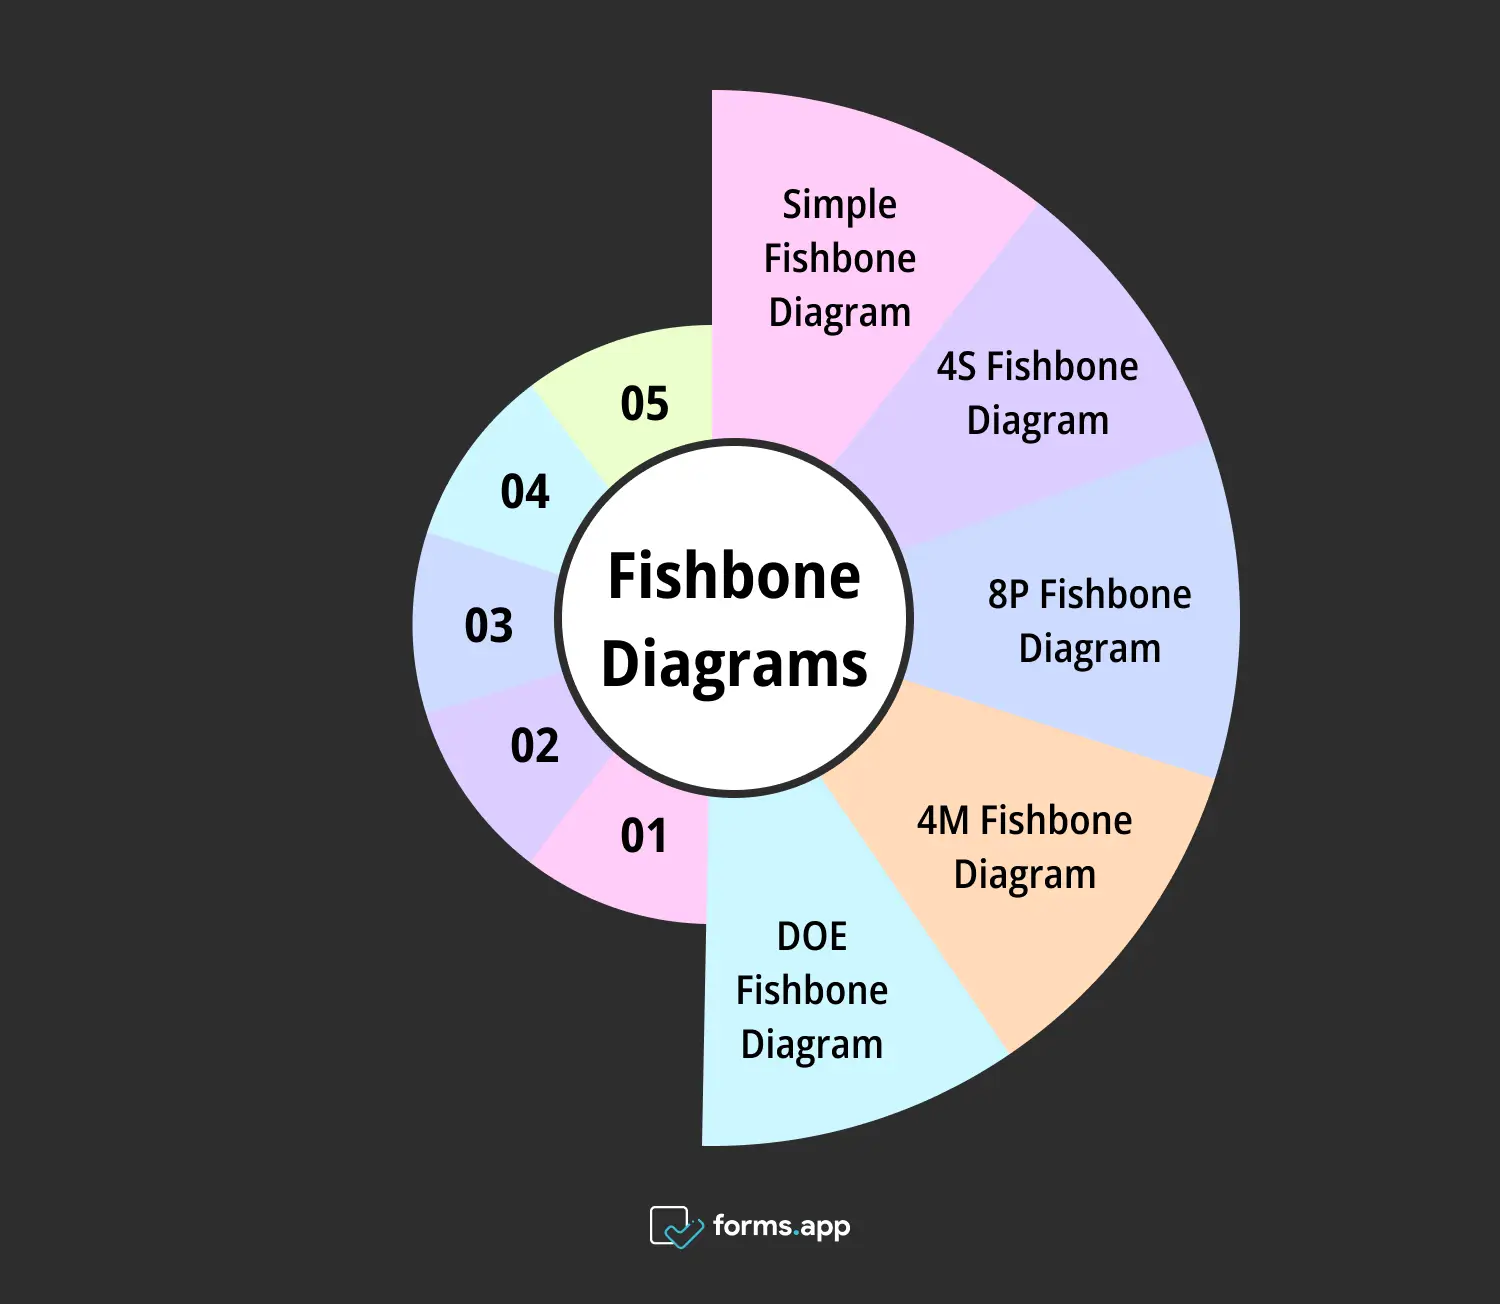
Over the years, various types of Fishbone diagrams have emerged for specific problems and industries. Each type addresses and categorizes potential causes in a way that best suits the context. In this section, let's take a look at some of the most common and effective Fishbone diagram types:

Fishbone diagram types
1- Simple Fishbone Diagram
The Simple Fishbone Diagram is the standard version of the Fishbone diagram. You can typically use it for basic root cause analysis. It identifies potential causes of a problem without categorizing them into specific areas. This type is ideal for small teams or individual users who need to quickly brainstorm. You can also visually organize the potential causes of an issue.
💡Tip: Its simplicity makes it a great starting point for beginners in root cause analysis.
2- 4S Fishbone Diagram
The 4S Fishbone Diagram is common in service industries to identify and categorize the causes of a problem into four key areas. These are Surroundings, Suppliers, Systems and Skills. This type is especially useful for analyzing issues related to service operations, such as logistics, customer services, and supplier management.
💡Tip: By focusing on these categories, your teams can systematically investigate and address the root causes of service delivery problems.
3- 8P Fishbone Diagram
The 8P Fishbone Diagram is good for marketing and service sectors. It categorizes causes into Product, Price, Place, Promotion, People, Process, Physical Evidence, and Performance. You can use this type to analyze various elements of the marketing mix or service delivery. It also helps businesses identify areas for improvement.
💡Tip: This model ensures that you consider all aspects of your company’s offering and customer interaction when investigating issues related to market performance or service quality.
4- 4M Fishbone Diagram
The 4M Fishbone Diagram is specifically useful in manufacturing and production to categorize potential causes of a problem into four areas. These areas are:
- Man (human factors)
- Machine (equipment)
- Materials (raw materials)
- Methods (processes).
This type helps your team analyze and address issues related to production quality.
💡 Tip: By focusing on these critical categories, the 4M diagram enables a thorough investigation of factors impacting the production process.
5- DOE Fishbone Diagram
The acronym DOE stands for Design of Experiments. You can use it in statistical and experimental analysis to identify potential factors influencing an outcome. It categorizes causes related to variables and interactions in an experiment. These are Factors, Levels, Interaction, and Response. This type is essential in experimental design to ensure that you consider all potential variables.
💡 Tip: The DOE Fishbone Diagram enables precise control and optimization of experimental processes of product development.
How to create your own Fishbone diagram in 6 Steps
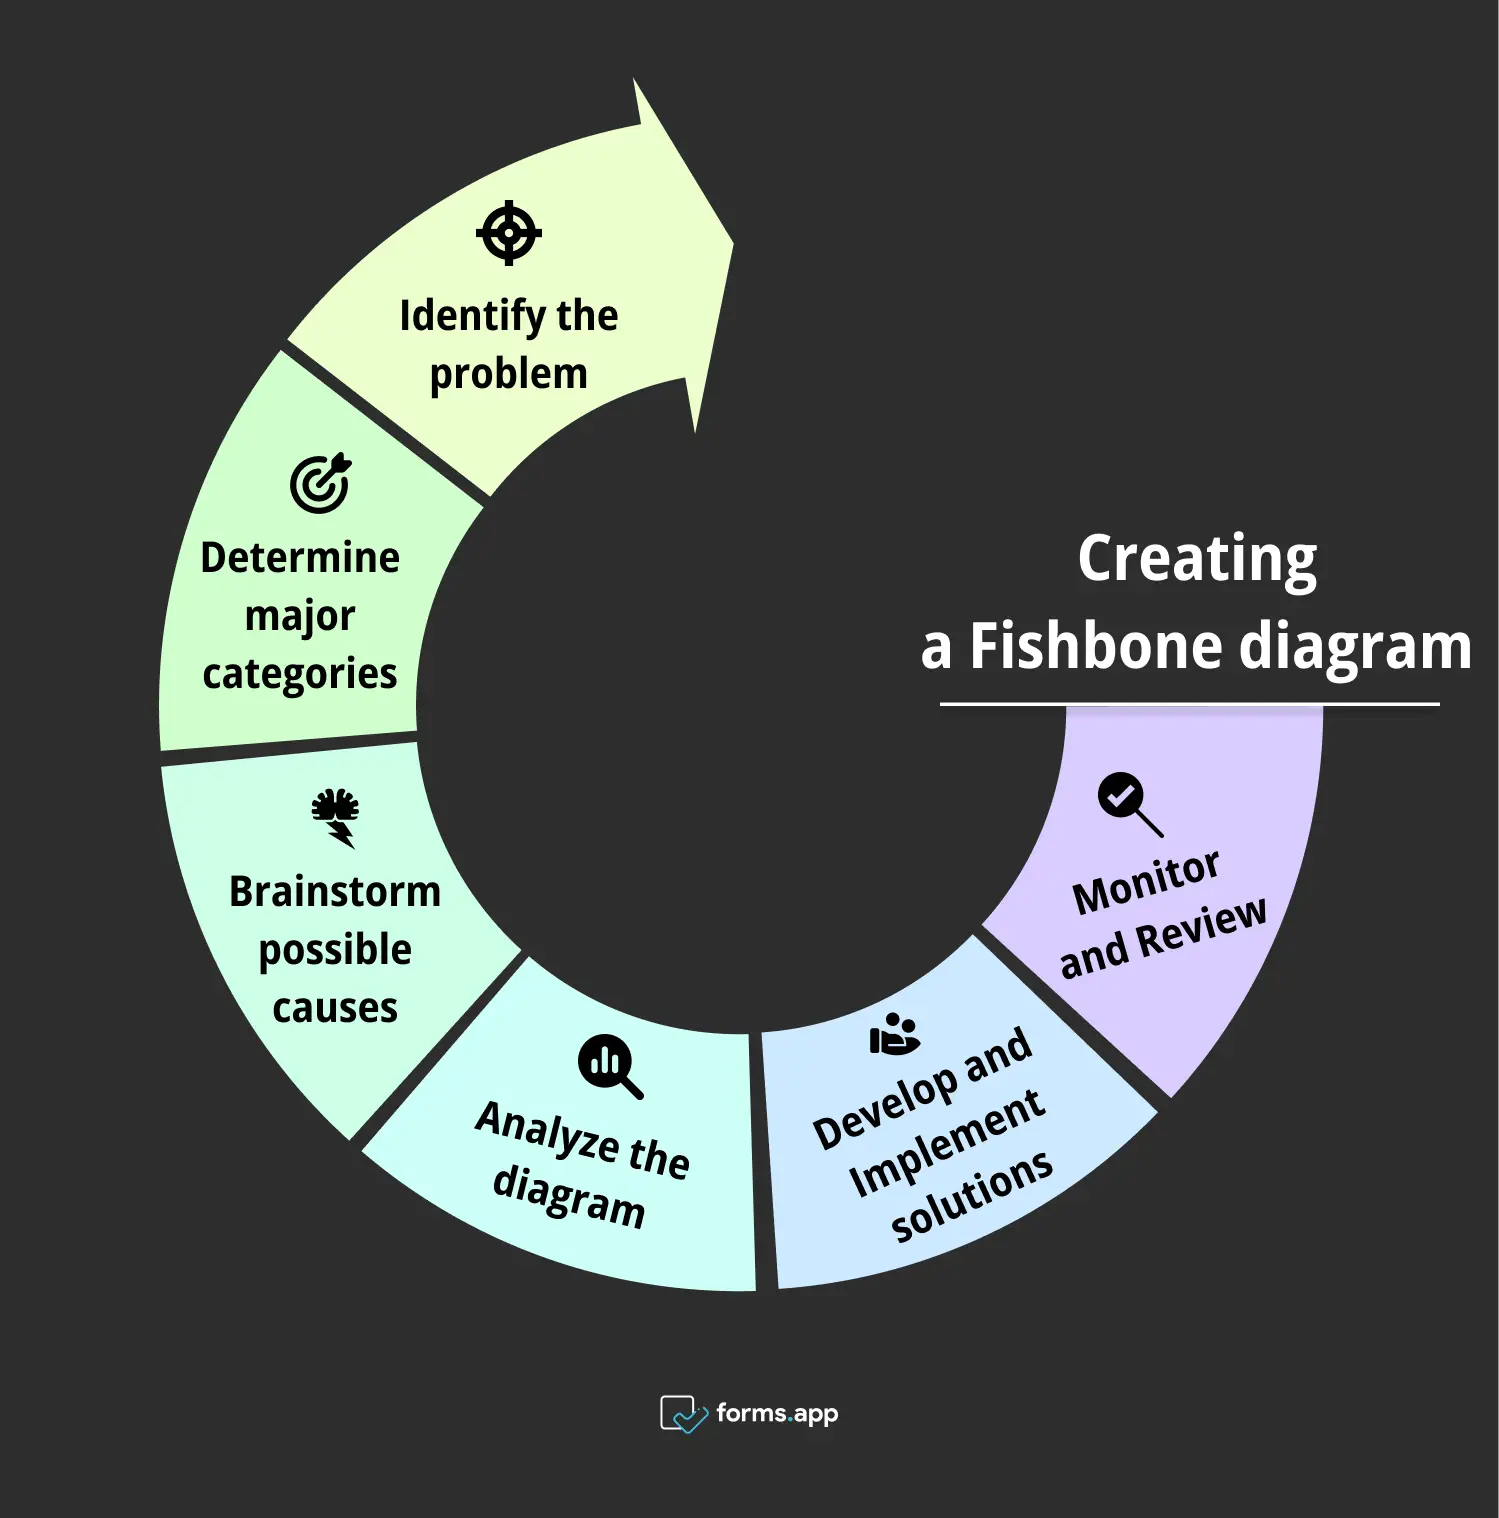
We have familiarized ourselves with the concept of the Fishbone Diagram and seen different types of the Fishbone Diagram. In this section, we will discuss which steps to take for successfully creating and implementing it in your business context. Here are 6 steps to follow:

Steps to create your own Fishbone diagram
1- Identify the problem
The first step in using the Fishbone Diagram is to define the problem you want to solve clearly. This step is crucial because a well-defined problem sets the stage for effective solutions. Gather your team and agree on the exact issue that you need to address. Select the type of fishbone diagrams you want to use.
Write the problem statement, identifying the head of the fish. Ensure that everyone understands it. This will guide the rest of the process and help focus your team’s efforts. Identify the root causes rather than being distracted with symptoms or unrelated issues.
2- Determine major categories
Next, determine the major categories of causes related to the problem. These categories act as the main branches of the Fishbone Diagram. Common categories include people, processes, equipment, materials, environment, and methods. However, you can customize the categories based on the nature of the problem and the business.
Organize potential causes into these broad categories. Your team can explore different aspects of the problem. This step helps to ensure that you consider all the relevant factors. It also provides a comprehensive framework for analysis.
3- Brainstorm possible causes
With the categories defined, your teams can begin brainstorming possible causes within each category. Encourage your team members to think creatively and consider all potential and contributing factors. As you suggest, add the causes to the relevant branches of the Fishbone Diagram.
This step is critical for identifying the underlying issues that may not be immediately apparent. Involve all team members in the brainstorming process. You can focus on diverse perspectives and uncover causes that are overlooked.
4- Analyze the diagram
Once you identify all potential causes and add them to the diagram, your team should analyze the Fishbone Diagram to determine the most likely root causes. This step involves reviewing the causes within each category and discussing their impact on the problem.
Your team may use techniques such as “5 Whys” to go deeper into each cause and identify the root cause. Focus on the most significant causes. Your team can make it their priority to develop targeted solutions to address the core issues.
5- Develop and Implement solutions
After identifying the root causes, the next step is to develop and implement solutions. This step involves brainstorming potential solutions and selecting the most effective ones. Your team should consider factors such as feasibility, cost, and impact when choosing the solutions.
Once you select the solutions, develop an action plan to implement them. Assign responsibilities, set timelines, and monitor progress to ensure that solutions effectively address the root causes. This step is crucial for turning the analysis into concrete improvements.
6- Monitor and Review
Finally, the effective solutions and results will be monitored and reviewed. This step involves tracking the impact of the implemented solutions and determining whether you have resolved the problem. If the problem continues, your team may need to revisit the Fishbone Diagram and explore additional causes or alternative solutions.
Continuous monitoring and review are essential for ensuring that you have addressed the problem fully and you sustain the improvements over time. This step also supports a culture of dynamic improvement. This way, you can apply the lessons you learned to future problem-solving efforts.
When to use a Fishbone diagram?
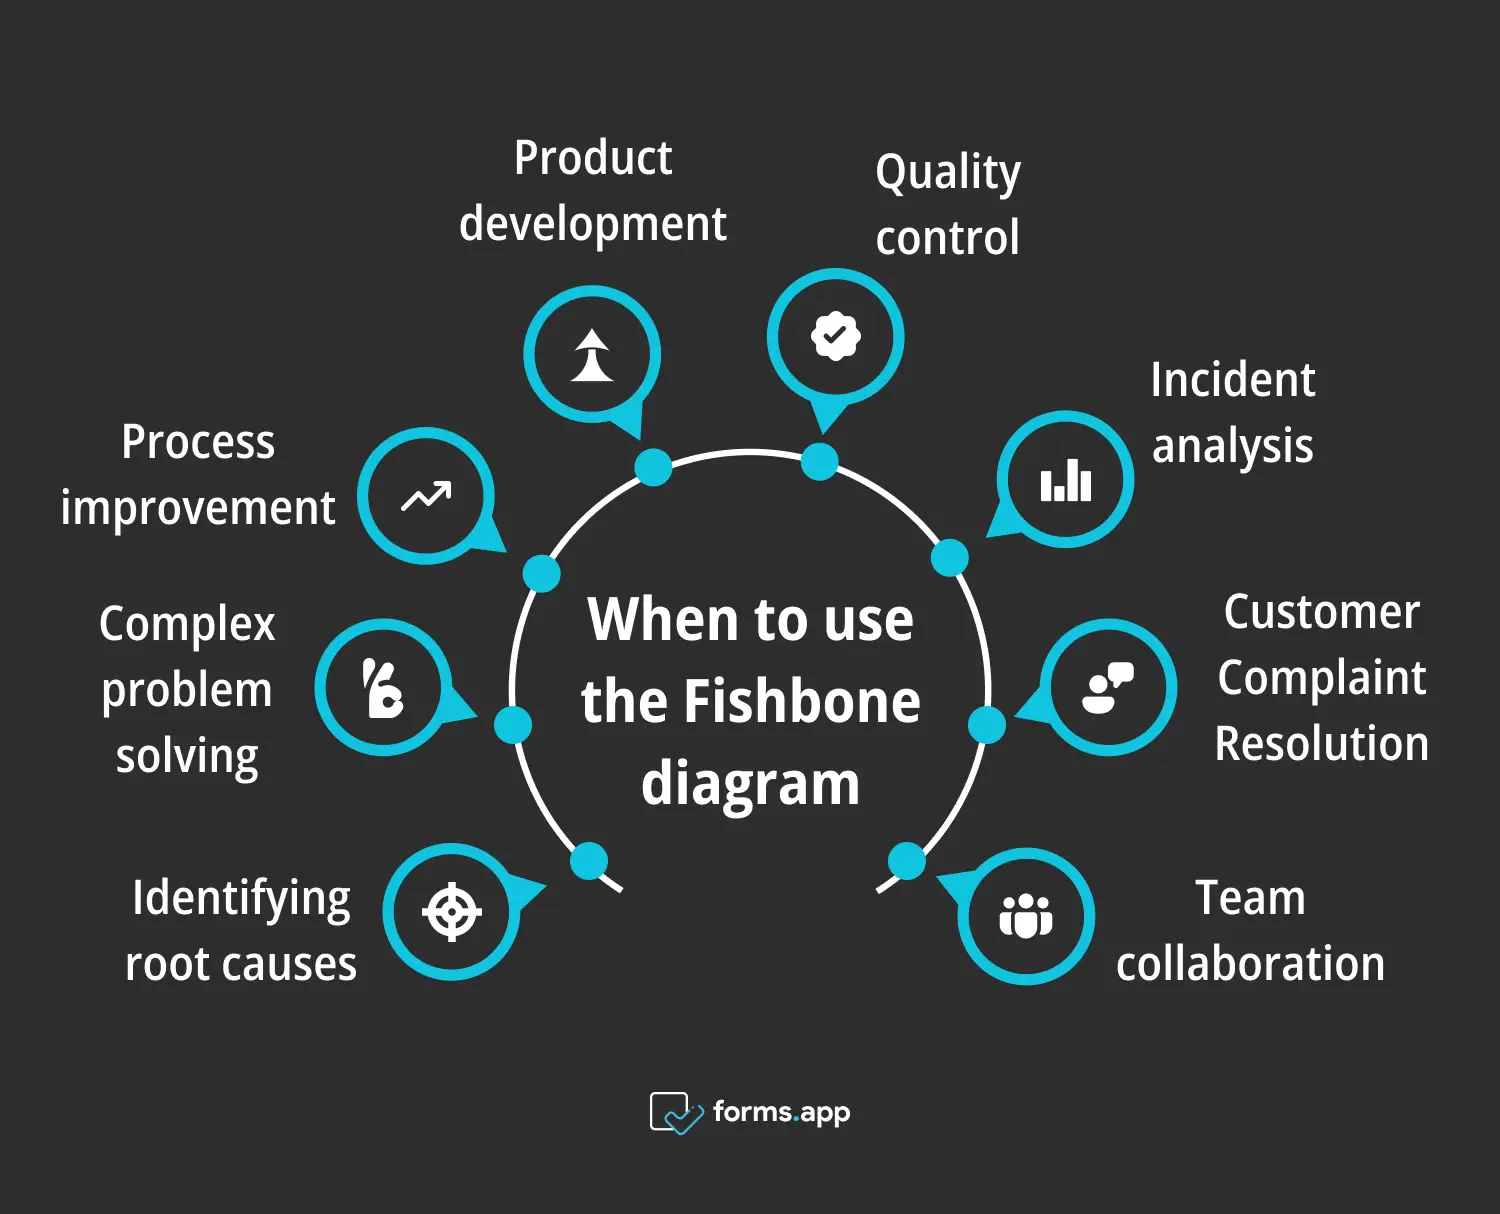
As we have seen above, there are different types of fishbone diagrams for different business contexts. In this part, we will focus on when to use the fishbone diagram and see its suitable environments. We recommend that you understand these various environments, as your business may fall under one of these categories.

Right times to use the Fishbone diagram
1. Identifying root causes
The fishbone diagram is most effective when there is a need to identify the root causes of a problem. You can visually break down the issue into categories. Your team can systematically explore all possible causes. This approach helps to avoid quick fixes that only address symptoms. It enables you to focus on the underlying issues.
2. Complex problem solving
When facing complex problems involving multiple factors, the Fishbone Diagram can help you simplify the analysis. You can organize potential causes into categories. It will become easier to see how different factors are relevant and contribute to the issue. This method is particularly useful in situations where the problem is not immediately obvious. It allows your teams to explore various angles.
3. Process improvement
The Fishbone Diagram is an excellent tool for process improvement initiatives. You can identify the causes of inefficiencies or quality issues. Your team can target specific areas for improvement. This tool is especially useful in Lean and Six Sigma projects, where eliminating waste and improving quality are key objectives.
4. Product development
In product development, you can use the Fishbone Diagram to identify potential risks and challenges early in the design process. You can also map out possible causes of defects or failures. Therefore, your teams can proactively address these issues before they become major problems. This proactive approach helps you ensure that the final product meets quality standards and customer service expectations.
5. Quality control
Quality control is another area where the Fishbone Diagram proves valuable. You can identify the root causes of quality issues. Your team members can implement targeted corrective actions. This tool is particularly useful in industries where maintaining high-quality standards is critical. These include manufacturing, healthcare, and food production. You can improve product quality, reduce waste, and enhance customer satisfaction.
6. Incident analysis
When incidents occur, such as accidents, equipment failures, or service disruptions, the Fishbone Diagram can help analyze the causes. You can explore all potential factors, identify the root causes, and implement preventive measures. This approach not only helps you resolve the immediate issue but also reduces the likelihood of recurrence of the problem.
7. Customer Complaint Resolution
When a customer complains about something, it would be wise of you to take it into consideration. By using the Fishbone Diagram, you can identify the root causes of customer dissatisfaction and implement changes to improve the overall customer experience. This tool helps you ensure that you address the complaints effectively. It leads to higher customer retention and satisfaction rates.
8. Team collaboration
The Fishbone Diagram encourages team collaboration by involving all members in the problem-solving process. You can visually identify potential causes and discuss and analyze different perspectives. This leads to a more comprehensive understanding of the issue. The collaborative approach fosters a sense of ownership and accountability in the team, as they all contribute to the solution.
7 Tools to create Fishbone diagram (+templates)
If you want to create and use a Fishbone Diagram in your business, you do not need to start from scratch. Here, we will list 7 tools. Each tool has different templates for specific purposes. They will be useful for solving the issues/problems in your processes. You can select the most suitable fishbone diagram template according to its purpose.
1- Lucidchart
Lucidchart is an online diagramming tool designed to create flowcharts. It also offers a highly customizable Fishbone diagram template that is perfect for both beginners and advanced users. This template allows users to easily drag and drop elements to identify potential causes of a problem across various categories, such as methods, machines, materials, and people.
🐟 Fishbone diagram template in Lucidchart
2- Canva
Canva is a graphic design platform that allows users to create visually appealing designs. It provides visually appealing Fishbone diagram templates ideal for users who focus on design. With the templates here, you can easily modify colors, fonts, and layout to suit your brand or project needs. The drag-and-drop editor makes it simple to add or remove branches and causes. You can include a wide variety of icons to enhance visual representation as well.
🐟 Fishbone diagram template in Canva
3- SmartDraw
SmartDraw is a diagramming software providing templates for various business and technical diagrams. It offers a Fishbone diagram template particularly useful for teams involved in Six Sigma or lean manufacturing projects. It helps users analyze cause-and-effect relationships and consider all potential factors. It has pre-populated categories and easy-to-edit branches, which you can customize to fit any specific problem.
🐟 Fishbone diagram template in SmartDraw
4-EdrawMax
EdrawMax is another comprehensive diagramming tool for diverse industries. It provides user-friendly and feature-rich templates for the Fishbone Diagram. It allows users to map out complex relationships with ease with the help of its symbols and shapes. It supports collaboration and enables multiple users to work on the same diagram simultaneously. The templates are compatible with various file formats.
🐟 Fishbone diagram template in EdrawMax
5-Creately
Creately is an online visual collaboration platform. Its Fishbone Diagram templates are simple and easy to use. It offers a clean, minimalistic layout, helping users focus on identifying the root causes of a problem. It also supports real-time collaboration and makes it ideal for teams working remotely. It also offers integration with other productivity tools, such as Confluence and Slack.
🐟 Fishbone diagram template in Creately
6- Miro
Miro is a digital whiteboard platform. It offers an interactive Fishbone Diagram that is good for brainstorming sessions and collaborative problem-solving. It can help teams quickly map out potential causes and issues, with the ability to add sticky notes, images, and comments onto the diagram. The cause and effect diagram examples are highly customizable, allowing users to adapt them to different types of analysis and projects.
🐟 Fishbone diagram template in Miro
7-Microsoft Office
Microsoft Office is a suite of productivity tools. It also provides a Fishbone diagram template through its Visio software. It is suitable for users who are already familiar with the Microsoft tools. The Visio template is compatible with other Microsoft Office tools. This enables users to easily insert diagrams into Word documents, Excel sheets, and PowerPoint presentations.
🐟 Fishbone diagram template in Microsoft Visio
Advantages and Disadvantages of Fishbone diagram
The Fishbone Diagram is a versatile tool to help you identify the root causes of problems in your business processes. We have briefly touched upon the advantages of this diagram throughout the article. However, like many other models, this diagram has some pitfalls that users need to consider before applying. Let’s look at its advantages and disadvantages in detail:
Advantages
1- Structured problem analysis
The Fishbone Diagram provides a structured approach to problem analysis, ensuring that all potential causes are systematically explored. This method helps teams avoid jumping to conclusions or focusing solely on the most obvious causes. By organizing potential causes into categories, the Fishbone Diagram promotes a comprehensive analysis that considers all relevant factors.
2- Visual representation
One of the key advantages of the Fishbone Diagram is its visual representation of complex problems. The diagram’s fishbone structure makes it easy to see the relationship between the problem and its potential causes. This visual format helps teams quickly identify patterns and connections that might not be immediately apparent in a written analysis.
3- Encourages collaboration
The Fishbone Diagram encourages collaboration by involving all team members in the problem-solving process. By engaging the entire team in brainstorming potential causes, the diagram ensures that diverse perspectives are considered. This collaborative approach not only leads to a more comprehensive analysis but also fosters a sense of ownership and accountability among team members.
4- Identifies root causes
The primary purpose of the Fishbone Diagram is to identify root causes rather than just addressing symptoms. By systematically exploring all potential causes, the diagram helps teams drill down to the underlying issues that need to be addressed. This focus on root causes leads to more effective and sustainable solutions.
5- Versatility across industries
The Fishbone Diagram is a versatile tool that can be used across a wide range of industries and applications. Whether in manufacturing, healthcare, education, or service industries, the diagram’s structured approach to problem-solving is universally applicable. Its ability to adapt to different types of problems and industries makes it a valuable tool for organizations of all sizes.
6- Easy to use and implement
The Fishbone Diagram is easy to use and implement, making it accessible to teams with varying levels of experience and expertise. The diagram’s simple structure allows teams to quickly organize and analyze potential causes without the need for extensive training or technical knowledge.
Disadvantages
1- Oversimplifies complex problems
One major drawback of the Fishbone diagram is that it can oversimplify complex problems. While it helps visualize potential causes, it may not fully capture the intricate interrelationships between different factors. In complex systems, causes are often interconnected, and isolating them in a linear, branch-like format might miss these nuanced connections.
2- Time-consuming and resource-intensive
Creating a comprehensive Fishbone diagram can be time-consuming and resource-intensive, especially for large or multifaceted issues. Gathering input from all relevant stakeholders, brainstorming potential causes, and categorizing them into meaningful groups require significant effort. Additionally, if the problem is highly complex, the diagram may become overly detailed and difficult to manage.
3- Potential for bias and subjectivity
The Fishbone diagram relies heavily on the input and perspectives of the individuals or teams involved in the analysis. This reliance can introduce bias and subjectivity into the problem-solving process. If team members have preconceived notions about the causes of an issue, they may inadvertently focus on certain factors while neglecting others.
Frequently asked questions about the Fishbone diagrams
Last but not least, let’s answer some of the most frequently asked questions about the Fishbone diagrams. Understanding these common queries will help you better comprehend the subject. Thus, you will be able to use the fishbone diagrams easily in your business contexts.
The "Whys" of the Fishbone Diagram refers to the process of asking "Why?" multiple times to drill down to the root cause of a problem. This technique, often called the "5 Whys," helps teams explore the underlying reasons for each identified cause, ultimately leading to a deeper understanding of the root cause that needs to be addressed.
The categories of a Fishbone Diagram depend on the type and purpose. However, it generally includes factors such as People, Processes, Equipment, Materials, Environment, and Methods. These categories serve as the main branches of the diagram, under which potential causes of the problem are listed. The categories help organize the analysis and ensure that all relevant factors are considered when identifying the root causes of a problem.
The steps for creating a Fishbone Diagram include:
- Identify the problem
- Determine major categories of causes
- Brainstorm possible causes within each category
- Analyze the diagram to identify the root causes
- Develop and implement solutions and
- Monitor and review the effectiveness of the solutions
This systematic process helps teams thoroughly analyze the problem and develop effective solutions.
The elements of the Fishbone Diagram include the main problem (represented as the "head" of the fish), the major categories of causes (represented as the "bones" branching off the spine), and the specific causes listed under each category. These elements work together to visually represent the relationship between the problem and its potential causes, facilitating a comprehensive analysis of the issue.
The 5Ps of the Fishbone Diagram refer to People, Processes, Policies, Procedures, and Plants (equipment). These categories are commonly used in the diagram to organize potential causes of a problem. The 5Ps help teams systematically explore different aspects of the problem, ensuring that all relevant factors are considered when identifying root causes and developing solutions.
Key points to take away
In conclusion, the Fishbone Diagram is a powerful tool for root cause analysis, providing a structured, visual approach to problem-solving. You can organize potential causes into categories. It promotes comprehensive analysis and helps your teams identify the underlying issues needing attention. The diagram is versatile, easy to use, and valuable across various industries.
In this article, we have described the Fishbone Diagram, its definition, types, and templates. We have also seen its suitable contexts, advantages and disadvantages. We have answered frequently asked questions to provide a deeper understanding of this problem-solving tool. You can use our online surveys to populate fishbones more effectively. Regardless of your industry, it can help you address problems and improve your operations.
- What is a Fishbone diagram?
- Types of Fishbone Diagrams
- How to create your own Fishbone diagram in 6 Steps
- When to use a Fishbone diagram?
- 7 Tools to create Fishbone diagram (+templates)
- Advantages and Disadvantages of Fishbone diagram
- Frequently asked questions about the Fishbone diagrams
- Key points to take away
forms.app, your free form builder
- Unlimited views
- Unlimited questions
- Unlimited notifications


