In this data-driven world, organizations increasingly rely on tools to visually represent complex data in actionable insights. Various tools exist, each serving distinct needs—business intelligence, interactive charting, and collaborative data analysis. Multiple tools help teams explore and visualize data in accessible ways, from self-service dashboards to AI-powered insights and extensive customizations.
Choosing the right tool can increase the efficiency of data interpretation, foster collaboration, and support better decision-making, regardless of team size or technical proficiency. This essay will provide you with 10 data visualization tools with free and paid options. Without further ado, let’s start with the importance of data visualization.
Elements to check while choosing the best data visualization tool
You will need a data visualization tool that speaks your team's language, connects with your audience, and drives home a proper storyline hidden in your data. To help make such a decision, some key pointers were identified for making the right considerations when evaluating tools for data visualization:
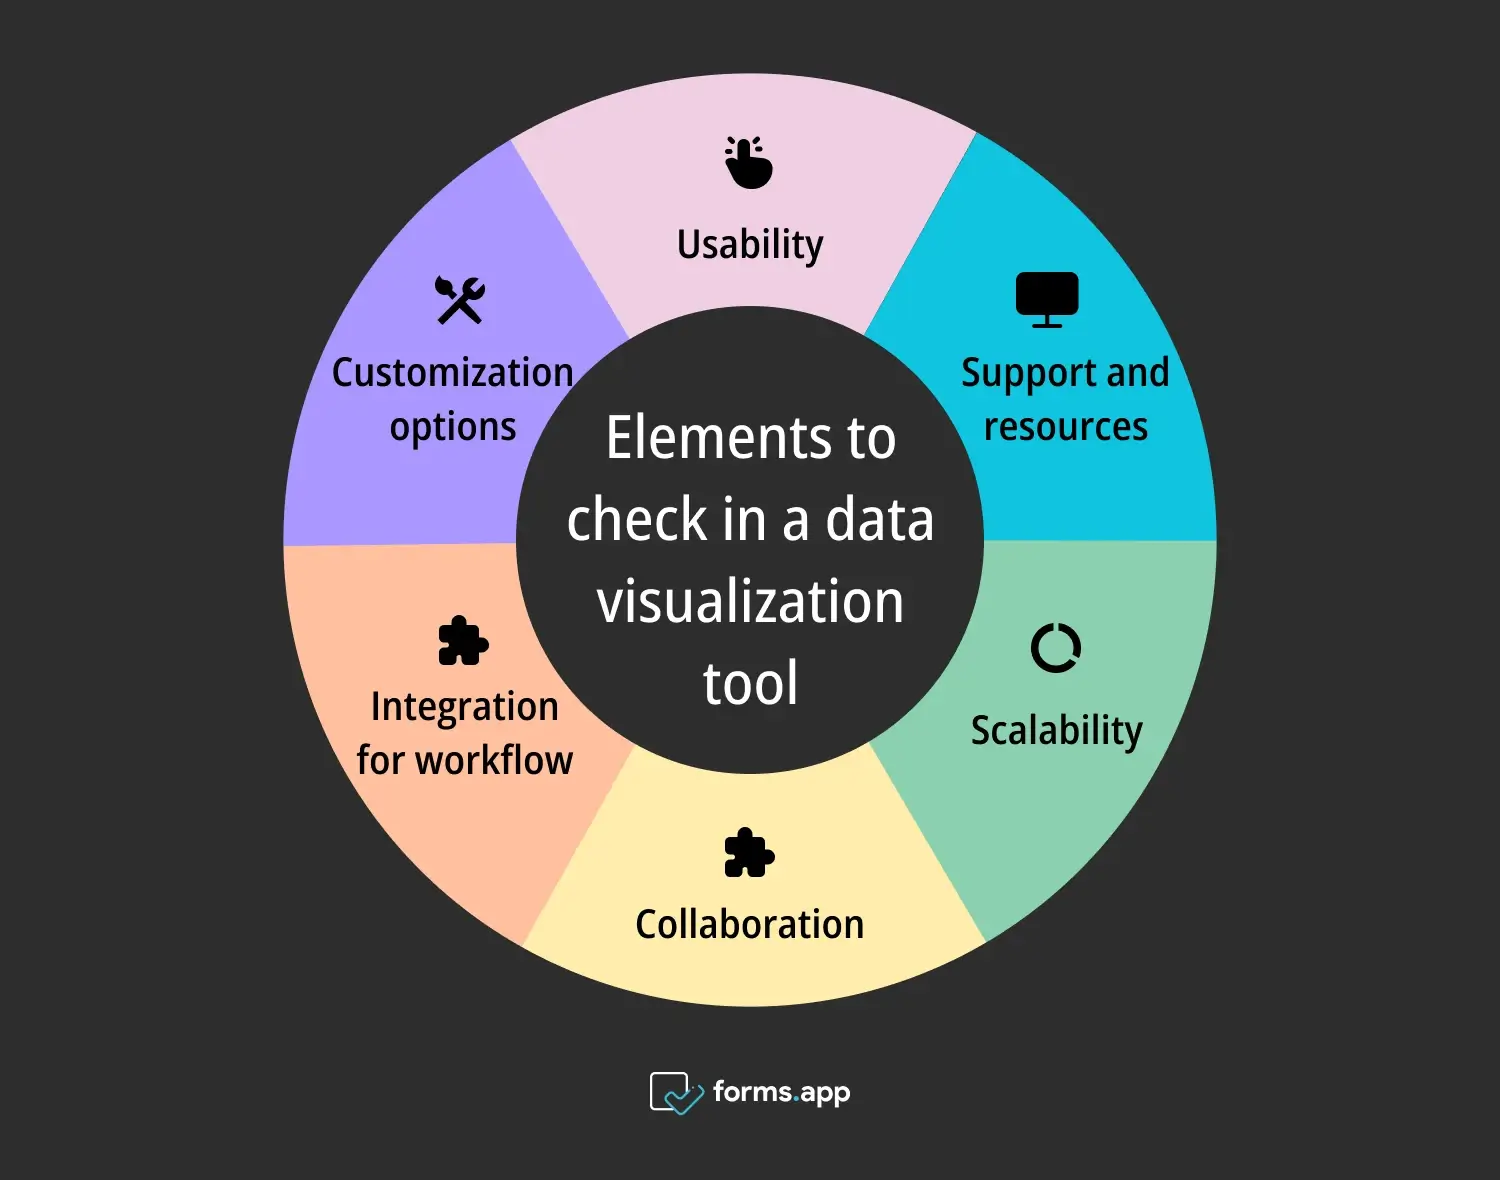
Points to check in a data visualization tool
⏩Usability: You need a tool that enables users of all levels to communicate insights clearly and effectively through visual representation. An easy-to-use tool transforms your team into data storytellers without requiring extensive technical skills. It is ideal for crafting dashboard data points and using basic charts like pie charts and scatter plots to tell your data story.
⏩Customization options: Your tool should allow you to personalize visuals to align with your brand identity, audience preferences, and communication goals. Adjusting these visuals to match your needs ensures that your data visualizations remain practical, accessible, and visually appealing, even for complex data types like big data.
⏩Integration for workflow: The tool should integrate seamlessly with various data sources and platforms you already work with. Flexible data analytics tools enable connections with sources such as Excel, CSV, and SQL databases and integration with social media platforms or business applications like Salesforce and Google Analytics, streamlining the flow of information to create a cohesive online data visualization experience.
⏩Collaboration: Effective data visualization tools should support real-time collaboration, allowing multiple users to contribute to a project. Features like commenting, sharing, and version control improve team efficiency. They make it easy for data science teams and other departments to share insights and add value through collaborative analysis of data points.
⏩Scalability: As your business grows, so does your data. Choosing a scalable data visualization tool is essential as it allows you to handle larger datasets and manage increasingly complex data visualizations. This scalability ensures your tools can handle the demands of big data and supports both the performance and functionality needed as you continue to expand.
⏩Support and resources: Mastering new data visualization techniques is easier when you can access a wealth of resources, from tutorials to webinars and reliable customer support. Ensure the solution you choose offers the necessary guidance to help your team maximize its potential and unlock the full value of effective data visualization.
10+ Great data visualization tools for better results
Data visualization tools can be highly efficient for you and your teams’ work. Although each tool has similar usage and benefits, some of them are better in more specific points. We have written information about their highlights and best-known parts.
1. Draxlr
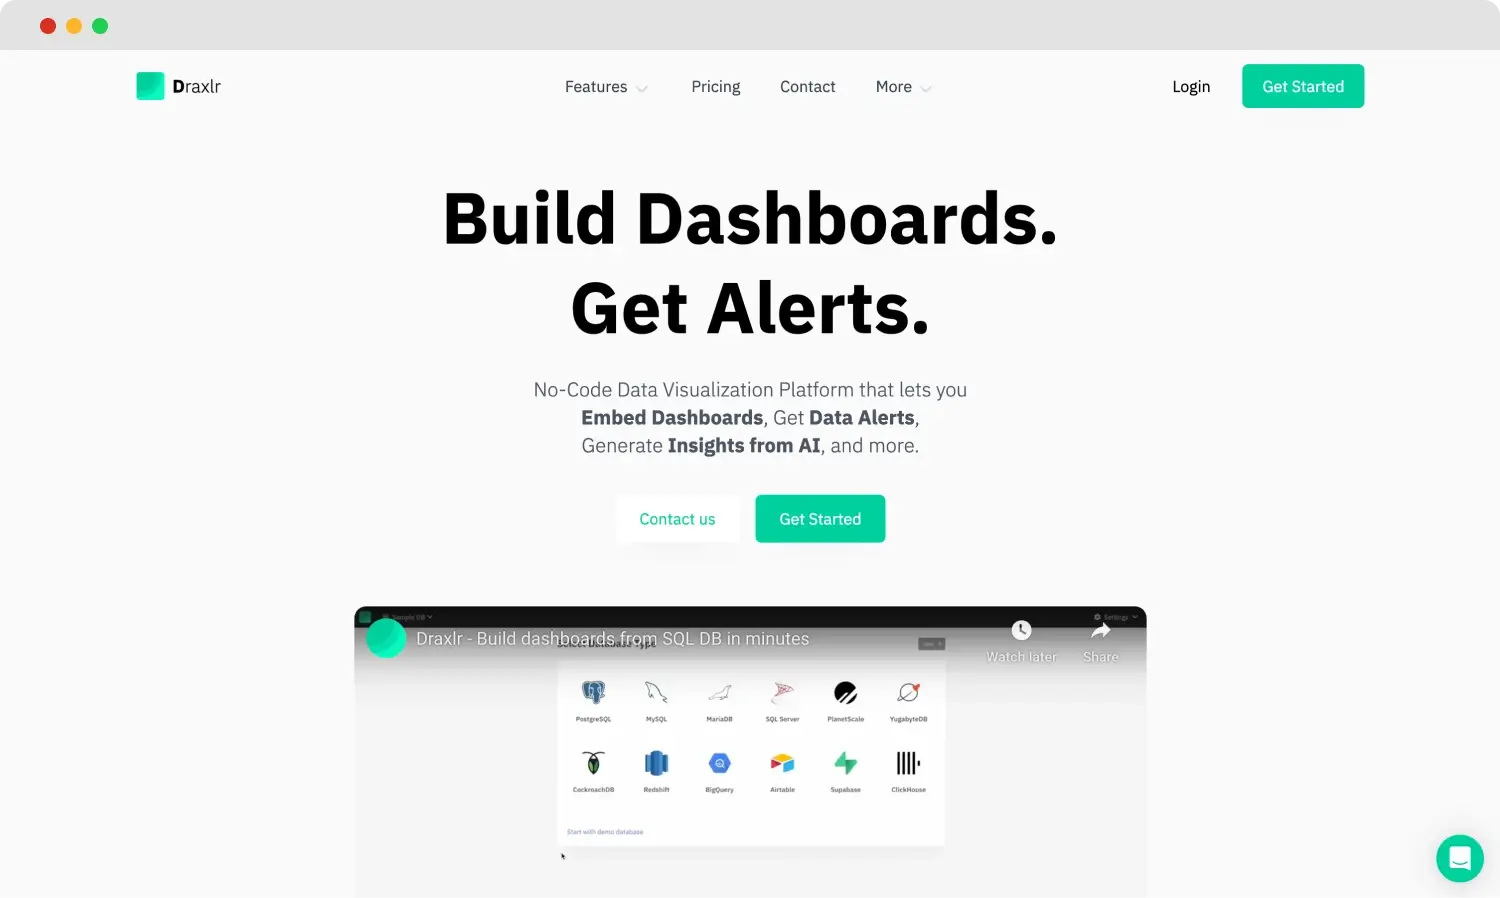
The homepage of Draxlr
Draxlr is a user-friendly self-service BI tool that empowers your team to unlock data-driven insights effortlessly. With an intuitive interface and AI-powered assistant, it enables easy data exploration without writing code. Seamlessly connecting with SQL databases, Airtable, Supabase, and Excel Sheets, Draxlr is designed for everyone in your organization to ask data questions and gain valuable insights.
Highlights
- No code queries using Draxlr AI and intuitive interface.
- Slack and email alerts.
- Embed dashboards to any application.
- Fast customer support.
- Support for various charts and graphs for building beautiful dashboards.

💡 Best known for ease of use interface, designed to make data analysis accessible even to those without technical expertise.
Draxlr Pricing
Has a free 14-day trial
- Pro plan: $39 per month
- Premium plan: $59 per month
- Custom pricing plan
2. Highcharts
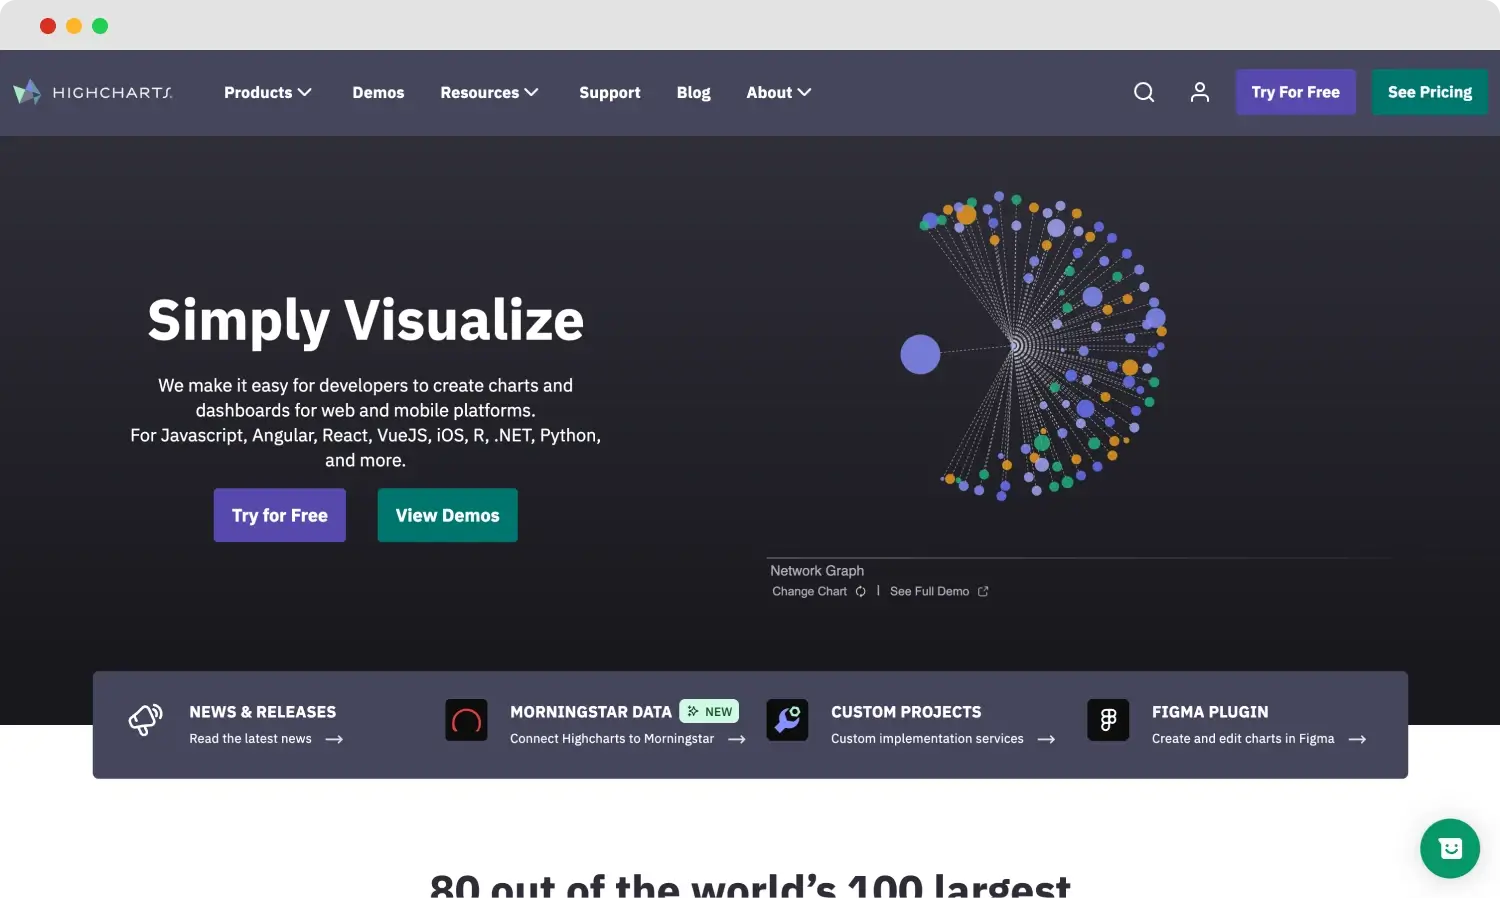
The homepage of Highcharts
Highcharts is an interactive charting library that simplifies data visualization for developers on web and mobile platforms. Built on JavaScript and TypeScript, it offers flexible integrations with frameworks such as Angular, React, and Vue and server environments like .NET, Python, and PHP. Users can create a wide range of charts, including line, bar, stock, map, and Gantt charts. Highcharts also includes Highcharts Dashboards and Highcharts Advantage for premium support and updates.
Highlights
- Extensive chart types and customizations
- Framework and server stack compatibility
- Premium support with Highcharts Advantage

💡Best known for Its powerful customization options and ease of embedding interactive charts.
Pricing
- Internal: $168/annually
- SaaS: $332/annually
- OEM: Based on request
- Custom: Based on request
3. ThoughtSpot
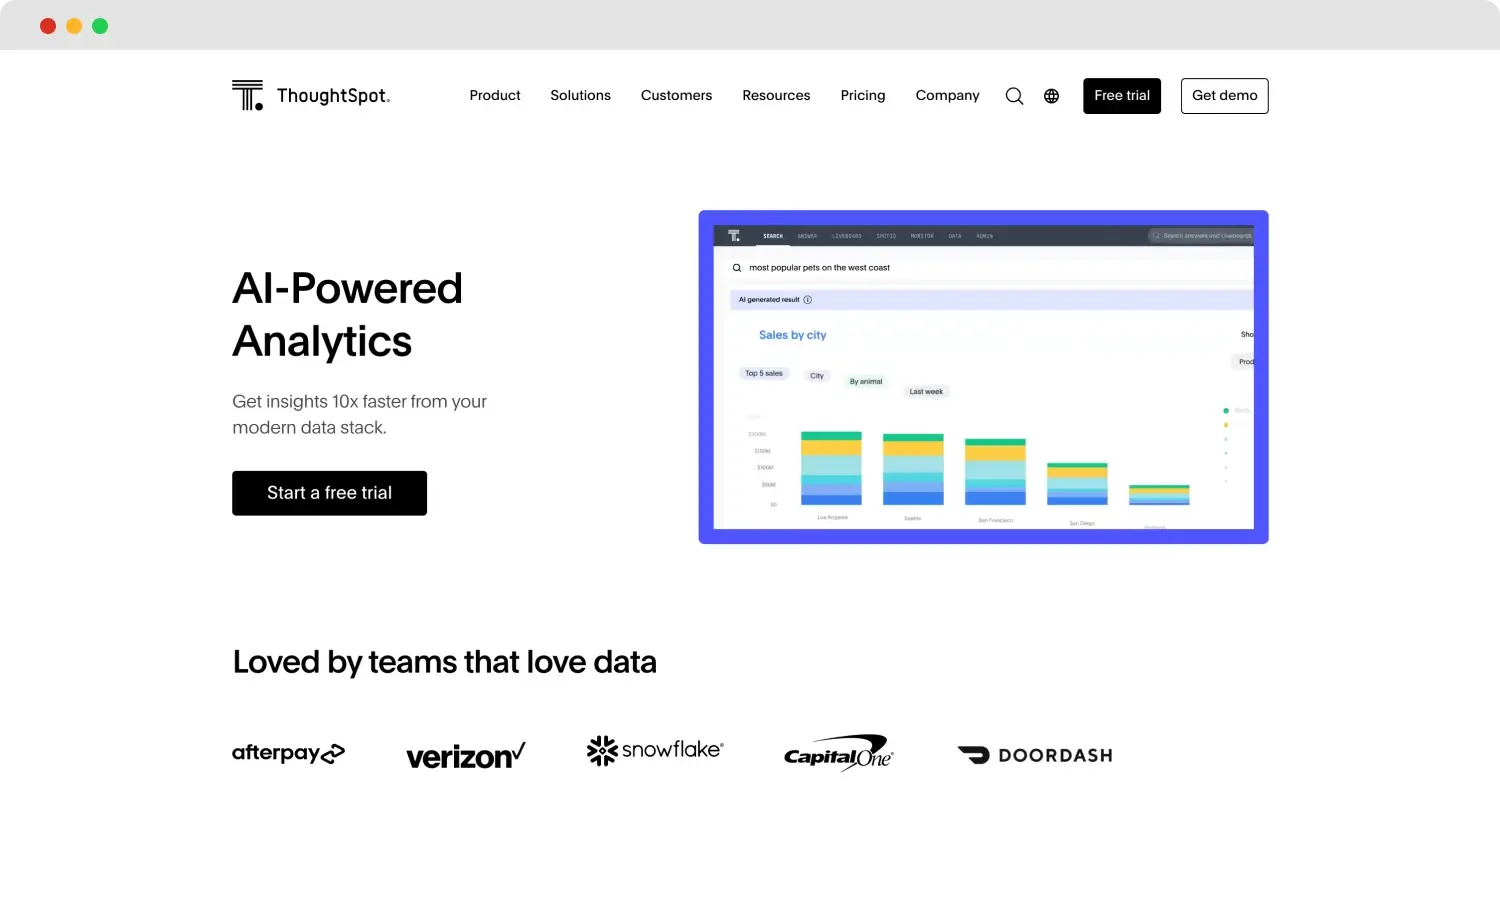
The homepage of ThoughtSpot
ThoughtSpot is a powerful data visualization and analytics platform that empowers users to explore and analyze their data. By harnessing advanced AI technology, ThoughtSpot allows organizations to create insightful visualizations, uncover trends, and make data-driven decisions rapidly. Users can generate interactive dashboards, reports, and visualizations, transforming complex data into clear insights that drive business growth.
Highlights
- User-friendly interface for effortless navigation with an intuitive design.
- AI-driven insights that automatically discover trends and patterns in your data.
- Collaborative features for easy sharing of insights
- Customizable dashboards that let you create tailored views
- Integrations with data sources like Salesforce, Snowflake, Google Analytics, and AWS.

💡 Best known for its natural language search that allows users to easily query data using everyday language, enabling anyone to interact with and analyze complex datasets.
Pricing
Has a free 14-day trial ✅
- Essentials: $1250 /month (20 users)
- Pro: Custom
- Enterprise: Custom
4. ClickUp
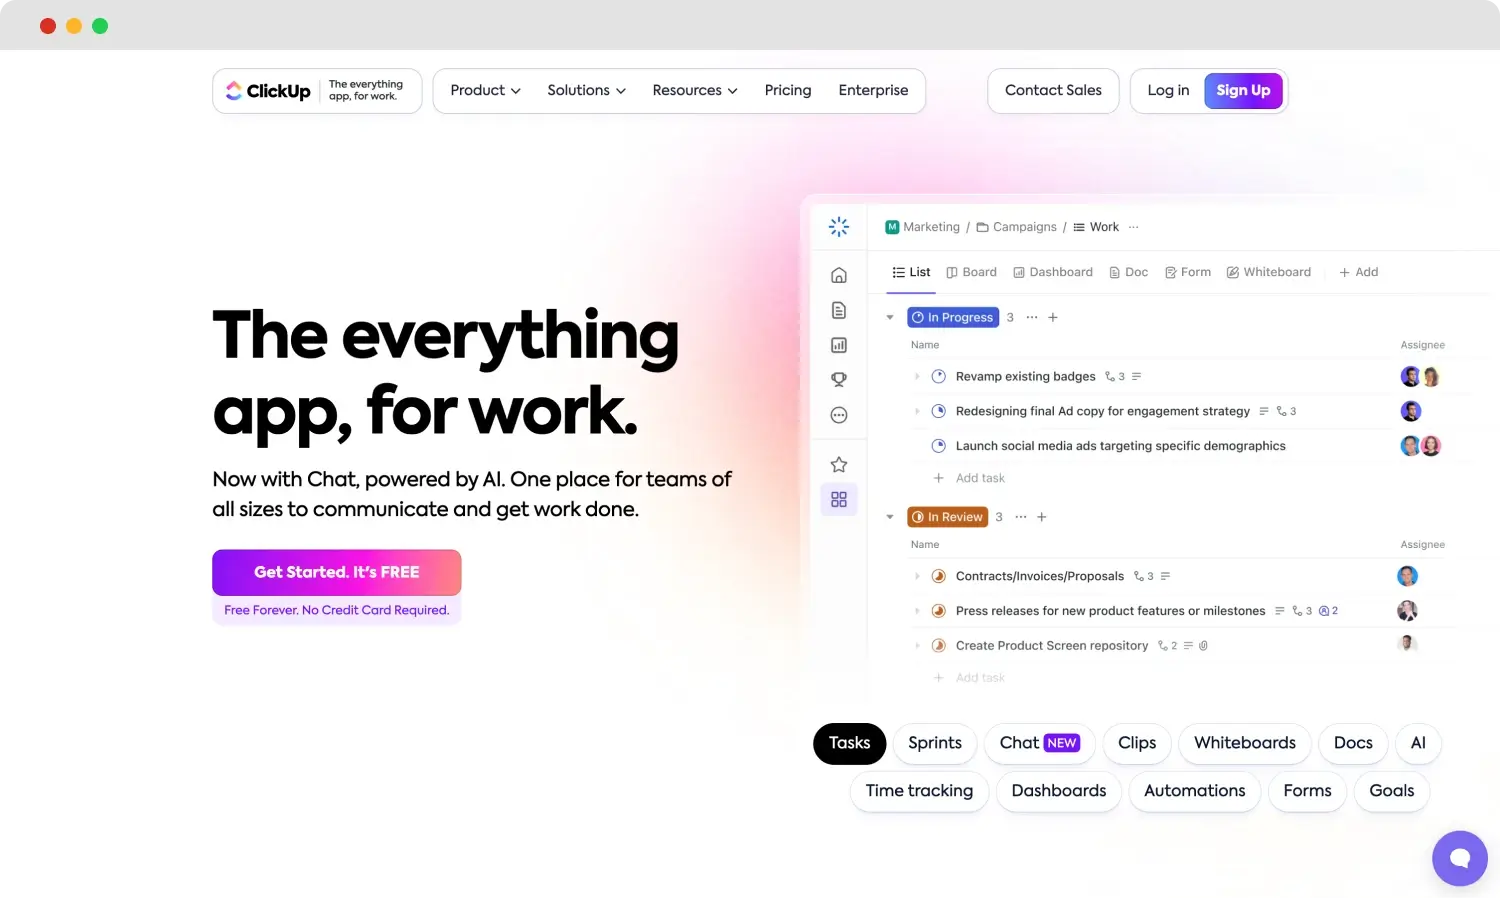
The homepage of ClickUp
ClickUp is project management software that allows everything to be viewed from a high level of work. It visualizes data for constructing engaging charts, graphs, and reports that help with the analysis to take strategic action on that data. Having integrations to many data sources, real-time collaboration only amplifies teamwork and keeps everyone aligned for each step. Because of its wide range of features, ClickUp can work for both a small team and a big organization.
Highlights
- All-in-one with customizable dashboards
- Real-time, friendly interface for rapid decision-making
- Seamless integration with the most popular business applications
- Support the documentation of the Project for a knowledge repository

💡 Best known for ease in setting up automation and making work management and strategic planning effective.
Pricing
- Free Plan ✅
- Unlimited plan (recommended for small teams): $10 /month
- Business: $12 /monthly (best for mid-sized teams): $19 /month
- Enterprise: Custom
5. Tableau
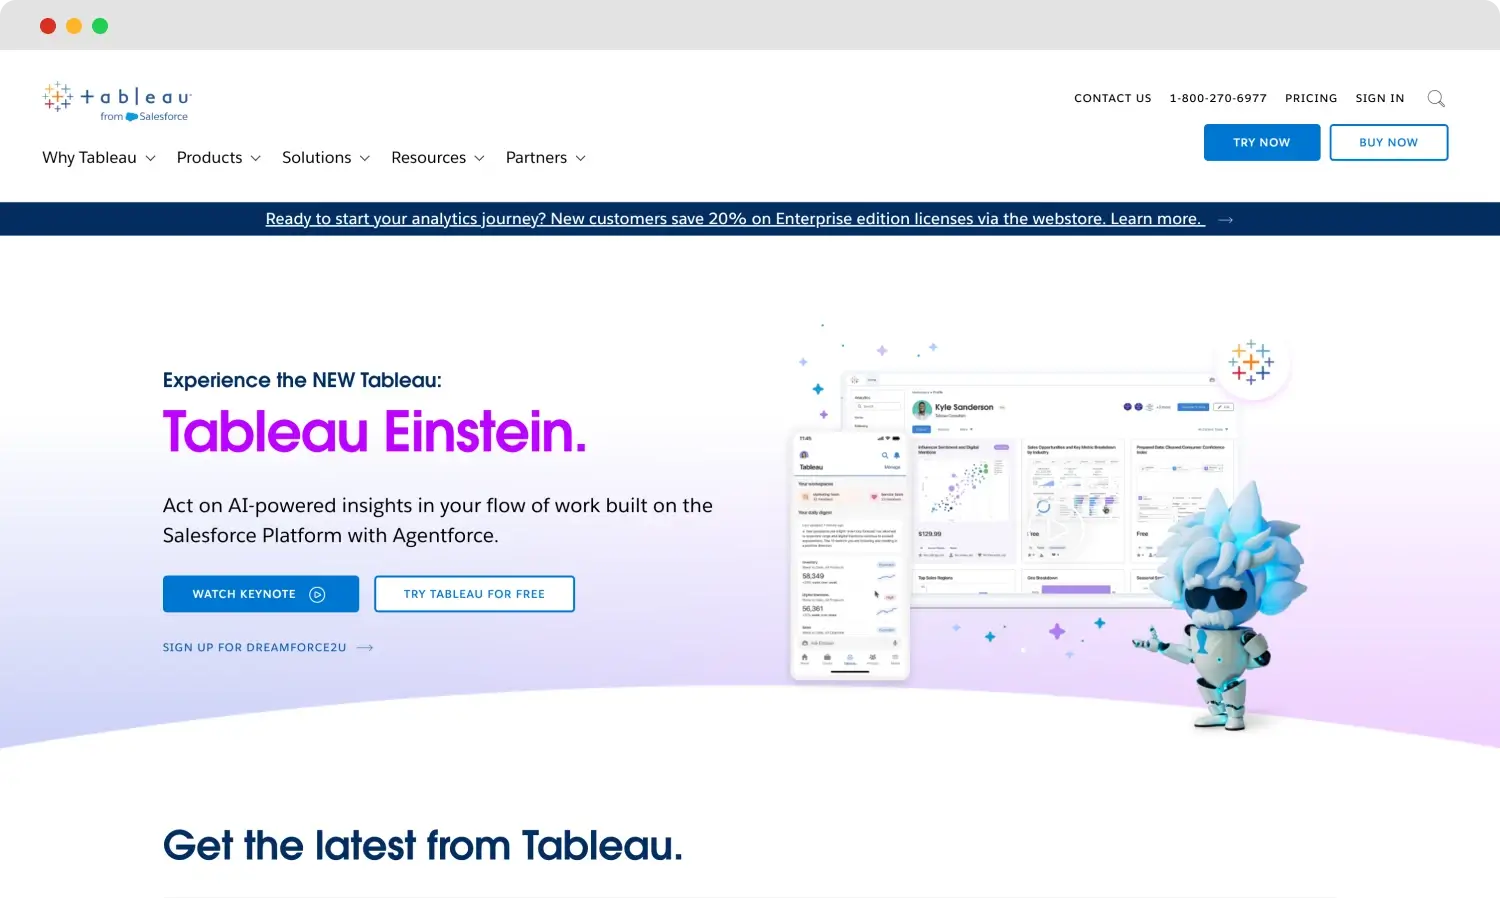
The homepage of Tableau
Tableau aims to help the enterprise class in data handling and analysis by providing a suite of data visualization tools. Its platforms assure security and scalability when dealing with the volumes of data that businesses handle. It has robust visualization capabilities, and with Tableau, users can take even the most complex data sets and render them incomprehensible visuals.
Large-scale business operations featuring heavy data usage benefit from rich customization options and a high processing powerhouse, one aspect of which is supported by Tableau.
Highlights
- Drag-and-drop interface with the integration of various data sources
- Emphasize interactive development for analytics dashboards to support deep analysis
- Scalable and secure for large organizations

💡 Best known for enterprise-level data analytics and security towards large-scale operations.
Pricing
- Tableau Viewer: $15/month
- Tableau Explorer: $42/month
- Tableau Creator: $75/month
- Enterprise Viewer: $35/month
- Enterprise Explorer: $70/month
- Enterprise Creator: $115/month
- Tableau+: Custom
6. Databox
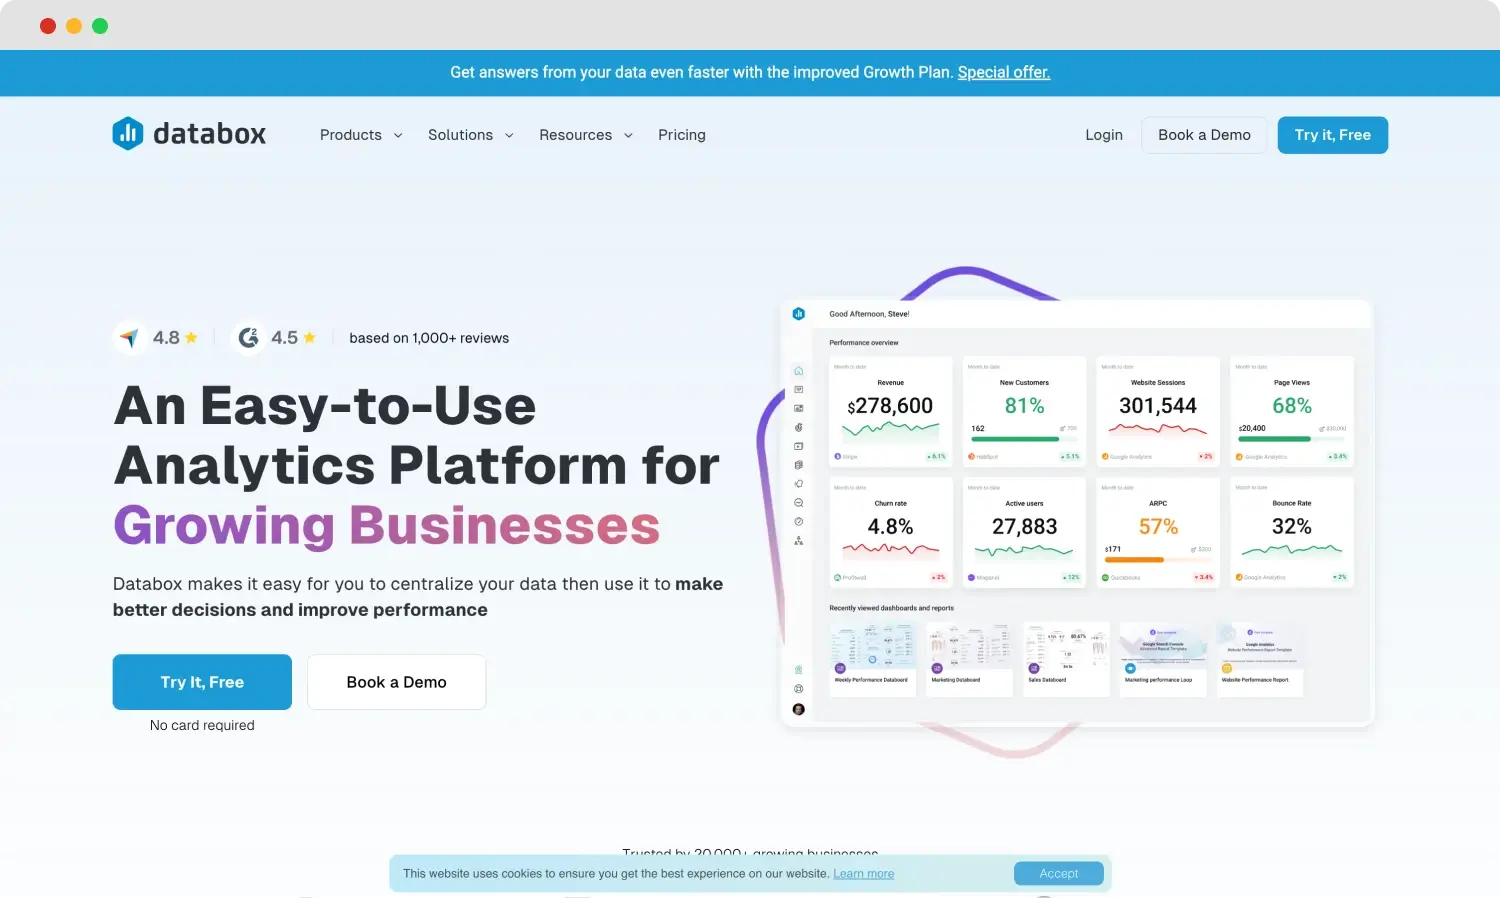
The homepage of Databox
Databox specializes in creating KPI dashboards to track business metrics. Its real-time updates and mobile accessibility allow teams to monitor key performance indicators. This tool integrates seamlessly with many data sources, providing businesses a centralized hub for tracking progress and performance. Databox's KPI focus ensures teams can access critical metrics in real-time, making it essential for fast-paced business environments.
Highlights
- Extensive library of templates for rapid setup
- Real-time data updates for on-the-go performance tracking
- Integrates with popular data sources for easy KPI dashboard creation

💡 Best known for its KPI dashboard capabilities, suitable for businesses focused on performance monitoring.
Pricing
- Free Forever Plan: $0/month for 3 users
- Starter: $59/month for five users
- Professional: $199/month for unlimited users
- Growth: $399/month for unlimited users
- Premium: $999/month for unlimited users
7. Salesforce Marketing Cloud Intelligence
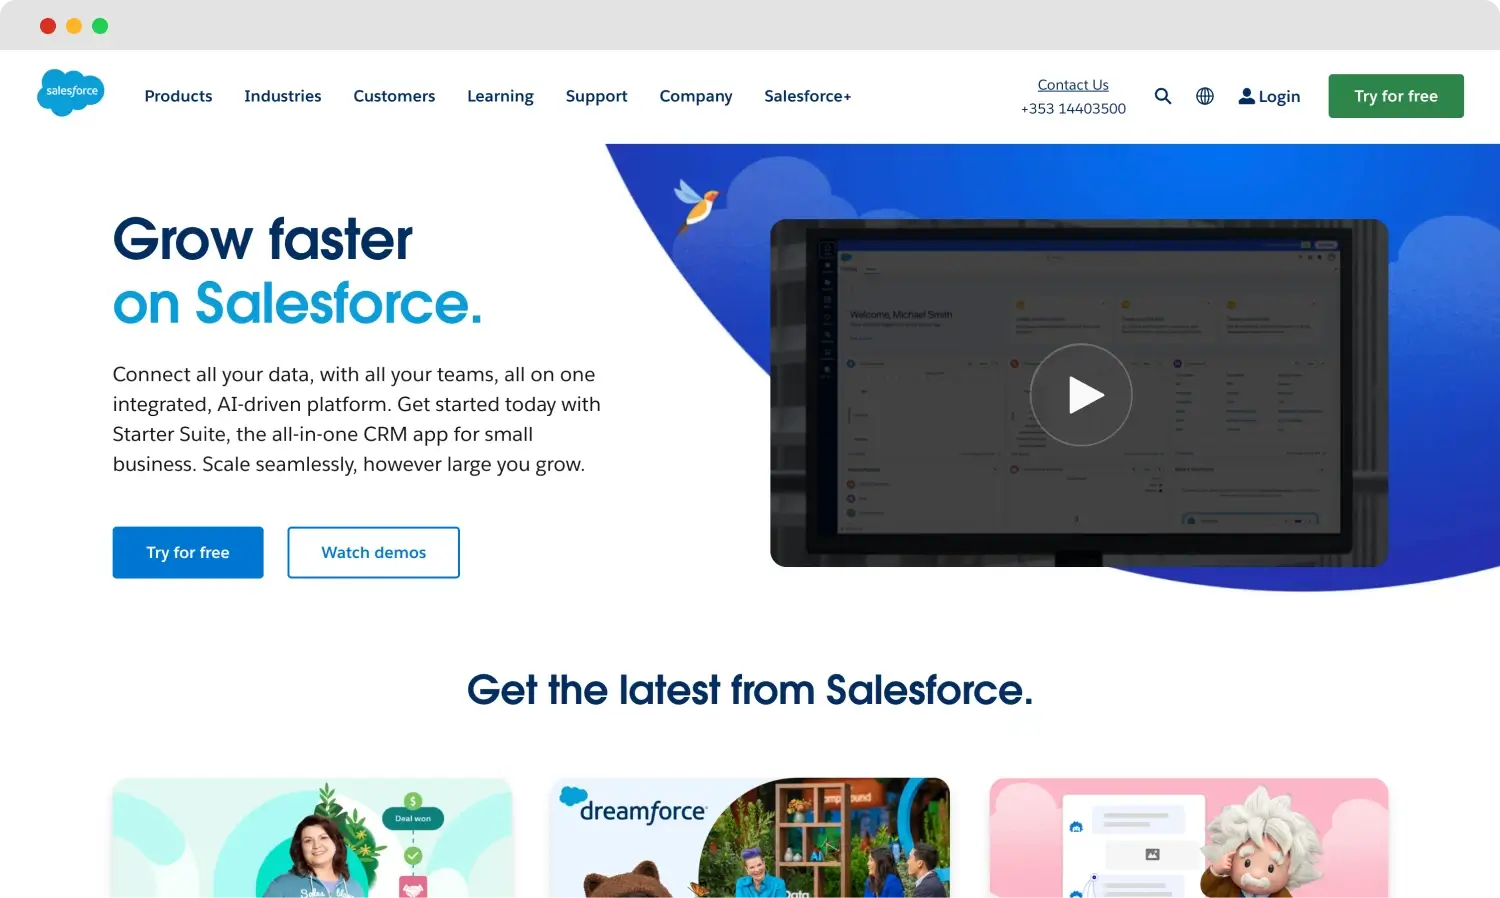
The homepage of Salesforce Marketing Cloud Intelligence
Formerly known as Datorama, Salesforce Marketing Cloud Intelligence is a user-friendly platform for creating charts and visuals. It enables businesses to develop clear, straightforward visualizations that are easily interpreted. Known for its user-friendliness, Salesforce Marketing Cloud Intelligence connects various marketing data sources to provide unified insights that support enhanced decision-making. It allows teams to focus on interpreting data rather than managing complex design tools.
Highlights
- Data import and API integration with various sources
- Easy-to-use interface with simple chart options
- Focus on clarity and concise visuals

💡 Best known for simplicity and easy data import, it is excellent for teams needing basic, no-fuss visuals.
Pricing
- Starter: $3,000/month for ten users
- Growth: $10,000/month for twenty users
- Plus: Custom
8. Klipfolio
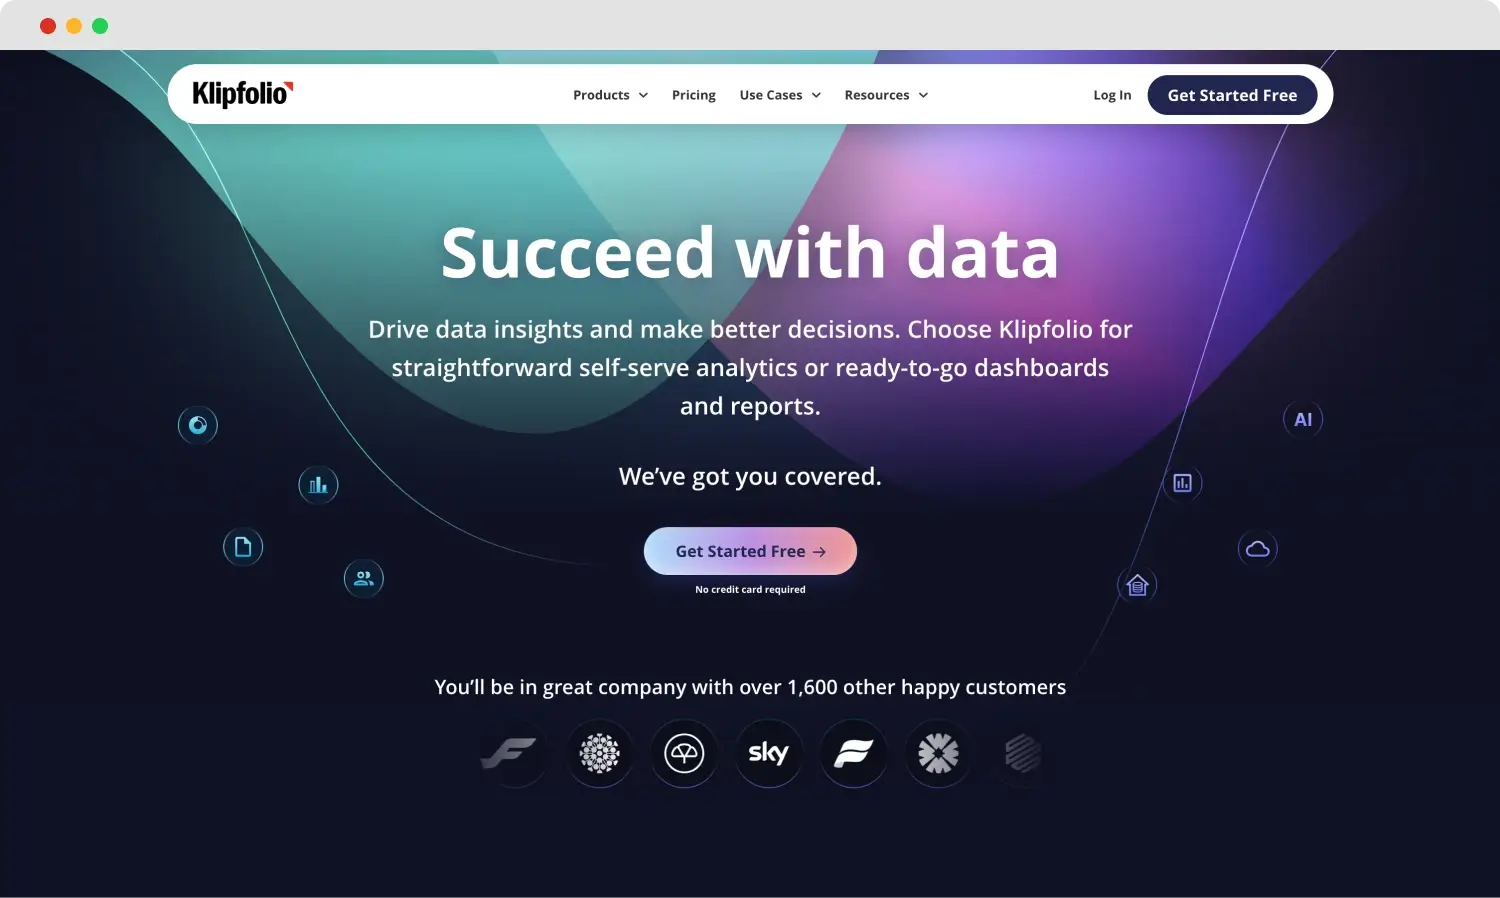
The homepage of Klipfolio
Klipfolio is designed for teams needing advanced data manipulation. It contains complicated formulas and allows the integration of many data sources for in-depth analysis. It offers various visualization options, from simple charts to complex, KPI-driven dashboards. Klipfolio lets businesses track their metrics in real-time, making sharing a rich data environment accessible across teams. It is designed for companies that need intelligent, data-driven, quick, and efficient decisions.
Highlights
- User Defined ROI templates and Visual Gauges
- Easy integration with the most common data sources like CRM and Google Analytics

💡 Best known for handling complex calculations and ideal for deep data analysis. (offers add-ons)
Klipfolio Pricing
- Free: $0/30-day trial for two editors
- Professional: $60/month
- Business: Custom
9. Looker Studio
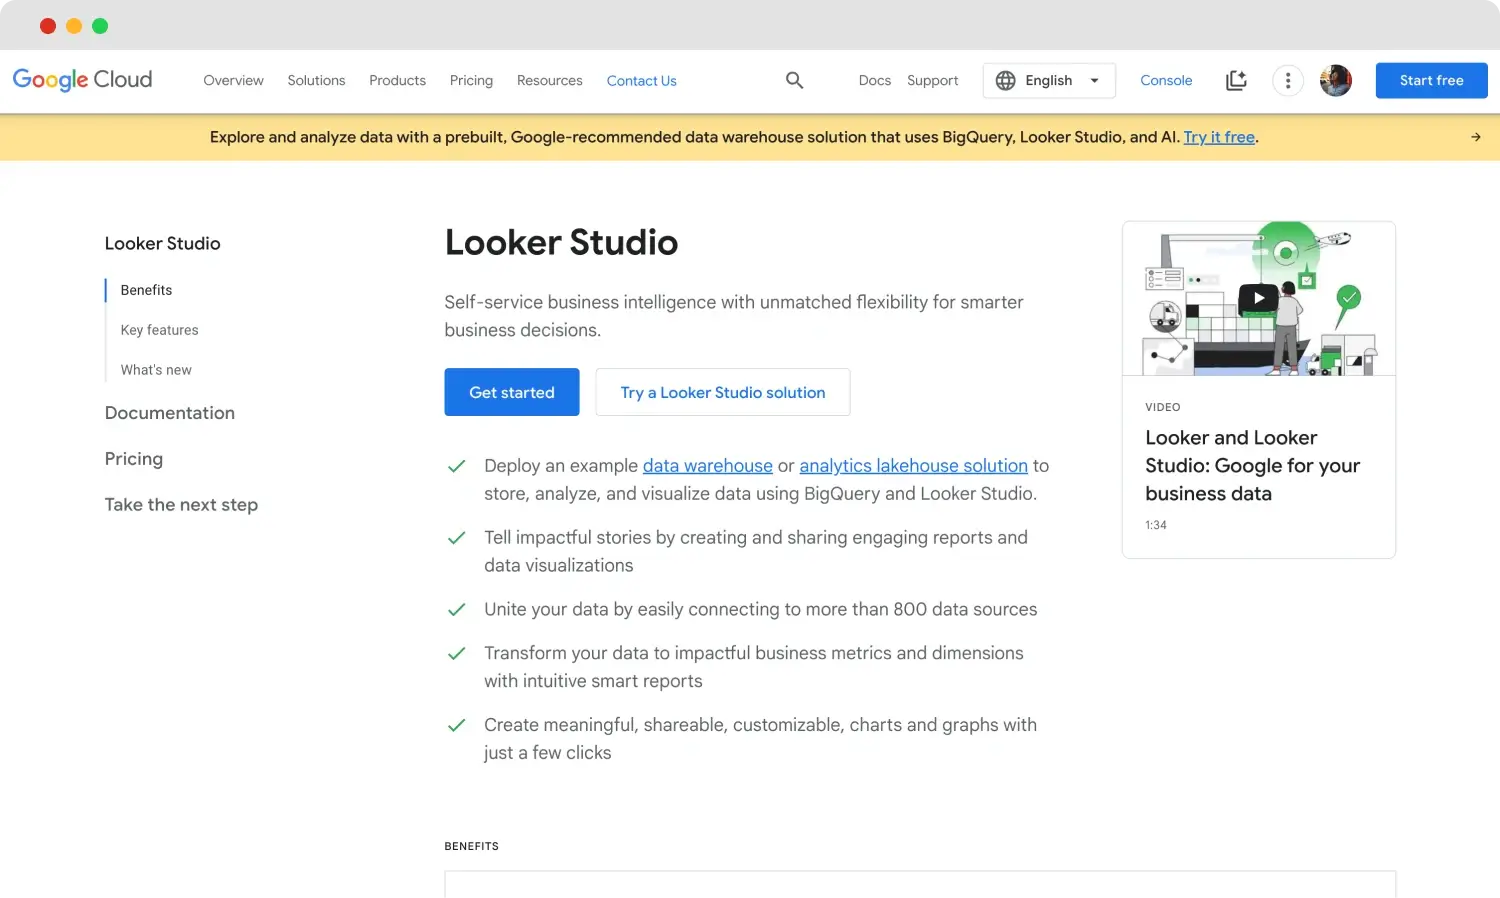
The homepage of Looker Studio
Looker Studio, developed by Google, is a flexible data visualization platform that helps users build customized visualizations to tell compelling stories. This platform is especially loved by data analysts because it supports a wide range of data sources with considerable ease. Google Looker Studio allows users to create in-depth reports for business decisions and operational excellence through intuitive interfaces, even for more non-technical users.
Highlights
- Remote access through a web-based system
- Allow for interactive dashboards and report scheduling
- Very easy to use to create visualizations, using many chart types

💡 Best known for being easy to access remotely; thus, it's ideal for those data analysts who are always on the go.
Pricing
To set up a self-service subscription to Looker Studio Pro, you must meet all of the following requirements:
- You must subscribe to or use Looker Studio Pro as a Google Workspace or Cloud Identity user.
- You will need to provide a valid Google Cloud project that is linked to a billing account. Learn how to set up a Google Cloud billing account.
- You must have the Owner (roles/owner) or Looker Studio Pro Manager (roles/lookerstudio.proManager) IAM role on the Google Cloud project that you use for Looker Studio Pro.
Please check Google’s official website to learn more and create a subscription request.
10. Microsoft Power BI
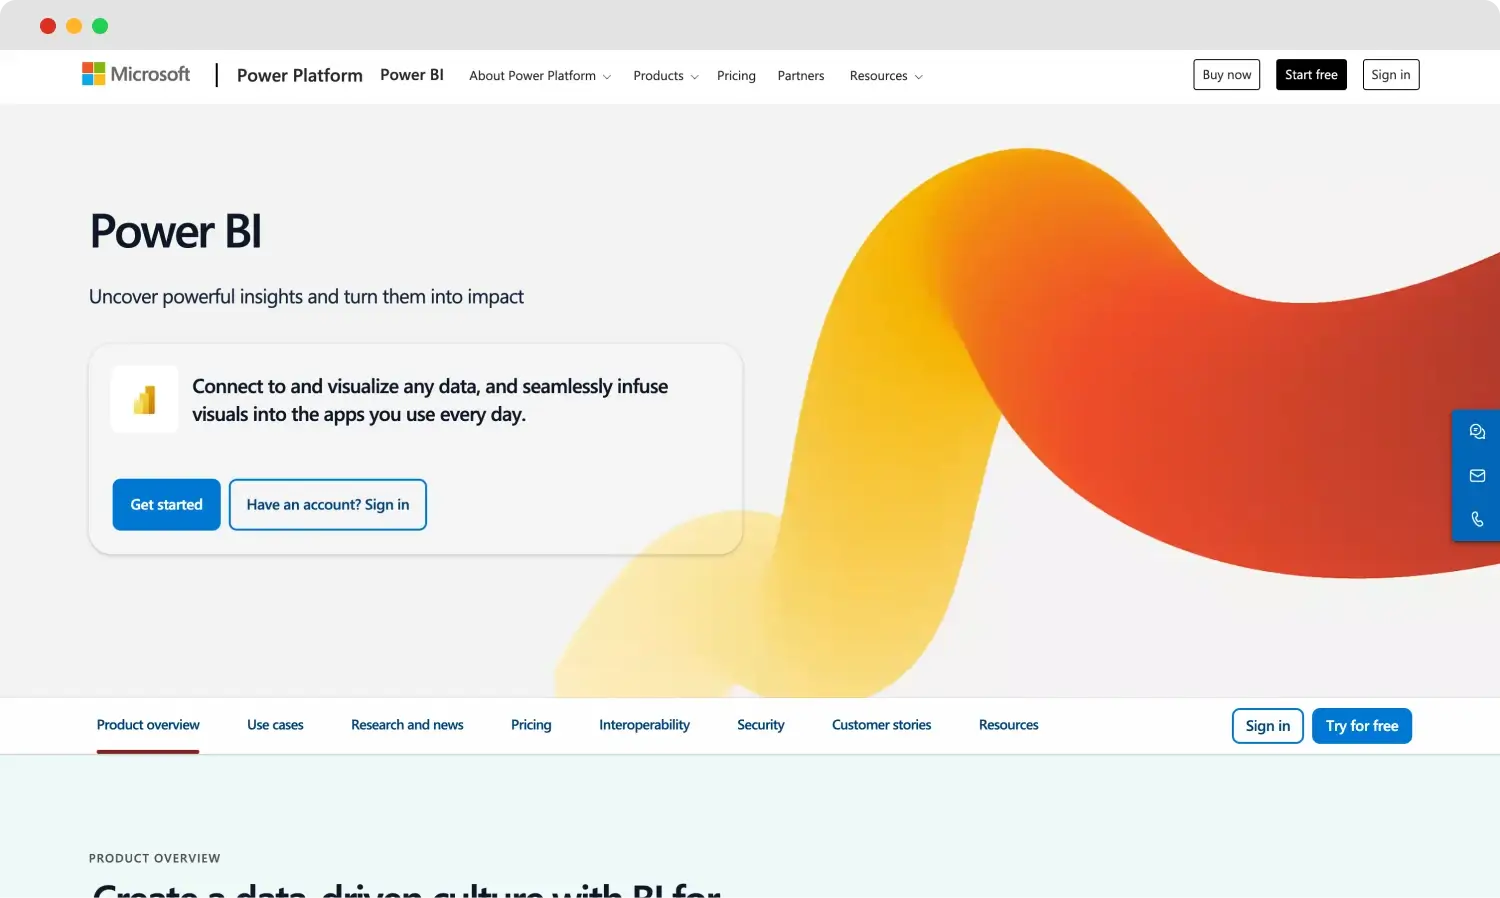
The homepage of Microsoft Power BI
Microsoft Power BI offers powerful visualizations to enterprises and integrates with most Microsoft applications. It can combine data from various sources and allow data-driven decision-making. With Power BI's advanced AI capabilities, you can derive insights beyond conventional reporting and explore trends.
This flexibility, combined with very deep integrations with Microsoft products, has made it a default choice for companies that have invested heavily in the Microsoft universe to use existing data sources for deep analytics.
Highlights
- Data connector: This connects your application to the disparate data sources, including SQL and cloud-based files
- User-friendly drag-and-drop interface
- Types of charts available: Enabling the building of interactive dashboards

💡Best known for strong integration with the Microsoft ecosystem, which makes it ideal for business intelligence.
Pricing
- Power BI Pro: $10/month per user
- Power BI Premium: $20/month per user
- Power BI Premium Per Capacity: Variable
Wrapping it up
In conclusion, data visualization tools enable converting raw data into meaningful insights in a visually engaging format, driving business strategy. Organizations can unlock the full potential of their data by selecting a tool tailored to their specific needs—whether for ease of use, advanced AI capabilities, or extensive customization.
Thanks to these great tools, it is easy to understand the type of data and interpret the data more effortlessly. In this essay, we have provided you with 10 great data visualization tools in addition to their significance. Utilizing these tools will eventually boost your success.
Bünyamin is a content writer at forms.app. He is also a skilled interpreter and photographer. His interests include dubbing and cinematography. Bünyamin's expertise lies in marketing.


 7 minutes de lecture