Making histograms in Google Sheets is a simple way to look at your data clearly. With charts in Google Sheets, you can easily show info like customer happiness or website visits. Similarly, creating a histogram helps you see the big trends and the little differences in your data quickly.
In this guide, we'll teach you how to make histogram charts right in Google Sheets. You'll learn to pick the data range, create a histogram, insert a chart, and find the best chart type for your information. By the end, making histograms will be a piece of cake, helping you understand and make better decisions from your data.
What is a histogram chart?
A histogram chart is a type of graph in Google Sheets that shows how often something happens within a set of data.
It groups numbers into ranges, and the height of each bar shows how many fall into each range. This makes it easy to see patterns like the most common outcomes or if there are any outliers.
The use of histogram charts can help you analyze your data better, regardless of whether it is a line graph or scatterplot. So, if you are seeking more reasons to use histogram charts on your sheet, have a look at the following title:
Why use a histogram chart?
Histogram charts in spreadsheets help you sort and understand your data sets quickly. Learning how to make a histogram in a spreadsheet allows you to visualize data distribution effectively through its distinct chart style, simplifying the analysis of vast information.
👉🏻You can easily compare data
👉🏻It helps identify trends and outliers
👉🏻Simplifies understanding complex data
👉🏻Offers effective visualization with a clear chart style
How to make a histogram chart in Google Sheets
Making a histogram chart in Google Sheets is straightforward and lets you analyze your data beautifully. This guide will show you how to make a chart in Google Sheets, focusing on setting up the vertical axis and horizontal axis. You'll see how easy it is to transform your data into meaningful visuals.
Step 1
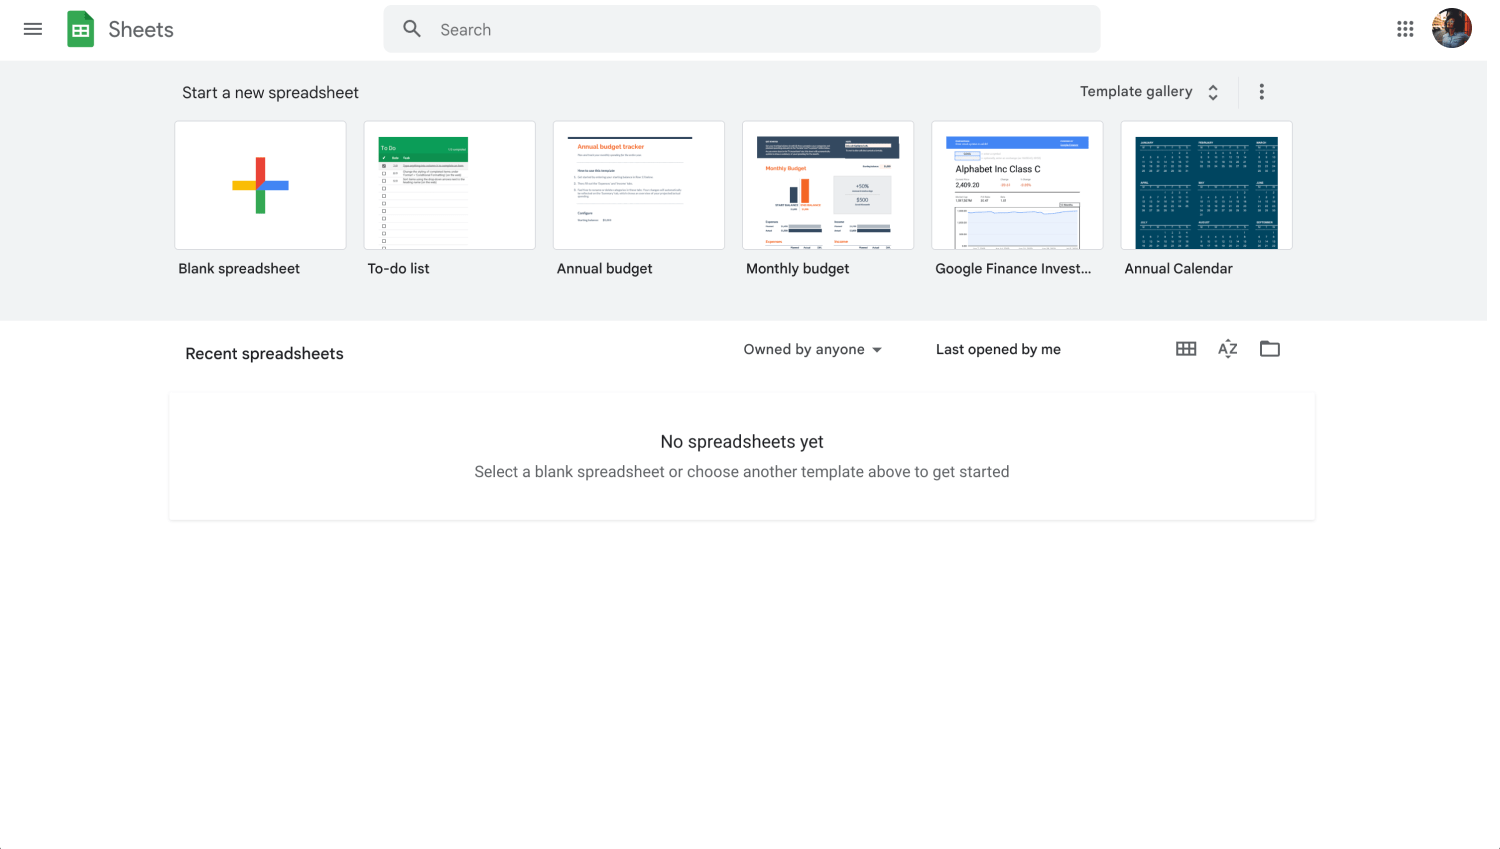
Google Sheets dashboard
Start by logging into your Google account and opening the Google Sheets document containing your dataset.
Step 2
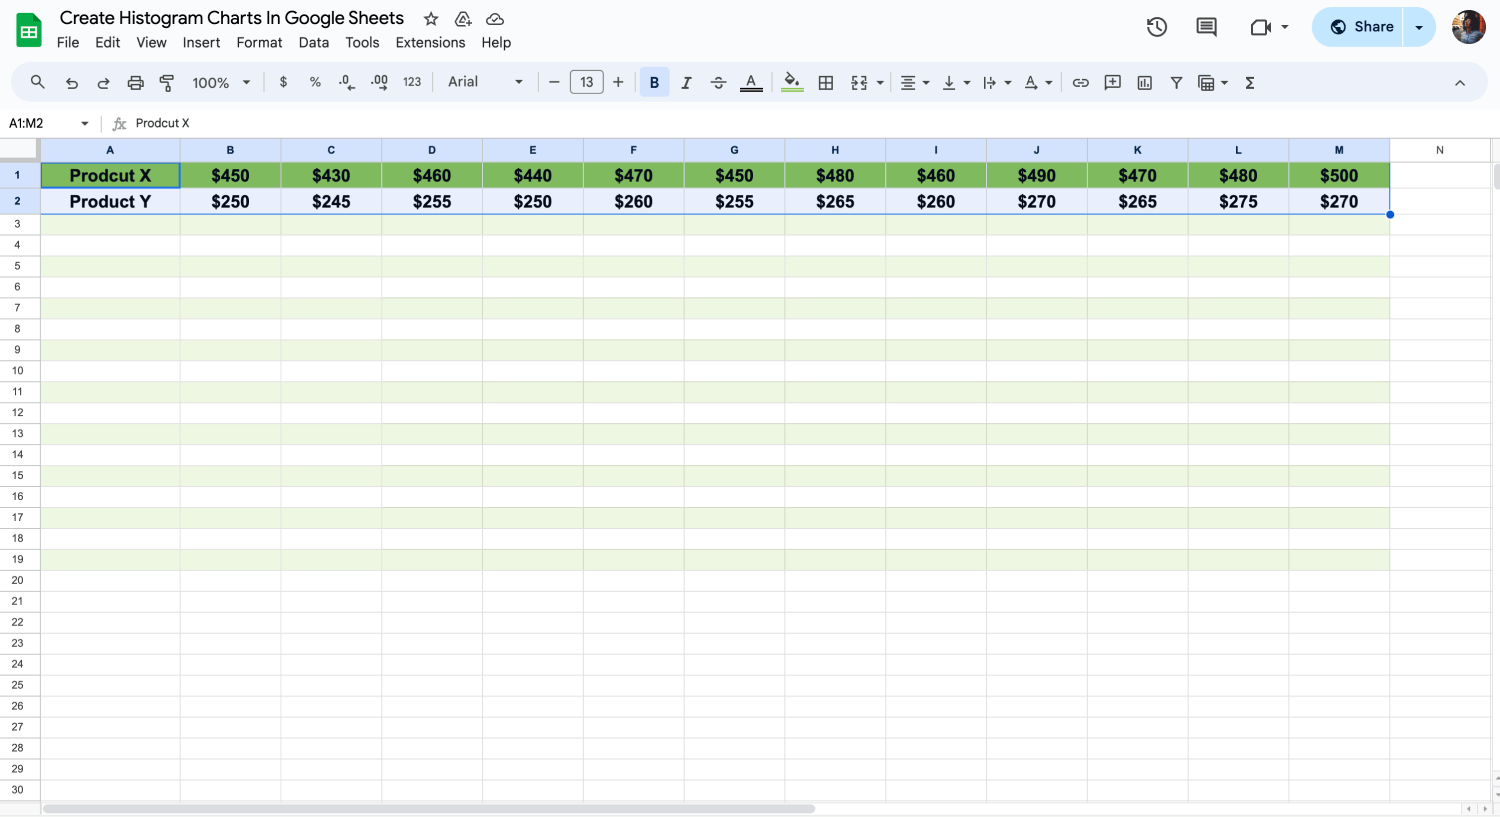
Choose the cells you want to insert a chart
Carefully highlight the cells with the data points you need for your histogram. This step is vital because it sets the number of data points your histogram will show, shaping how it will look and the insights you can draw from it.
Step 3
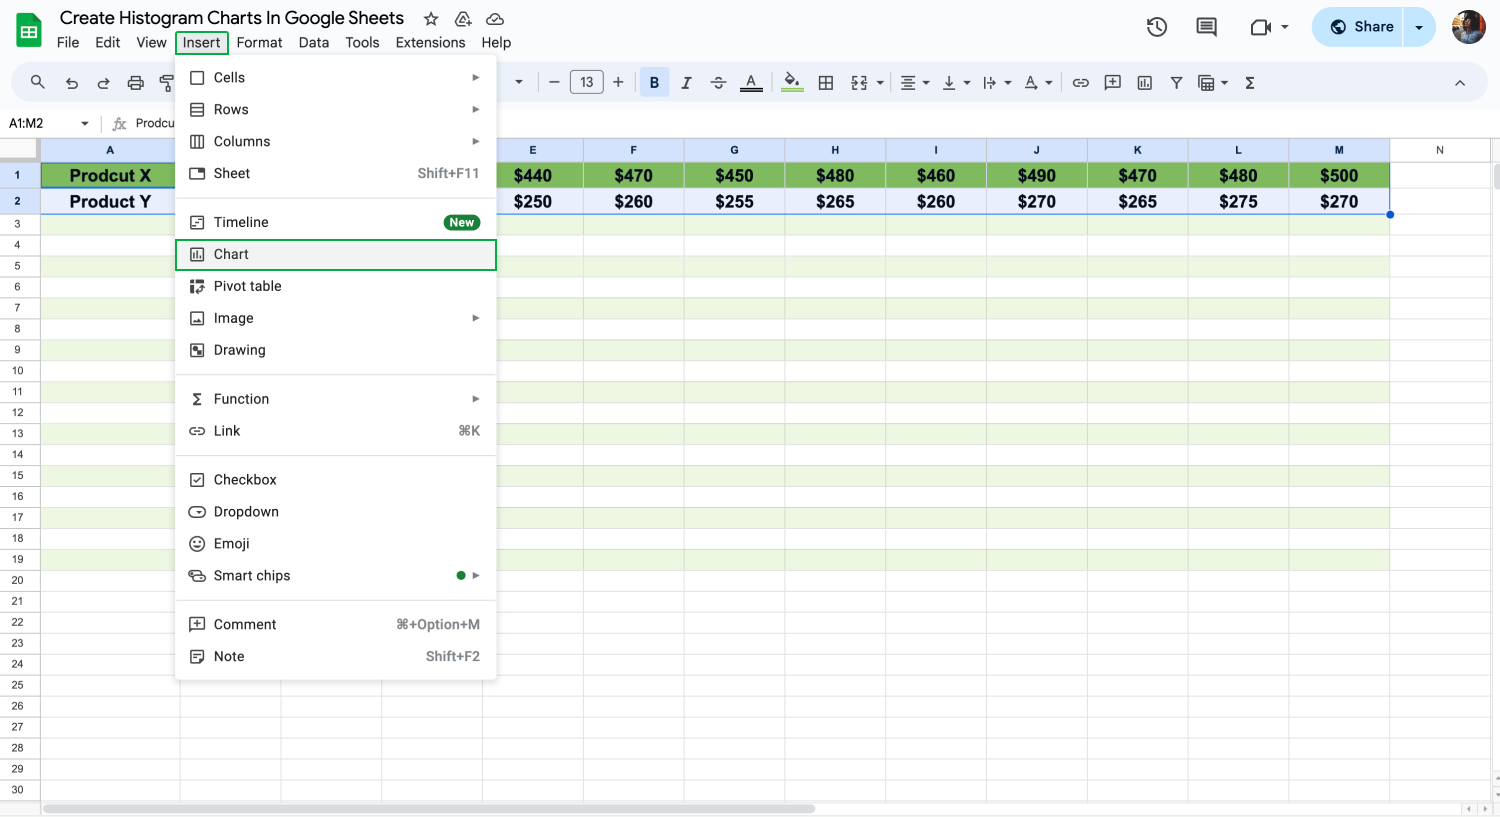
Click “Chart” to insert a chart
With your data highlighted, go to the top menu in Google Sheets and click on "Insert." A dropdown menu will appear, where you'll select "Chart." This action gets Google Sheets ready to help you create your chart, moving you closer to having your histogram.
Step 4
When the Chart Editor panel pops up on the right, it's time to pick the right chart type. To create histograms, we will choose “Line Chart”. This choice tells Google Sheets to organize your data in a way that highlights distribution and frequency, which is crucial for histogram analysis.
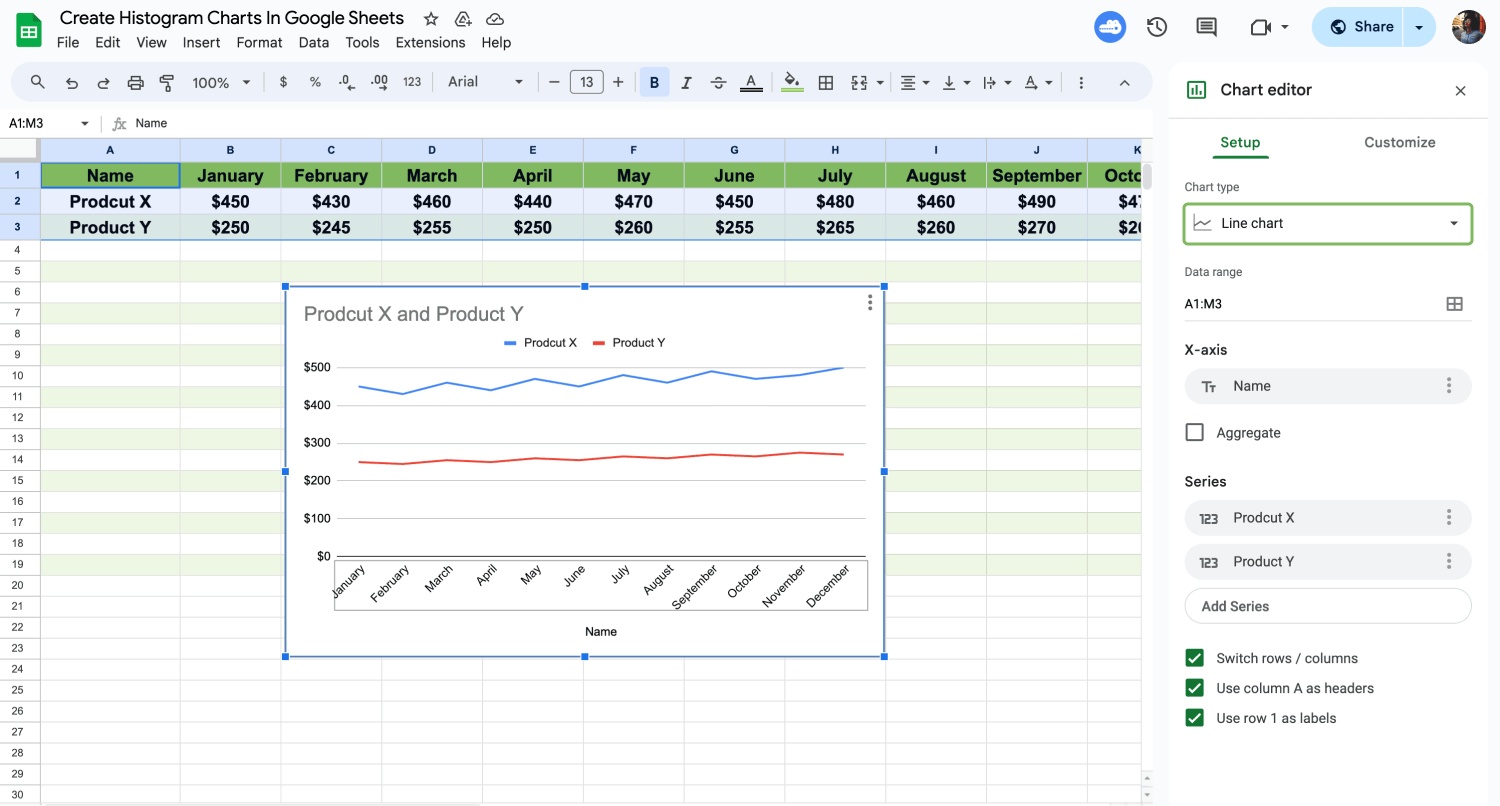
Choose a line type
Step 5
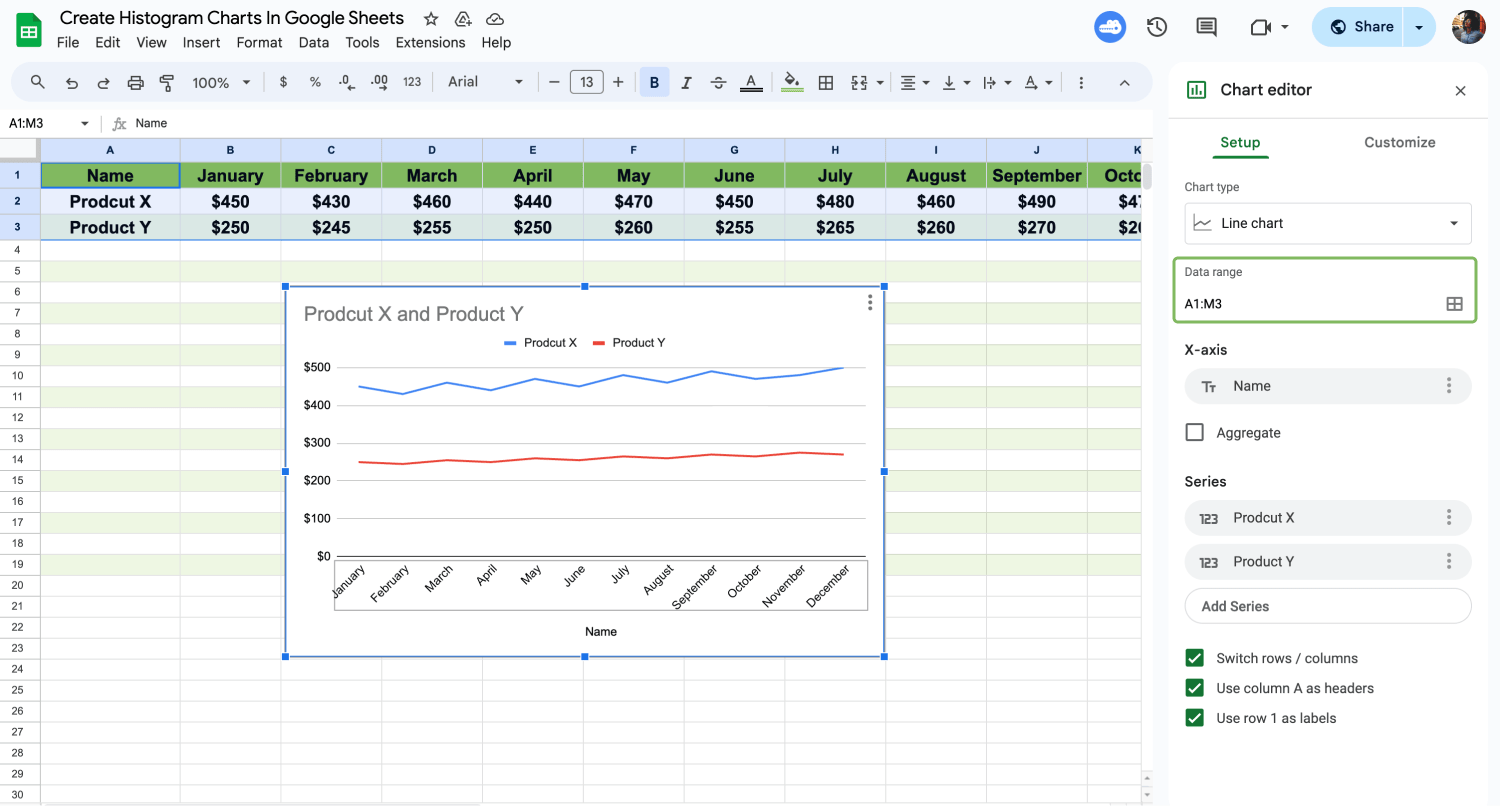
Arrange the date range
Select the data and range for your histogram. You can adjust this in the Chart Editor if necessary. You might need to adjust this to accurately capture and represent all the necessary information in your histogram.
Step 6
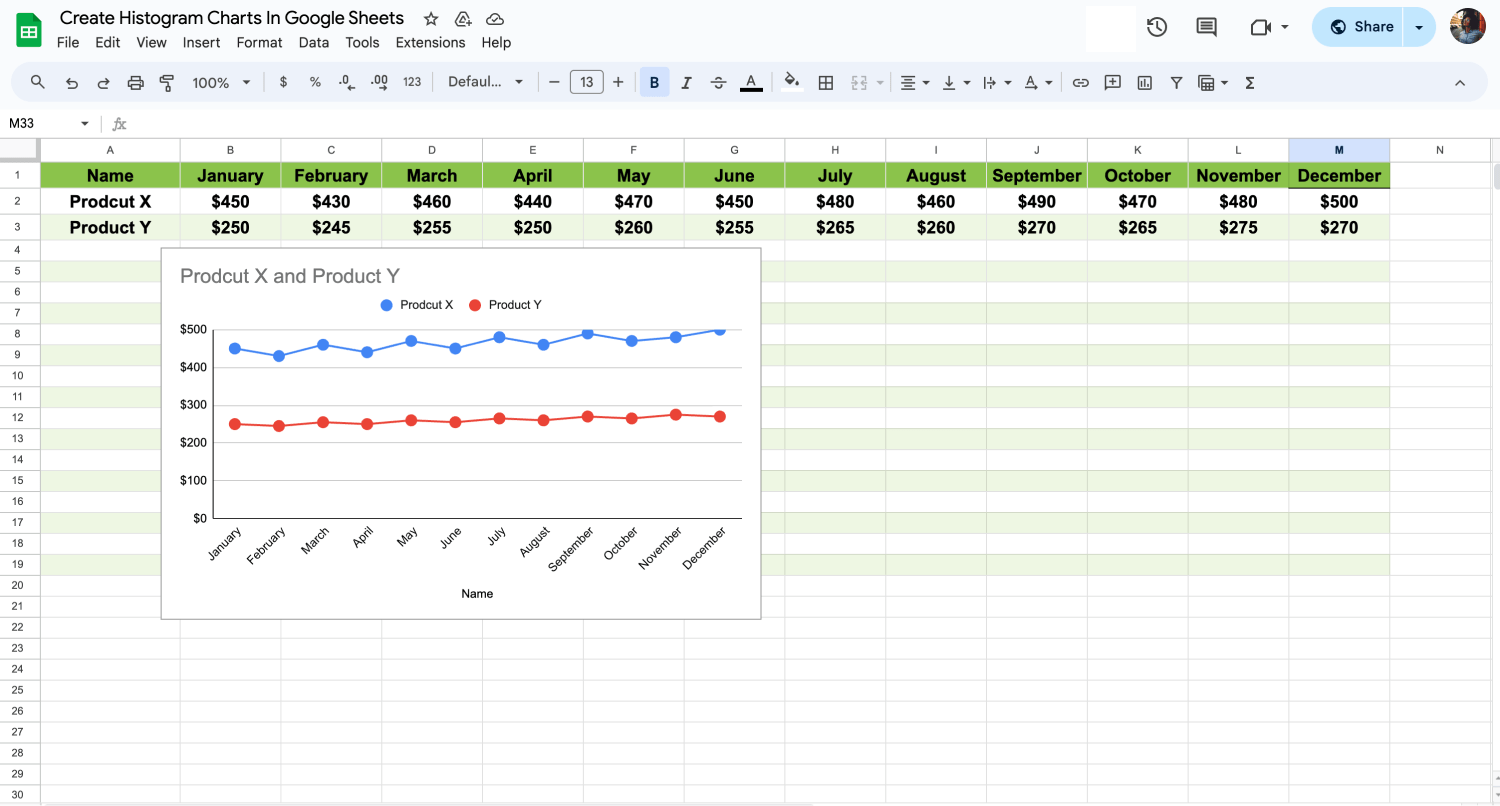
Customize the chart settings
The last step is to explore the Chart Editor's customization options. This is where you can truly personalize your histogram. Alter the bar color for a better visual effect, update the axis labels for clearer understanding, and place the legend where it makes the most sense. These customizations ensure your histogram is not only analytically accurate but also ready for any presentation.
By following these steps, you'll craft a meaningful histogram that clearly illustrates the distribution of your data, enhancing your analysis and decision-making process.

💡Learning how to make a dropdown menu in Google Sheets can streamline your data entry process, making it faster and more error-free.
Frequently asked questions about Google Sheets histograms
Exploring histograms in Google Sheets often leads to various questions, from creation to customization. Whether you're a beginner or seeking advanced tips, this section addresses the most common inquiries.
If you have any questions or doubts about the topic, we invite you to explore the Frequently asked questions we've compiled for you. This part of our guide is specifically designed to address common inquiries, providing you with a deeper understanding and clarity on the subject.
Oui, vous pouvez facilement créer un histogramme dans Google Sheets. Google Sheets fournit des outils intégrés qui vous permettent de visualiser vos données sous forme d'histogrammes sans avoir recours à des formules complexes. En sélectionnant vos données et en utilisant l'option Graphique, vous pouvez choisir le type d'histogramme et Google Sheets le génère automatiquement pour vous.
Pour transformer un diagramme à barres en histogramme dans Google Sheets, procédez comme suit :
1. Ouvrez votre graphique : Cliquez sur le diagramme à barres que vous souhaitez modifier. L'éditeur de graphique s'ouvre sur le côté droit de l'écran.
2. Accédez aux options du type de graphique : Dans l'éditeur de graphique, trouvez le menu déroulant Type de graphique.
3. Sélectionnez l'histogramme : Faites défiler la liste des types de graphiques et sélectionnez "Histogramme" parmi les options. Google Sheets adaptera automatiquement votre graphique à barres au format histogramme en utilisant le même ensemble de données.
4. Personnalisez (si nécessaire) : Après avoir transformé votre graphique en histogramme, vous souhaiterez peut-être ajuster des paramètres tels que la taille des godets ou l'étendue pour mieux répondre à vos besoins en matière d'analyse de données.
Bien que les deux types d'histogramme utilisent des barres verticales pour représenter les données, le contexte et l'interprétation de ces barres diffèrent considérablement :
- Les histogrammes indiquent le nombre de fois qu'un phénomène se produit.
- Les diagrammes en colonnes montrent comment différentes choses se comparent en utilisant des barres côte à côte.
- Vous pouvez utiliser les histogrammes pour voir les tendances dans les chiffres. Utilisez les diagrammes en colonnes pour comparer les choses.
- Les histogrammes présentent les données par plages. Les diagrammes en colonnes présentent les données pour chaque élément ou groupe.
La création d'un diagramme ou d'un graphique dans Google Sheets est très simple. Suivez les étapes suivantes :
1. Ouvrez vos données : Allez sur Google Sheets et ouvrez la feuille de calcul contenant vos données.
2. Sélectionnez les données : Cliquez et faites glisser pour mettre en évidence les cellules contenant les informations que vous souhaitez représenter sur le graphique.
3. Insérez le graphique : Cliquez sur "Insérer" dans le menu supérieur, puis sélectionnez "Graphique" dans les options déroulantes.
4. Choisissez votre type de graphique : Dans l'éditeur de graphiques situé à droite, vous pouvez choisir le type de graphique qui correspond le mieux à vos données. Google Sheets propose des options telles que les graphiques linéaires, les diagrammes à barres, etc.
5. Personnalisez votre graphique : Utilisez l'éditeur de graphique pour changer les couleurs, ajuster les étiquettes et modifier d'autres paramètres afin de rendre votre graphique clair et attrayant.
Les étapes suivantes permettent de créer facilement un histogramme dans Excel :
1. Préparez vos données : Organisez vos données en une seule colonne sur une feuille Excel.
2. Allez dans l'onglet Insertion : L'onglet "Insertion" se trouve sur le ruban en haut d'Excel.
3. Sélectionnez Histogramme : Cliquez sur "Insérer un graphique statistique" et choisissez "Histogramme" parmi les options proposées.
4. Ajustez votre histogramme : Excel crée automatiquement votre histogramme sur la base des données sélectionnées. Vous pouvez le personnaliser en cliquant sur le graphique et en utilisant les onglets "Conception du graphique" et "Format".
5. Modifiez les cellules si nécessaire : Pour modifier la plage ou le nombre de cellules, cliquez avec le bouton droit de la souris sur l'axe horizontal de l'histogramme, sélectionnez "Format Axis" et ajustez les paramètres des cellules sous "Axis Options".
Final words
Histograms in Google Sheets offer a dynamic way to analyze and understand your data. Whether you're in education, marketing, or data analysis, mastering histograms can transform raw data into actionable insights. This skill is invaluable for making informed decisions, identifying trends, and presenting data compellingly.
Through this guide, you've learned how to create, customize, and differentiate between histograms and other chart types in Google Sheets. We've covered everything from the basics to more advanced customization, ensuring you have a strong foundation. Your journey to becoming a data visualization expert is just beginning!
Behçet is a content writer at forms.app. He is a music producer and enjoys blending electronic and acoustic tunes. Behçet has expertise in Google Sheets, survey questions, and online forms.


 4 minutes de lecture