Using tools such as Google Forms is a skill everyone should develop to succeed in business. Knowing how to create forms in Google Forms and generate reports from Google Forms optimizes your workflow and increases your success in data collection. Therefore, learning how to use these programs as an employee increases your value for the company and makes your job easier.
In this article, we will cover why you need Google Forms reports and how to create reports from Google Forms. Furthermore, we will also talk about a better option that does not take as much time and effort as Google Forms. The better option, which is forms.app, will allow you to analyze your statistics and results faster and easier than Google Forms.
Why do you need reports?
Reports are a way of understanding how an organization works internally. Hundreds of reports, such as Google Forms expense reports, are created weekly for big organizations, and analyst teams always create new spreadsheets, come up with new question types, modify existing spreadsheets, and create new form templates to increase productivity.
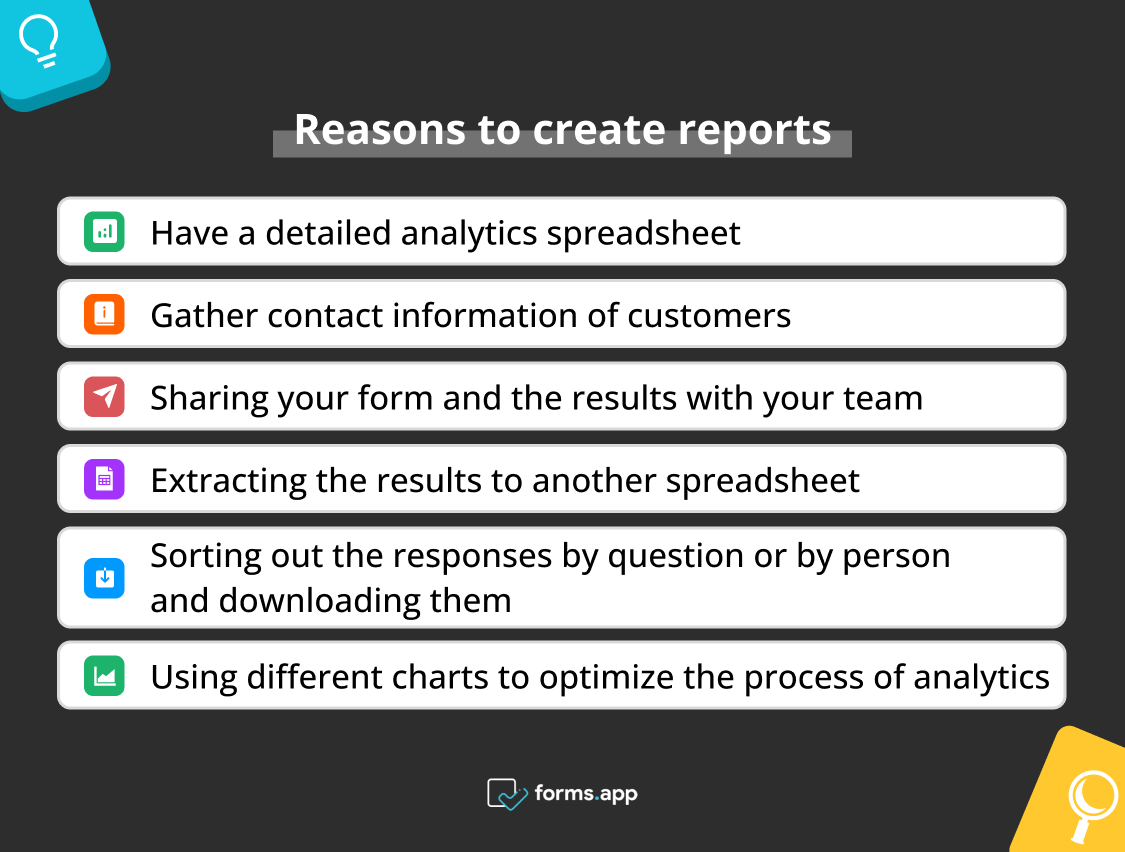
Google Forms offers one place to gather and analyze all this information simultaneously. There are additional reasons why companies need reports, such as:
Advantages of creating reports
➡️Have a detailed analytics spreadsheet
➡️Gather contact information of customers
➡️Sharing your form and the results with your team
➡️Extracting the results to another spreadsheet
➡️Sorting out the responses by question or by person and downloading them
➡️Using different charts to optimize the process of analytics
How to create reports on Google Forms (step-by-step)
Creating a report based on your surveys might be complex in Google Forms. However, we have gathered the basic steps for you to follow if you want to create a report with Google Forms. Here are the steps:
💡If you want to learn how to create a form on Google Forms on mobile, check out our article.
1. Create a new spreadsheet with your survey results
To create a new spreadsheet, you must open your form in Google Forms, select Responses at the top of the page, and click Create Spreadsheet export to Google Sheets to export your survey results.
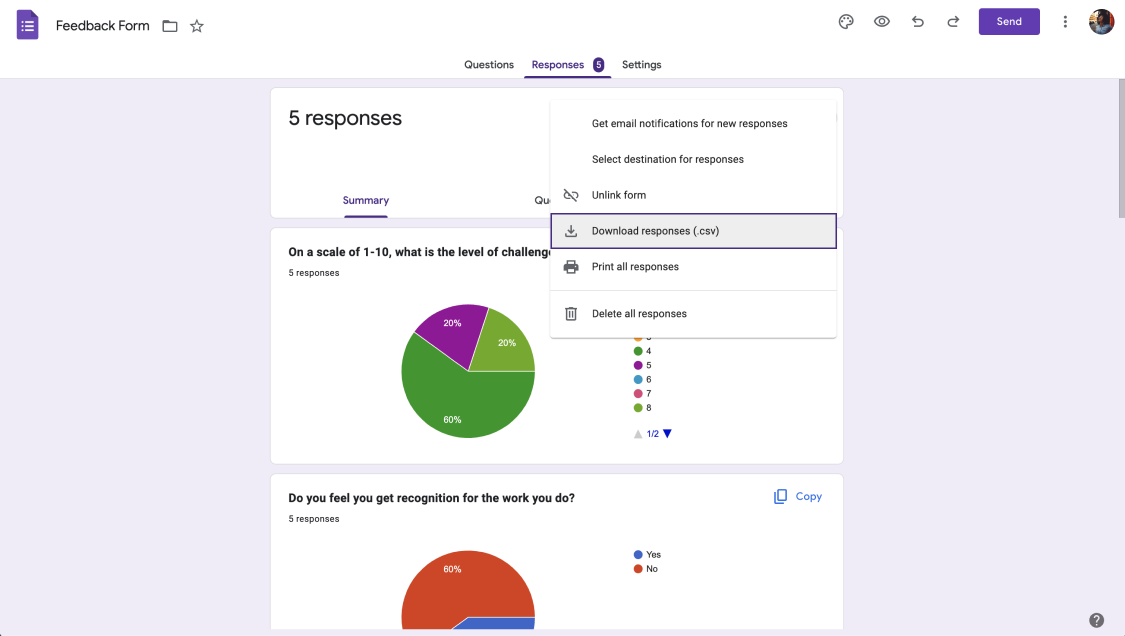
Download your responses
2. Create formulas and summarize your results
The second step you have to take is to select a range of cells within your spreadsheet and name them. That will allow you to create formulas to summarize your survey results. The spreadsheet shows that each question displays one survey question, and each row displays various answers to each question.
To generate a report, you need to give a name to each column on your spreadsheet. To do this, click Data from the toolbar and select Named Ranges. Afterward, type in the name of the range, and be careful not to give it a name with no spaces or punctuation or begin it with a number. Then click Done.
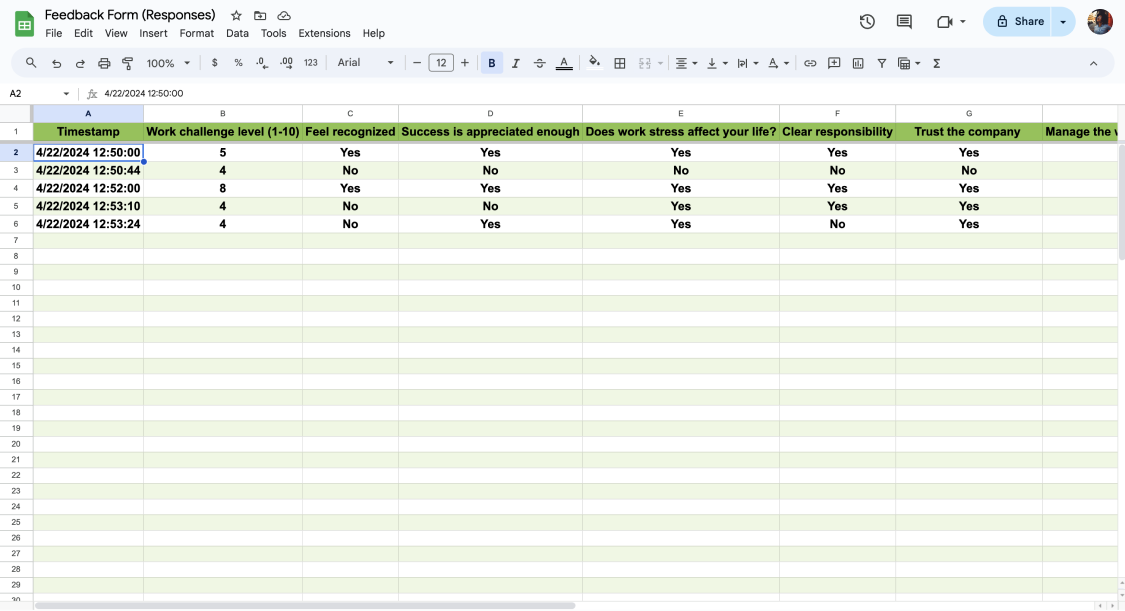
Customize the Sheets
3. List all the possible answers and calculate
Add a new sheet in your spreadsheet and list all the possible answers to your survey questions. Afterward, use the COUNTIF function in Google Sheets to calculate how many times a particular answer or data point occurred in a specific range.
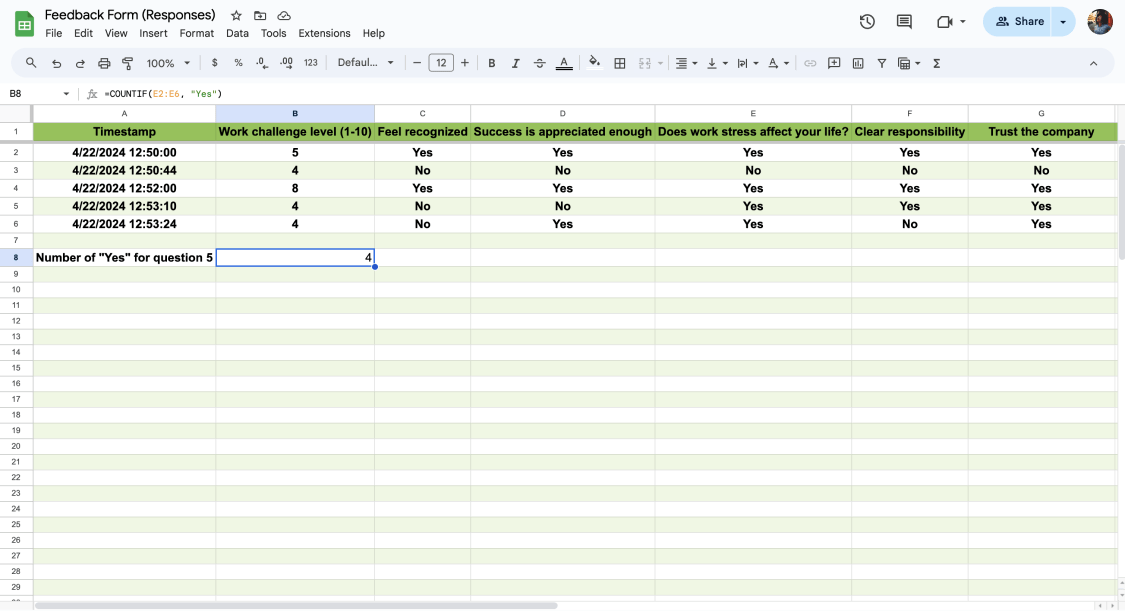
Apply formulas if needed
4. Create a chart
After calculating your answers using the COUNTIF function, you can highlight the data columns that you want to make a chart of, click Insert, and select Chart to reach the Chart Editor.
💡You can edit the type of chart you would like under the Setup tab and choose the one that suits your report.
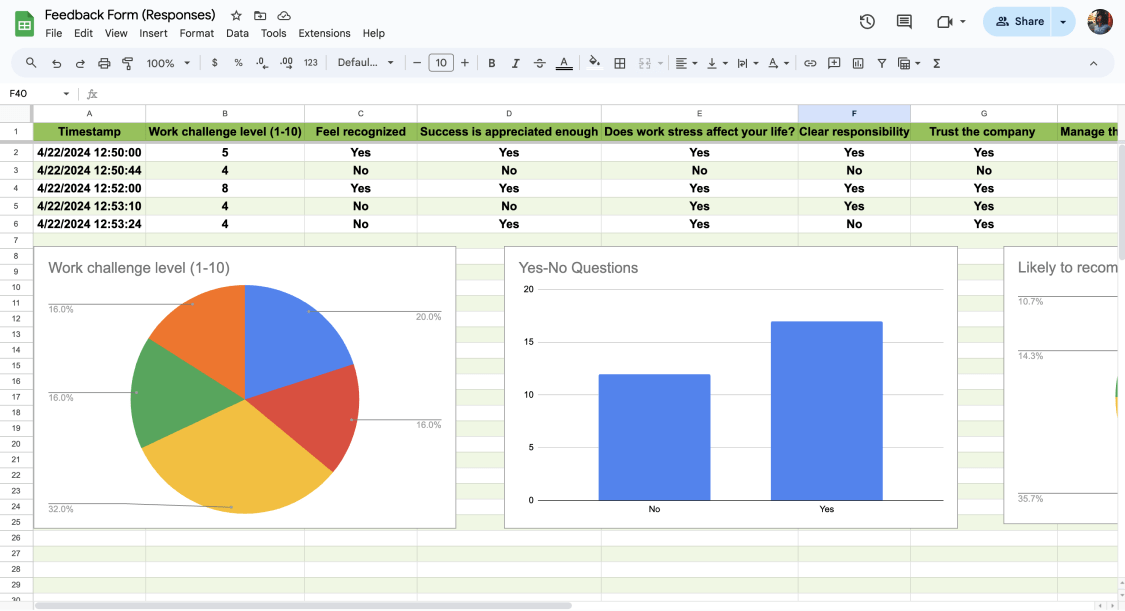
Create charts
You have a better option: forms.app
As you can see, learning to create a new Google Forms report is like learning a new language. It is hard to follow and even harder to remember. You must have a blank form, deal with formulas, and many other things. It is an outdated way of creating forms. Fortunately, there is a much better and easier way.
forms.app allows you to create forms from scratch and does not require additional skills. Simply follow the steps, and you have your form. Additionally, you do not have to deal with the report-building stage. The Results tab of our page allows you to see everything. You can also check out our survey report article to learn more about survey reports in general.
Statistics
Our statistics page lets you see everything without going through all the problems of memorizing formulas and creating separate spreadsheets. You can see all your general information at the top of the page, such as the number of responses, the number of views, the submission percentage, and the average submission time.
1. Devices
In the devices section of the statistics page, you can see which of the responses came from different devices. The statistics page also gives you a chart, so you do not have to bother to create one.
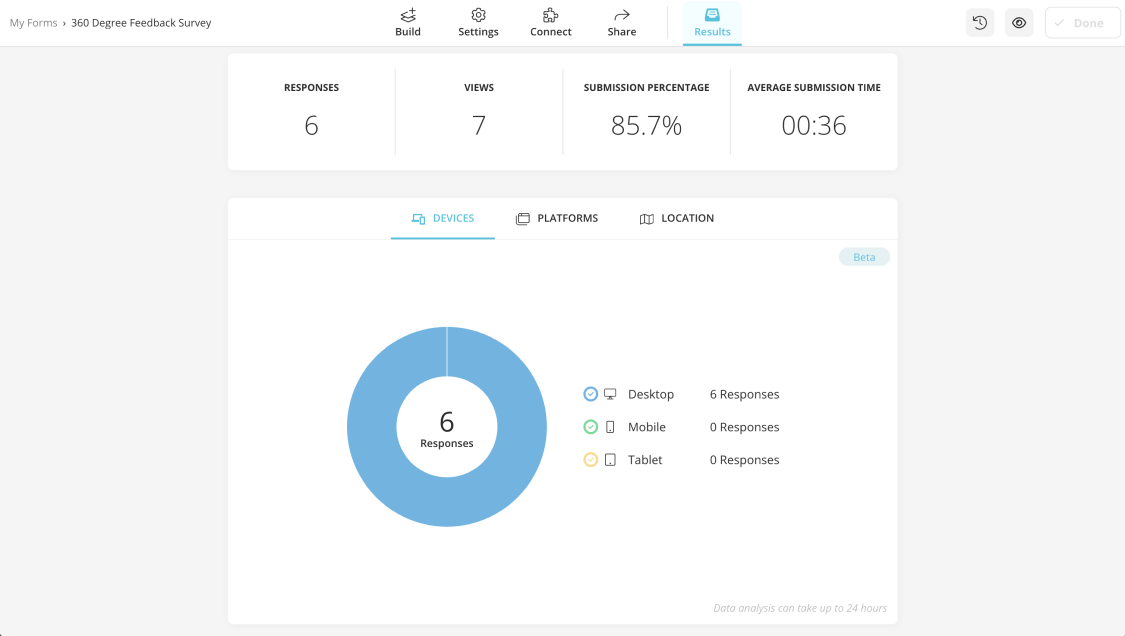
Check the respondents' devices
2. Platforms
The platforms section shows which browsers or operating systems were used to fill out your form. Furthermore, it shows how many responses come from each individual browser or operating system.
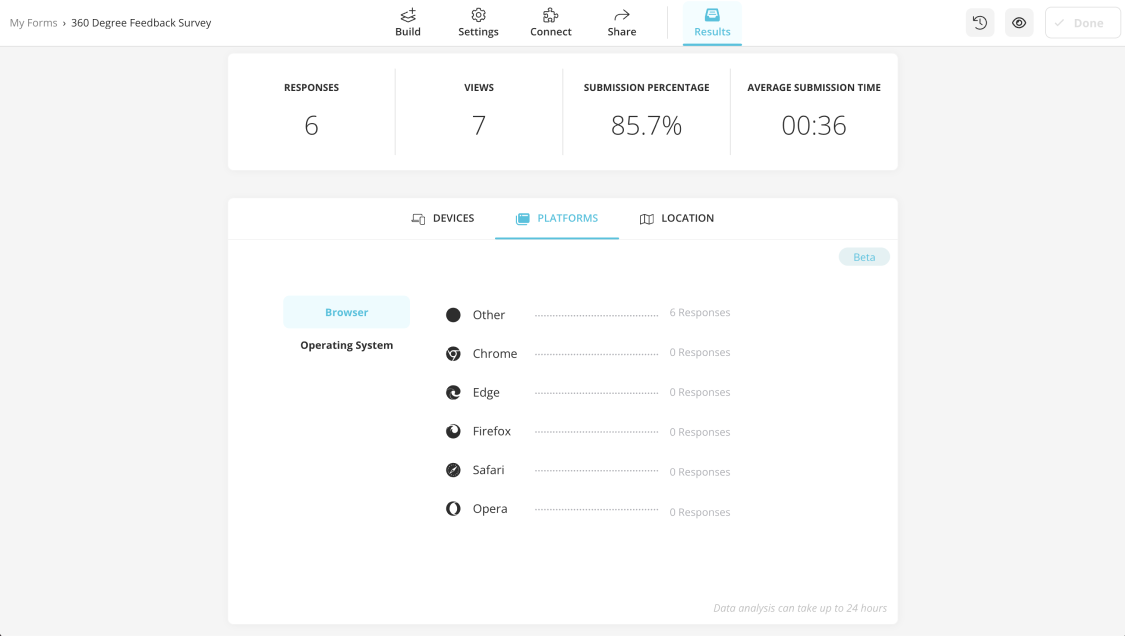
Check the respondents' platforms
3. Location
forms.app also allows you to see your participants’ countries. Within the location section, the world map allows you to see the popularity of your survey according to countries. It is also a great visual representation, so you can impress the people that you are presenting to.
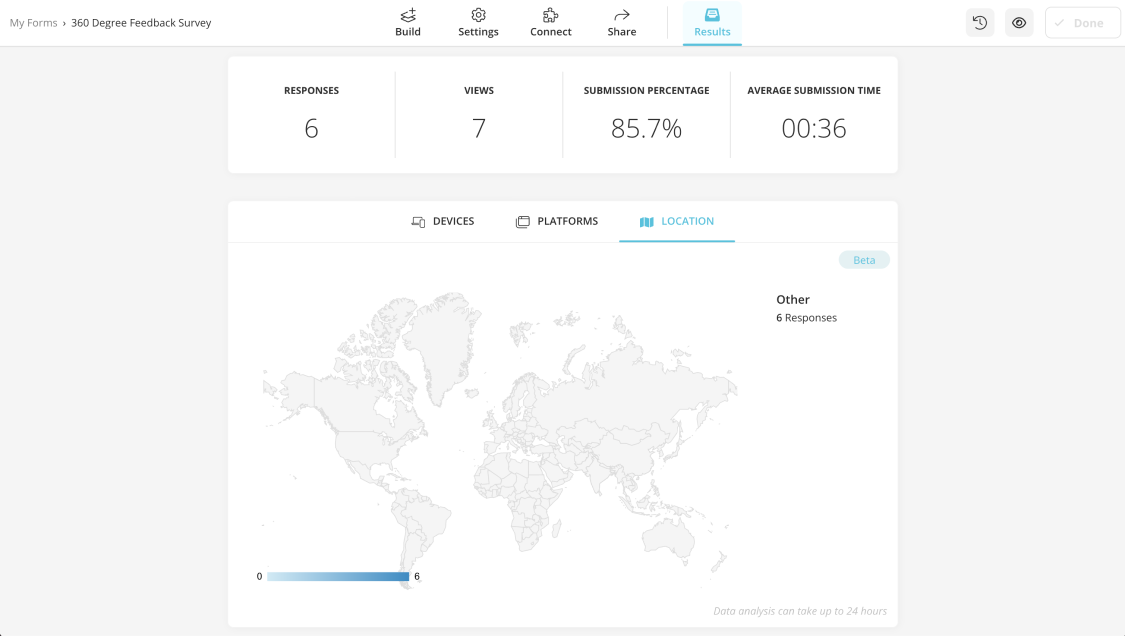
Check the respondents' locations
Responses
This tab allows you to see every individual answer that is given to a question, and you can also sort these answers based on a number of filters. Furthermore, you can then share these responses with your team, archive them, or write a personalized message to the participant who completed the survey.
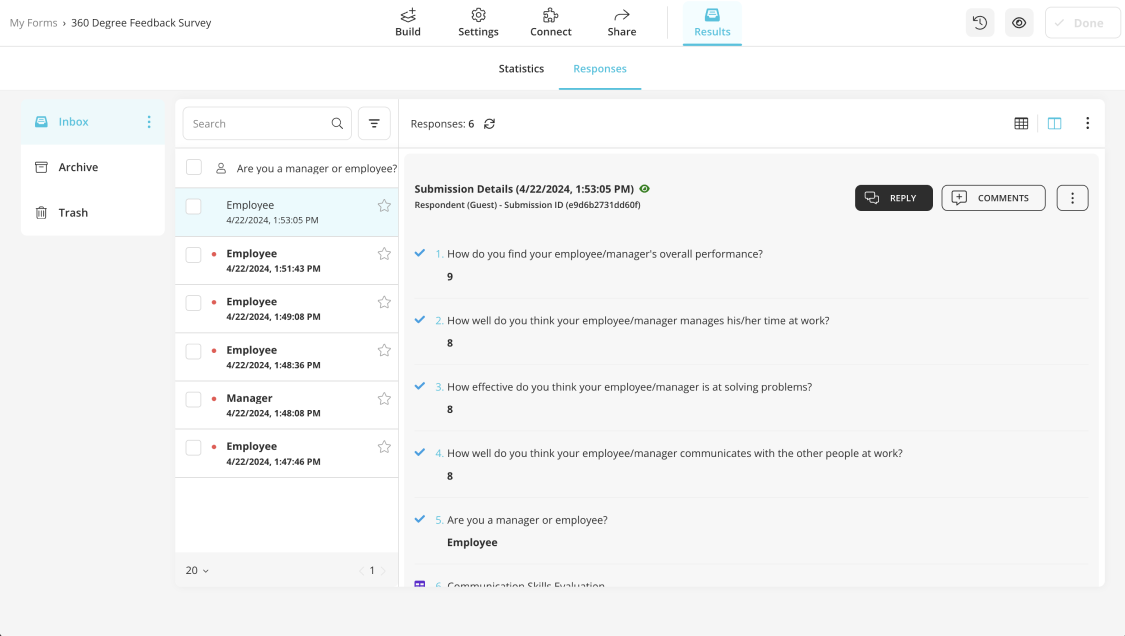
Check the respondents' answers
Final words
In summary, knowing how to use Google Forms and Google Sheets and making reports using these applications are great skills to have for your company. However, using these programs requires extensive knowledge of formulas and coding, and you must follow detailed steps correctly. All of these issues make it a hard task to create reports using Google Forms.
Therefore, using forms.app, with its extensive features and user-friendly interface, is better for optimizing your workflow. In this article, we have looked at why you need reports and how to create reports using Google Forms. Create one survey and one report using forms.app, and you will see the difference.
Yakup is a content writer at forms.app. He is also a skilled translator. His hobbies include reading, learning about different languages, and different branches of sports. Yakup's expertise lies in translation, NoCode tools, and Google Forms.
