The results of many studies can be quickly composed of incomprehensible numbers and metrics. Therefore, there is a need for a simplification method that even experts use in the field: data visualization. When data is visualized, you make this data more readily understandable by people who are not experts in their fields.
As a data visualization technique, you can use correspondence analysis. It allows you to better interpret the data by showing you categorical relationships. You can start by reading its definition to understand the correspondence analysis.
What is the correspondence analysis?

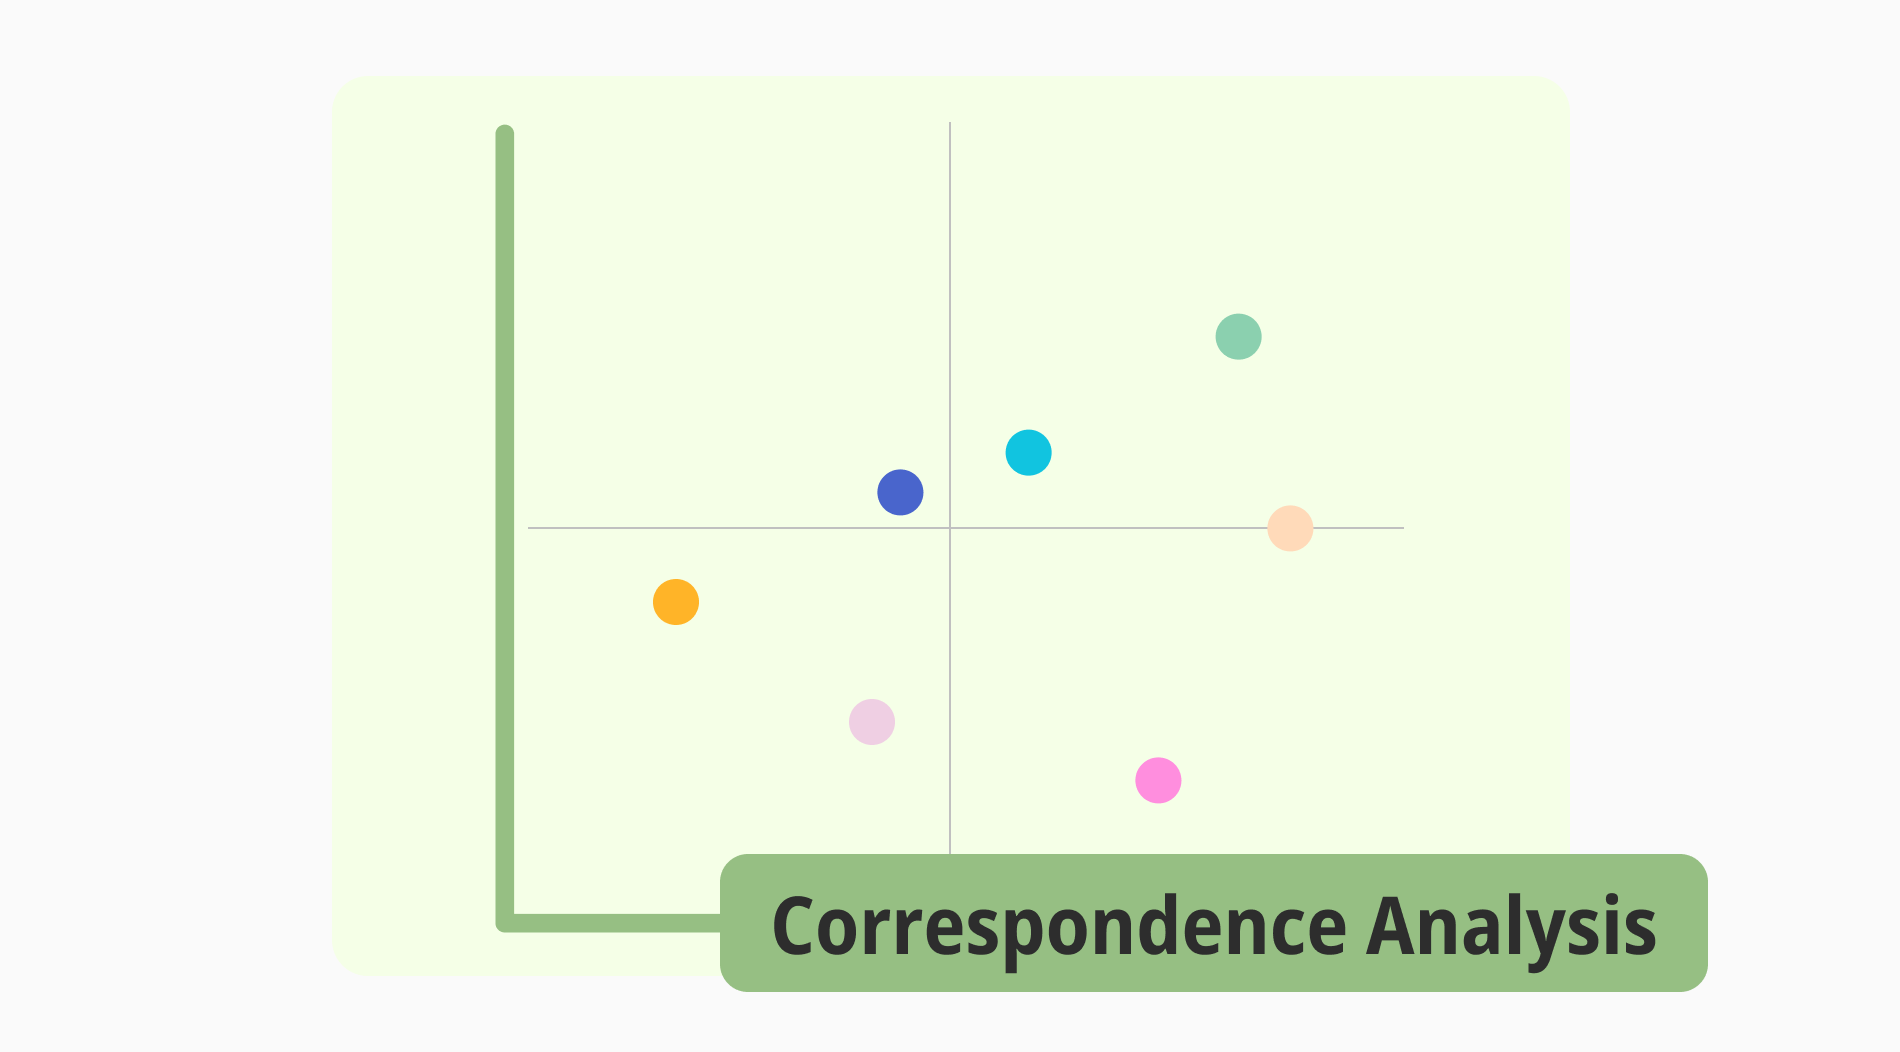
Correspondance analysis is a statistical data visualization method used to show patterns and explore relationships between categorical variables in the data.
It combines two or more than two data points on a two-dimensional axis and forms a graph. It allows the emergence of the infrastructure by using it in exploratory data analysis research. It is most commonly used in the fields of ecology, sociology, health, and education, and especially in market research and finance.
Correspondence analysis (CA) is generally accepted as a part of the multivariate analysis and mainly provides qualitative data. There are several variants of it. The most known ones are detrended correspondence analysis (DCA) and canonical correspondence analysis (CCA). The first one is used mainly by ecologists when there is sparse data.
The latter is used to reveal possible reasons for similarities between variables. There is also multiple correspondence analysis (MCA) or, interchangeably, multivariate correspondence analysis. This is actually the same type of analysis, except that it includes many categorical variables.
The Correspondence Analysis: Explained
Here, we will explain step by step how correspondence analysis works and how data visualization is performed. First of all, you can create a contingency table by applying correspondence analysis to your dataset. You continue the analysis by calculating the eigenvalues from the contingency table. You then transfer the coordinates of the categories you examined to the two-dimensional plane.
The coordinate of rows and columns reveals the principal components. You can place categories in a scatterplot to better visualize them. All that remains is to examine the emerging clusters, patterns, and relationships. Simply put, close points mean related to each other, and distant points mean less related. Of course, you can do this with software tools and speed up the process. You can also add visual aids and annotations to important points by using additional tools.
How to use the correspondence analysis for measuring brands
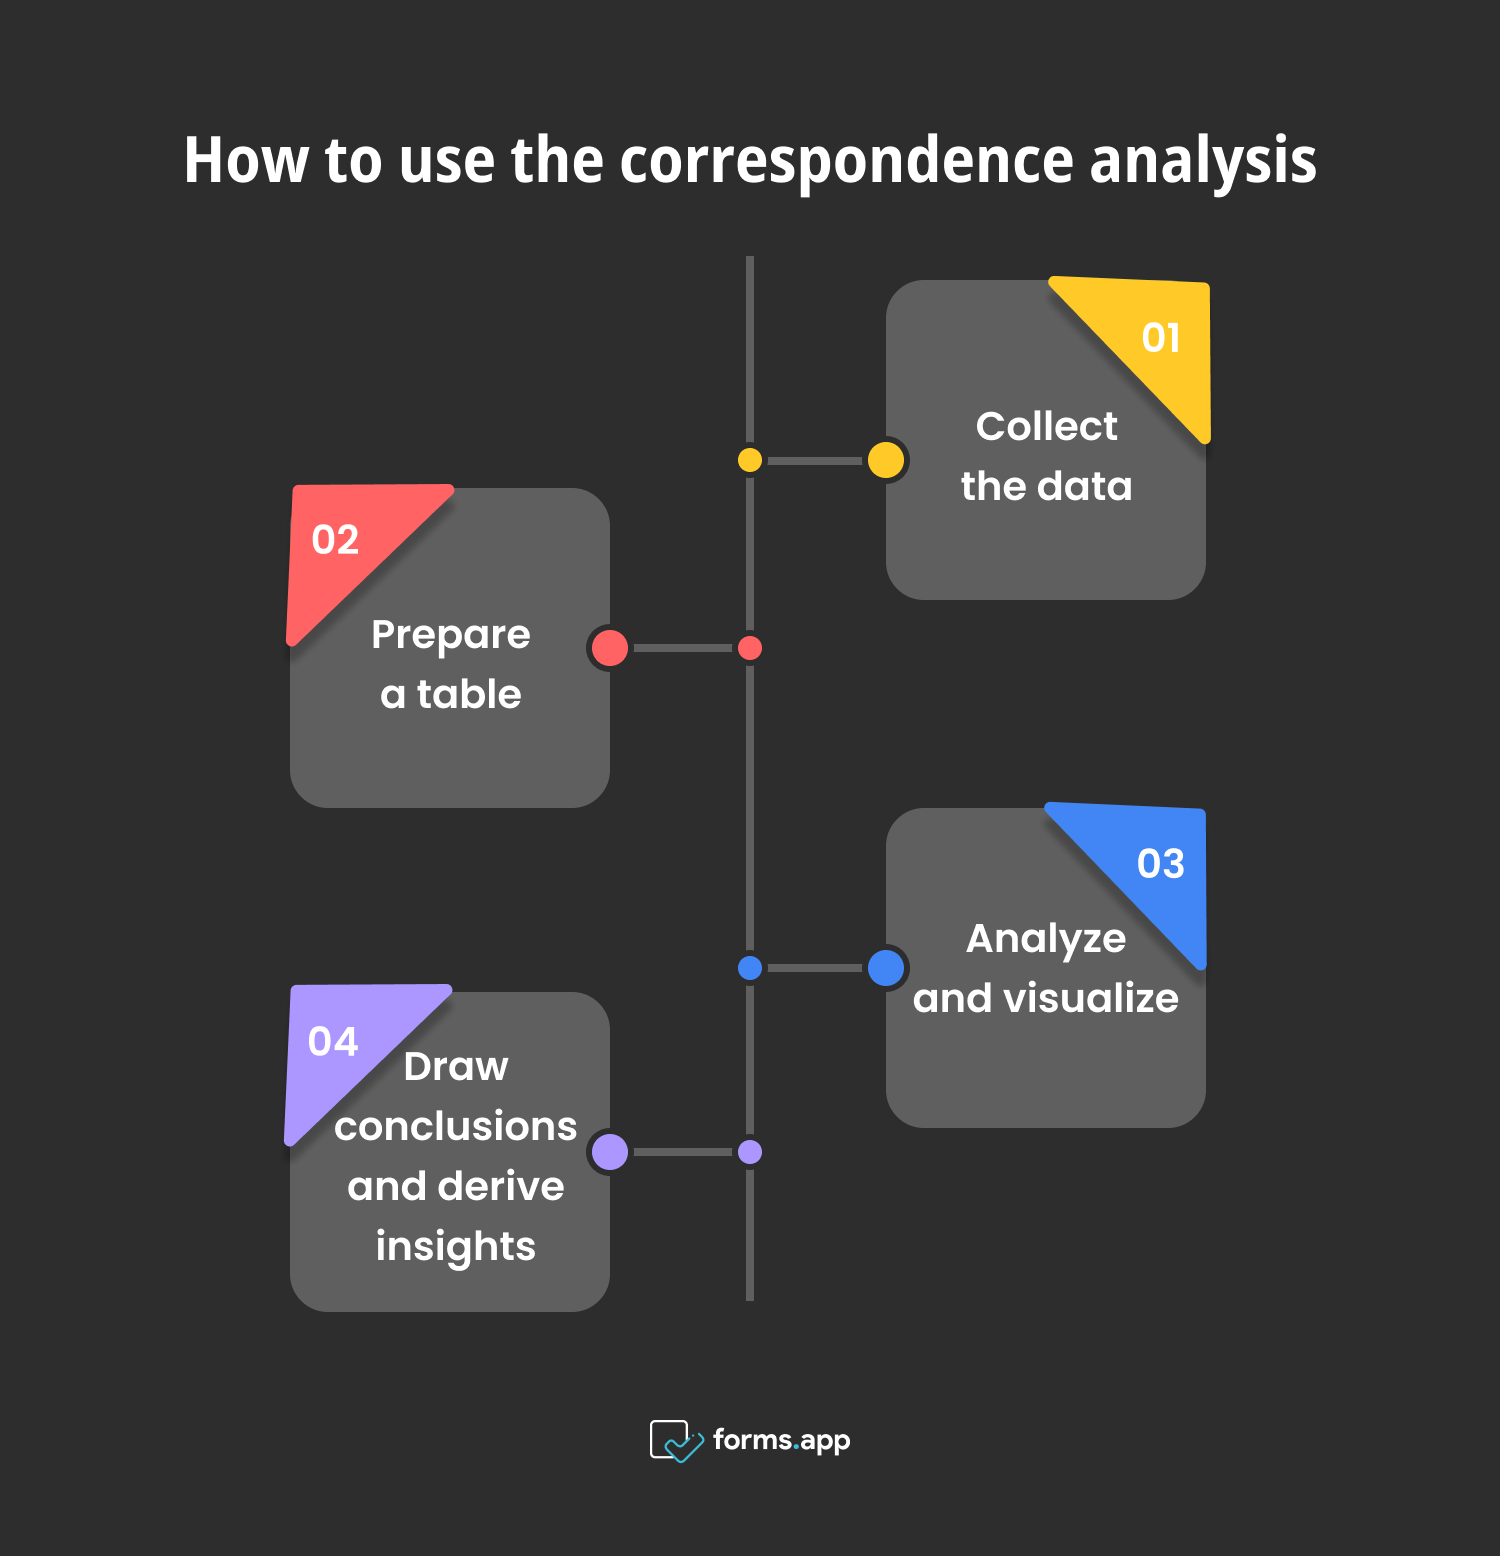
Correspondance analysis is a simple analysis type that you can complete in a few steps. Although the example here will focus specifically on brand measurement, you can adapt it to different areas. Approximately four or five steps are sufficient for an analysis to take place; these steps are:

How to use the correspondence analysis for measuring brands
1. Collect the data: You first need data to measure the variables and similarities between brands and reveal their characteristic structure. If you ask what these data are, it should be product/service features, brand earnings, recognition, customer comments, etc.
2. Prepare a table: You can create a contingency table and sort the brands according to their features. According to the data you obtain, you place the pros and cons of each brand in the table.
3. Analyze and visualize: In this step, you analyze the contingency table you created by using analysis tools and programs. In this step, correspondence analysis moves the event to a two-dimensional plane. You can use techniques such as principal component analysis (PCA) to reduce dimensionality. Thus, you can now visualize the relationships between brands and features based on your initial data.
4. Draw conclusions and derive insights: Conclude your analysis by interpreting the results that the study reveals. Understand the nature of brands and decide what purposes these results can help you with.
Example of the correspondence analysis
For example, imagine that there is a phone brand that is developing a new smartphone model. They want to improve their products, take into account customer demands, and maintain a successful campaign. For this, they tried to use correspondence analysis. First of all, since they needed to collect data, they conducted a survey with customers and listed the models of different brands that were similar to their own models.
In the survey, they asked them to note the features of each model, such as price, battery life, camera, screen size, weight, etc. The results of this survey were then transferred to a contingency table. By analyzing this table, the relationship patterns with the features of the models were revealed. The phone brand is now in a position to decide which features of the model they have developed should come to the fore by making a skillful interpretation.
Use cases of the correspondence analysis
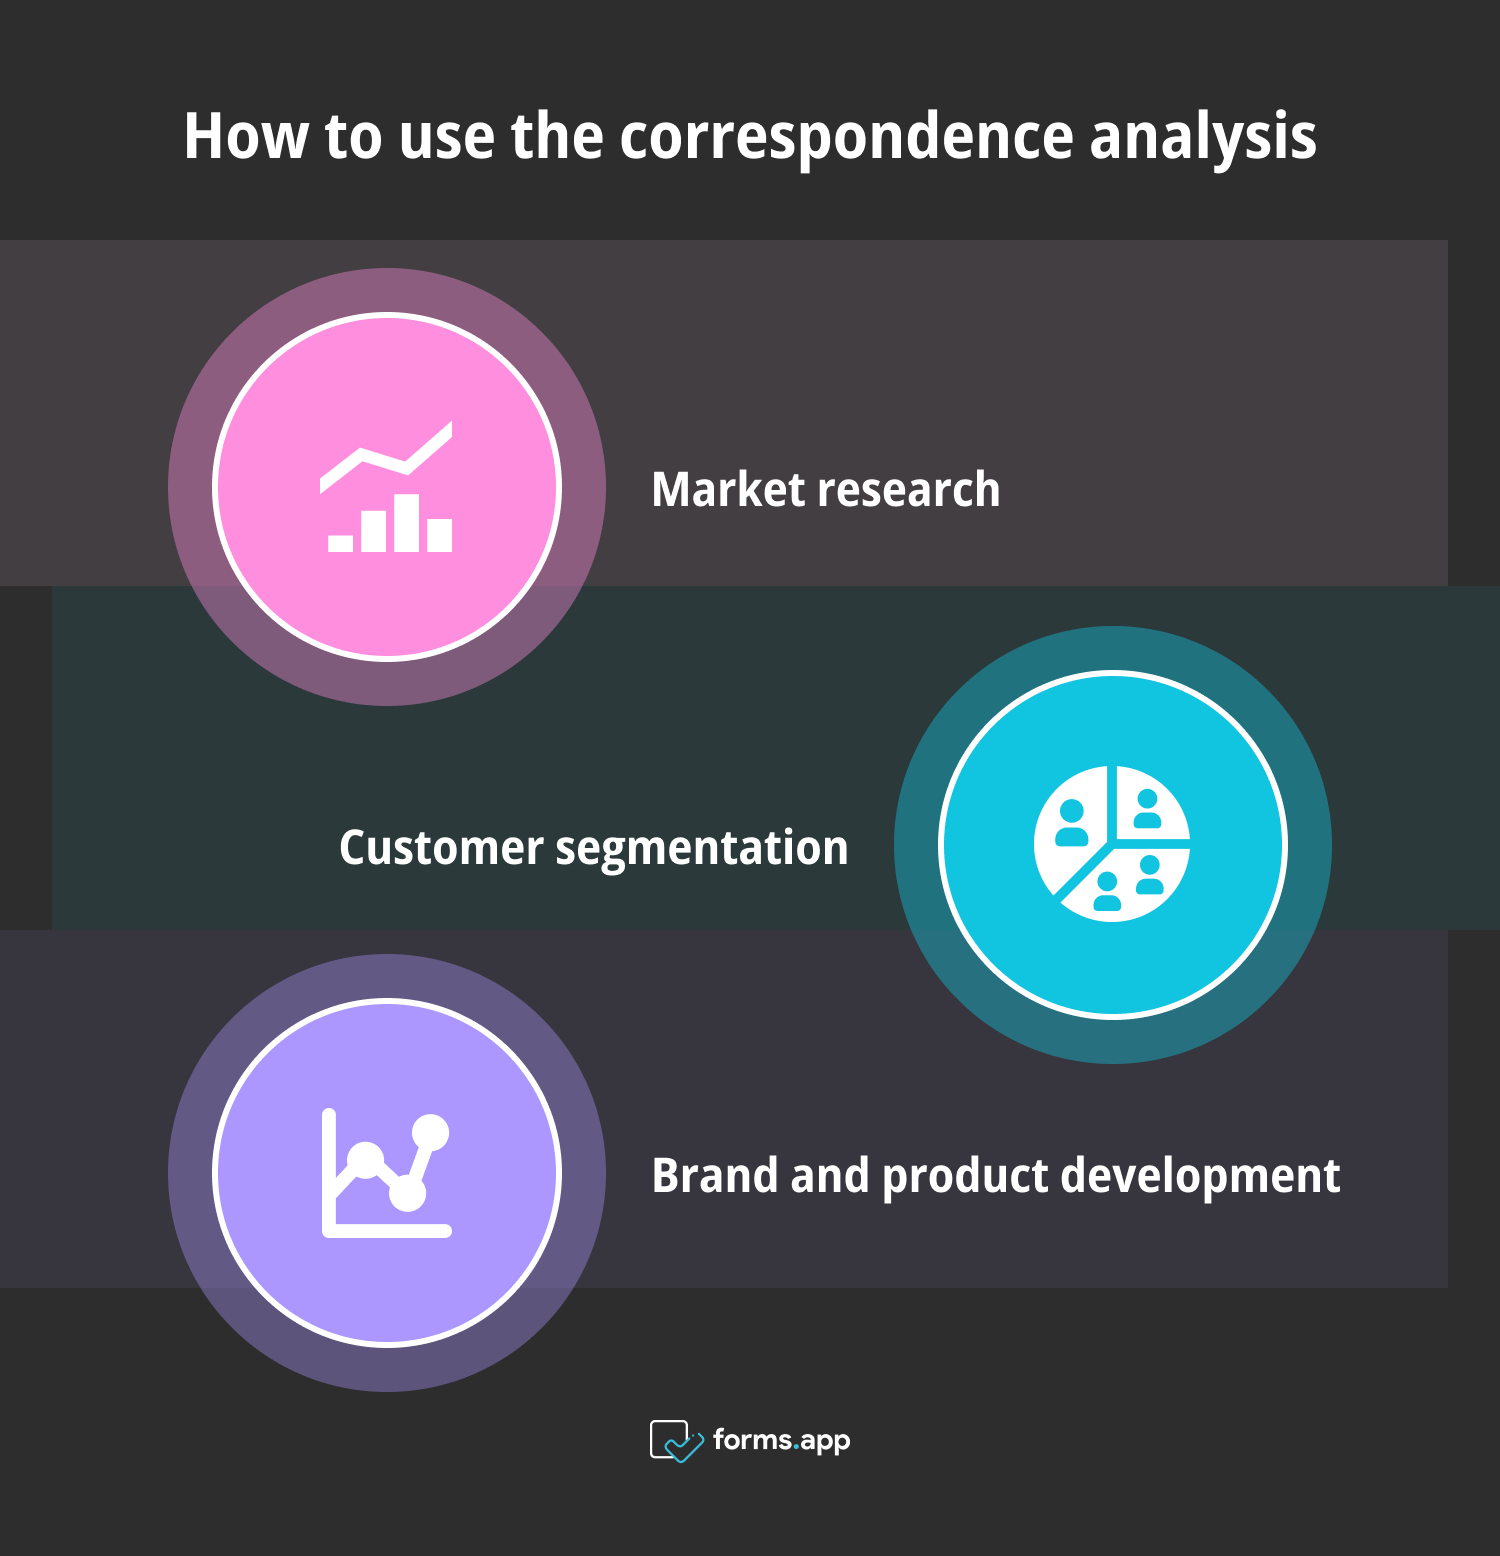
Correspondence analysis is a technique that allows you to make data visible and use it in many disciplines. Therefore, always keep in mind that it can be used for different purposes, but do not forget that it is generally preferred in the field of finance and marketing. Now, to list some common use cases:

Correspondence analysis use cases
- Market research: You can use correspondence analysis in market research to understand market trends and customer preferences. You can learn detailed information about different brands and their products and services.
- Customer segmentation: It is essential to understand your customers in order to take better care of them, meet their demands better, and put your business in a better position. With correspondence analysis, you can reveal the differences and similarities between customer profiles and segment them into groups.
- Brand and product development: In relation to market research, you can use analyses and graphs to make your brand and products the best.
Pros & Cons of correspondence analysis
Correspondence is a method that has both pros and cons with its analysis scope, usage, results, and return:
Pros
- The main purpose and benefit of the analysis is that it perfectly shows the relationships between categories.
- Correspondence analysis does not reveal anything new; it only reveals what is. Thus, it is preferred because it visualizes and simplifies.
- It is suitable for creating hypotheses.
- The analysis is objective because it is a process of calculating data points.
- It helps you understand the total variance about the number of variables necessary for a comprehensive analysis and provides insight into the standard deviation of the dataset along each dimension.
Cons
- The data collection part of the analysis must be complete and consistent. Likewise, if there is an error when placing this data in the table, the entire analysis will also give an error.
- There may be cases where the interpretation of the analysis is misunderstood. This is especially observed in tables that are dense and contain a lot of data.
- Studies where the data sample is small may not yield tangible results.
- Since it focuses on categorical variables, examining data with continuous variables may not yield results.
- Although it is present in the data, it may not always capture a good amount of variance when reflecting this data.
Frequently asked questions about correspondence analysis
This part is prepared to get answers to your questions about correspondence analysis easily.
L'analyse factorielle des correspondances est une méthode statistique qui combine l'analyse des correspondances et l'analyse factorielle. Comme l'analyse des correspondances examine les variables catégorielles, vous pouvez également examiner les variables continues grâce à l'analyse factorielle. Cela sera particulièrement utile dans les tableaux de contingence et les ensembles de données complexes.
En statistique, le terme de correspondance est utilisé pour désigner la relation entre des variables catégorielles.
L'analyse des correspondances est fréquemment utilisée dans l'analyse multivariée car il s'agit d'une technique statistique multivariée par nature. Elle est particulièrement utile pour examiner les grands tableaux de contingence dans l'analyse multivariée.
Le chi-deux est une méthode de test statistique utilisée pour mesurer les données et leurs distributions. Pour que ce test soit appliqué, il doit y avoir une relation entre les lignes et les colonnes afin que le test le prouve. D'autre part, l'analyse des correspondances est une technique de visualisation des données. Elle n'applique aucun test, mais elle réduit le nombre de dimensions dans les données et révèle la relation entre les variables dans l'espace bidimensionnel.
Key points to take away
As a result, correspondence analysis is a considerable technique that visually reflects the relationships between categories. Businesses and other research fields can gain important insights using it. In this article, the definition of correspondence analysis is given to you so that you can understand it perfectly.
Appropriate steps on how to use it were shared, and a correspondence analysis example situation was presented. Finally, it was concluded by listing the usage situations and its positive and negative aspects.
Atakan is a content writer at forms.app. He likes to research various fields like history, sociology, and psychology. He knows English and Korean. His expertise lies in data analysis, data types, and methods.
Table des Matières
- What is the correspondence analysis?
- The Correspondence Analysis: Explained
- How to use the correspondence analysis for measuring brands
- Example of the correspondence analysis
- Use cases of the correspondence analysis
- Pros & Cons of correspondence analysis
- Frequently asked questions about correspondence analysis
- Key points to take away


 5 minutes de lecture

