Have you ever wondered how to find hidden patterns and relationships in complex data? What is being done about those who are overlooked among so much information? It is factor analysis that helps you to answer these questions.
It helps you to simplify and organize data sets. If you want to solve mysteries with this data analysis method and get useful information, we recommend you read this article properly. Start by reading about factor analysis with a simple definition!
Let’s start with the basics: What is a factor analysis?
Factor analysis is a statistical analysis method used to simplify a large number of variables into a smaller, more manageable set, making research data easier to handle.
The key concept of factor analysis is a factor. A factor is a latent or underlying variable that is extracted from a set of variables that can be directly measured. For example, any question you ask in surveys contains an observable variable.
But another concept that emerges from the relationship between these questions is a value that cannot be observed but can be found only by inferences. Factor analysis is used to understand the structure of such a complex data set.
Why to use factor analysis
Anyone familiar with the world of data analysis knows that turning large amounts of data into useful information is a difficult task. In such cases, you need an effective method, such as factor analysis, to gain insight. If you are wondering why and how this approach will be beneficial to you, you can read the reasons below:
- Dividing the dataset with too many variables into smaller sets.
- Measuring and graphing complex concepts more easily by identifying the data dimensions.
- Building the structure of the data by revealing lost and overlooked data among the data pile.
- Producing more consistent results by revealing overlooked information necessary for the interpretation of data.
- Possibility to perform either an exploratory or confirmatory type of factor analysis, whether you start with a specific hypothesis or not.
A step-by-step guide to the factor analysis
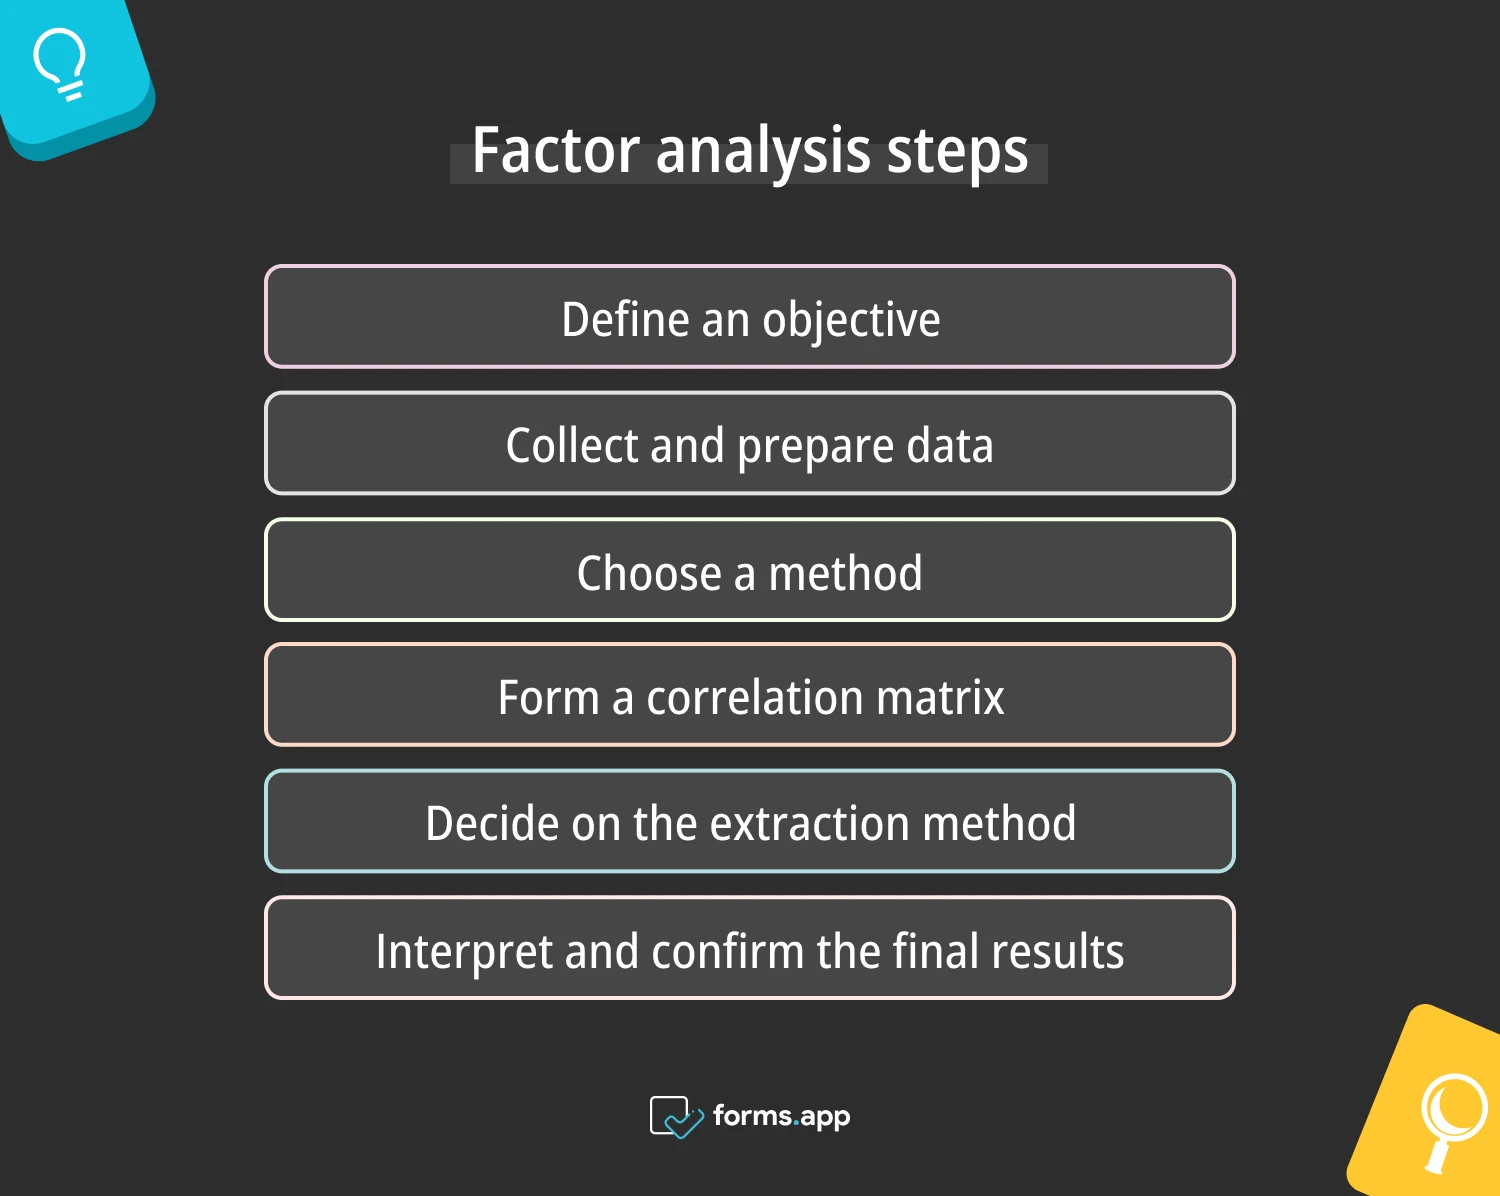
Performing any analysis is a long process with many steps. Factor analysis is no different from these. You should always proceed step by step so that you have a strong analysis structure. Below, you can read the steps that factor analysis generally follows:

Steps for factor analysis
1. Define an objective: You can create an initial hypothesis to test through the analysis. However, apart from this, factor analysis will also reveal information beyond your expectations.
2. Collect and prepare data: You can obtain the data that best suits your purpose from surveys, interviews, or website data. Then, digitize this data for processing.
3. Choose a method: There are two main methods of factor analysis: confirmatory and exploratory analysis. Exploratory factor analysis is done without an assumption; if you have an initial hypothesis, you should perform confirmatory factor analysis.
4. Form a correlation matrix: The correlation matrix creation phase comes after the method. This is one that comes after the method of the most critical steps of the analysis. The matrix is the basis for extracting factors by showing the correlation coefficients between pairs of variables.
5. Decide on the extraction method: This step can be called the dimension reduction step. Use principle component analysis if you want to summarize the principal components in measurements while preserving as much of the total variance of different measurements that measure data as possible.
But if you think that the factors are correlated with each other, then using principal axis factoring allows you to discover the factors according to shared variance. After this process, determine the number of factors for your data.
6. Interpret and confirm the final results: In the end, a situation like this should emerge: each of the factors should correspond to one of the main variable sets. According to these relationships, you should make an appropriate interpretation of the data and try to understand the underlying reasons for these results.
Of course, you also need to test whether these matches are correct. This way, you can understand whether the result of the analysis is correct or not.
Factor analysis examples
Imagine a statistical method that can be used by many different disciplines, from psychology to economics, from education to health. This method is factor analysis. This useful statistical technique streamlines complex data sets by reducing many variables to essential factors. Thus, it provides clearer insights and more manageable data. Now let's take a look at factor analysis with examples from situations you may encounter in real life:
Market research example
A smartphone company is curious about the attitudes and opinions of its customers toward its latest models. They prepared a survey asking customers about various aspects such as the quality of their phone models, price, and support services.
Factor analysis groups these many different product evaluation criteria and gathers them under an umbrella term. For example, "product complaints" and "churn rate" could be one of these groups, or there can be a much broader term like “customer satisfaction.” By examining these factors, the company can decide in which area it needs to strengthen.
Education example
An educational institution will prepare its curriculum annually. But this job is much more multidimensional than it seems. Many questions need to be answered, such as how many students will be in the classes, the number of teachers and their salaries, whether the classroom equipment is complete, and how the lesson hours will be.
Factor analysis collects these problems under several different terms, allowing them to approach events more easily. For example, they can be combined under factors such as “financial needs,” “lessons,” and “teachers.”.
Human resources example
A company’s hiring process can sometimes become complex. For this reason, human resources want to benefit from statistics and list the variables that are important in hiring. Data is collected from different aspects of business life, such as salaries and raises, career opportunities, workplace culture, and compensation.
Then, by finding relationships between these variables, they can be grouped under a broader factor, such as job satisfaction.
Frequently asked questions about the factor analysis
In this section, you can find short and effective answers to the questions you are wondering about.
The definition of factor analysis in research is basically a statistical method used to group variables into factors to reveal unobserved relationships. These factors are called latent variables, and they can only be inferred from the observed data. It is an excellent way to reduce the complexity of datasets and better understand data structure.
- Reducing the number of variables: Its most important contribution is that it prevents information from being lost in the data chaos. Categorizing variables prevents information from being overlooked.
- Revealing unobserved structure: The biggest problem, especially in large datasets, is that there are some inconsistencies in the relationships between patterns. This may be due to not examining all the data in detail. These unobserved structures can be revealed easily with factor analysis.
- Developing hypotheses or tools: The data must provide you with sufficient results to develop a hypothesis. Or, if you do not know much about the content of the surveys or interviews you will prepare for your research, the analysis should help you with these. Factor analysis is great in this job to assist you.
As in every analysis, the beginning of factor analysis is data collection and classification of this data into datasets. After this, the relationships and patterns between variables are examined. In order to discover unobserved variables from observed variables, the first factors are found using a method such as the common factor analysis technique. These factors are then rotated. Finally, the rotated factors are examined, and the hidden structure is tried to be revealed.
Conclusion
All in all, factor analysis is a perfect tool for simplifying large volumes of data and uncovering latent variables. Businesses, organizations, and researchers use this analysis technique to improve their decision-making processes. The article starts with the factor analysis definition so that you can understand this technique. Then, five points are listed as to why you should use this analysis.
All the steps you need to perform factor analysis are presented in a short and effective way. Finally, a few examples of factor analysis are given to strengthen your understanding of the subject. From now on, you are ready to make better analyses because you have gained a grand knowledge of factor analysis.
Atakan is a content writer at forms.app. He likes to research various fields like history, sociology, and psychology. He knows English and Korean. His expertise lies in data analysis, data types, and methods.


