Today's business world has only one keyword, which is data. If you want to be successful, you should definitely utilize data analysis. However, don't worry; whether you are new to data analysis or looking to understand more about it, this guide will help you in each step of the process.
We will start with the general definition of the data analysis process and continue with why you should do it, how to do it, and what the steps are. At the end of the article, you will be able to turn data into actionable insights!
First things first: What is a data analysis process?
The data analysis process is a series of steps aiming to turn raw data into useful information.
It is arguably the main pillar of the decision-making process in businesses and organizations. It has several steps, starting with defining objectives, collecting data, cleaning data, conducting the analysis, and interpreting the results. The ultimate purpose of this process is to have the data answer a specific question like “What did happen in this event?” or “Why did it happen?”.
Importance of the data analysis process
First of all, it is very normal to think about why you need this whole data analysis process at first. You may have questions such as, would it be a problem if this step was missing, or would these steps make me successful? The answers to your questions are given in the following items:
🔮 Predicting future trends: Data analysis is used to identify patterns. These patterns often help businesses to understand and predict future situations.
🎯 Optimizing your workplace efficiency: You can always reach optimal values by closely monitoring the status of your employees and your business in general with data analysis.
🔎 Market research: You can learn about the situation of your competitors, the supply-demand situation of the market, trends, and more through data analysis and take appropriate actions accordingly.
🚨 Risk management: You need to urgently find out where the mistake was made in order to prevent your problems or solve them immediately. That's why data analysis is an ideal tool for finding things that are going wrong.
How to start a data analysis process?
Although the beginning may seem a little difficult for those who are not used to the data analysis process flow, once you get used to it, you will see that each process and method is carried out through approximately the same steps. There are some critical points to keep in mind before starting your data analysis process, these are:
- Mistakes can happen, but learning from your mistakes is a must to develop further.
- Remember that situations such as researcher bias should be avoided.
- Always note down what you have done. When you make a mistake, it is always good to turn back at your notes and determine which step is wrong.
- Collaborate and report your steps and findings with your teammates if you are working in a team.
- Beware of data security issues. If you are in the international market, know the legal restrictions of the relevant countries.
- Improve yourself in statistics, modeling, and machine learning. Try to benefit from artificial intelligence as much as possible because it will make things faster.
Data analysis process steps
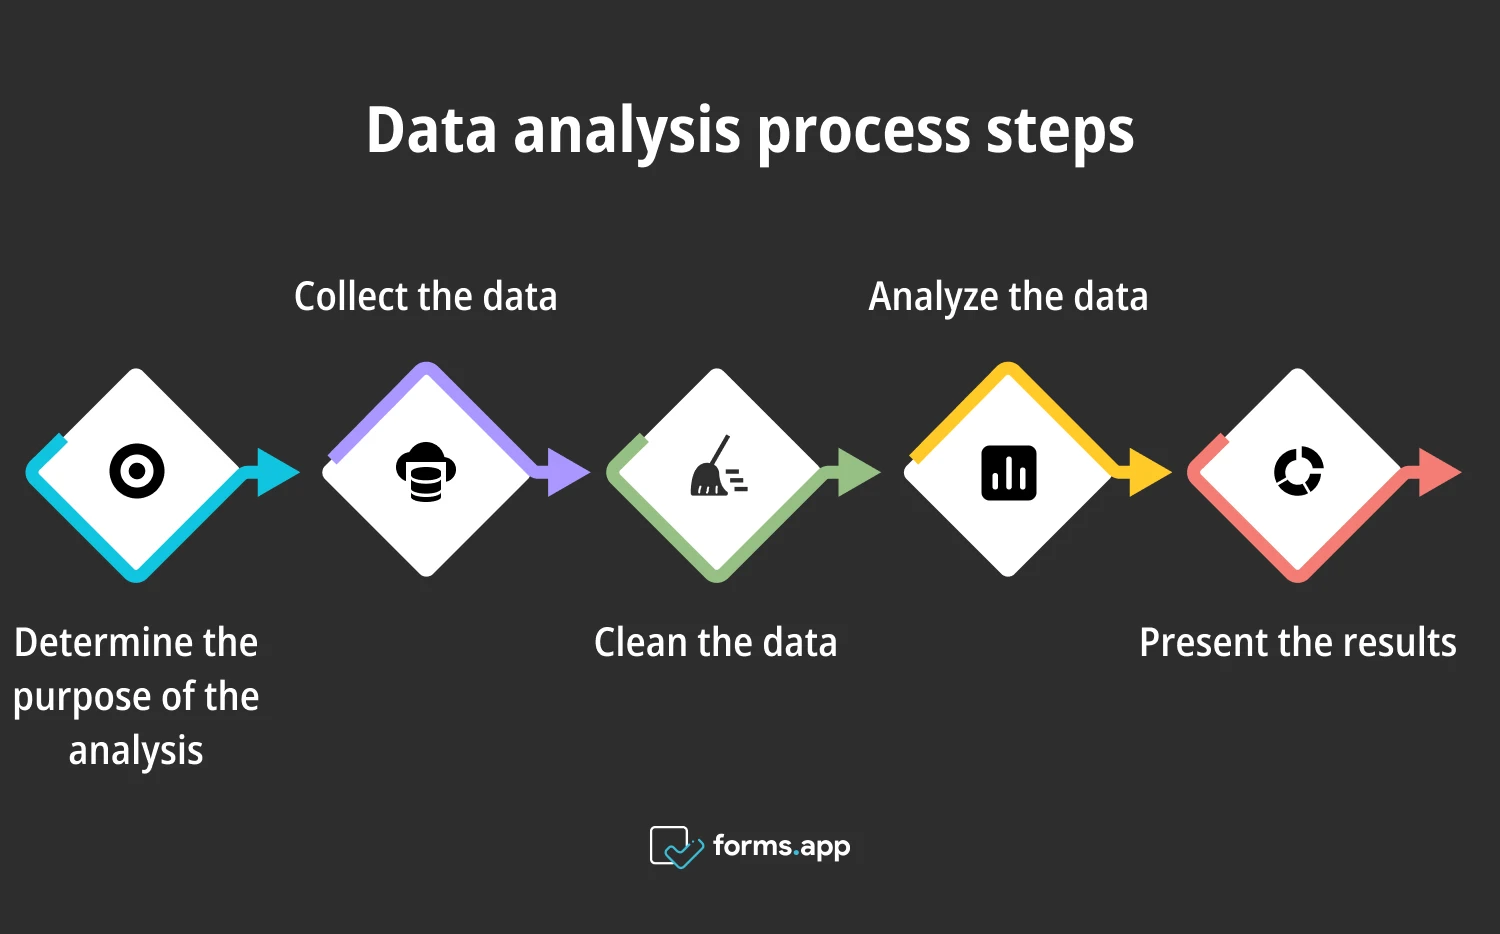
The data analysis process is a journey, and there are some things you need to do before, during, and after the journey. This is important both for the journey to go well and for you to reach your destination without any problem. There are roughly a few steps in the data analysis process diagram you should follow:

Steps of data analysis process
1. Determine the purpose of the analysis
This step is often known as the problem statement. You should come up with a hypothesis and consider how to test it. For example, consider a situation like this: You have a few stores and constantly lose customers. Then you may have the following hypothesis: This situation happens because customers are unsatisfied with your stores. Find a topic where you can establish a cause-and-effect relationship, just like this.
2. Collect the data
Now, things are starting to get a little trickier. First, understand the type of the data. For example, there are quantitative and qualitative data analysis processes. Quantitative data is data containing numbers, while qualitative data is data containing subjective thoughts. Qualitative and quantitative research questions are different, so they are easy to differentiate.
Apart from data type, there are three categories in data collection. They are first-party, second-party, and third-party data. First-party data is what you collect directly from your customers. Second-party data is organized data from another company.
Third-party data is unorganized data from various sources (social media, interviews, games) by a third-party organization. Eventually, if you collect data yourself, you will need data mining knowledge, data management tools and programs, or a data analyst to work for you.
3. Clean the data
What is more difficult than finding data is finding suitable data. It can be very time-consuming but a must for the research process. Therefore, you need to classify the collected data and eliminate those that do not meet the criteria you are looking for. Erroneous, incomplete, and duplicate data should be discarded immediately. You should spend a particularly long time on this step because the backbone of the entire analysis process depends on what you do here.
4. Analyze the data
The analysis is another part where you must choose from the options. These options are different data analysis techniques. At its most basic, analyses are divided into four parts: descriptive(to describe the situation), diagnostic (to understand the situation), predictive(to foresee future situations), and prescriptive(to get meaningful insights).
5. Present the results
You should present the result of the analysis in a very simple way that can be seen and interpreted. For this, you can use tools and programs to visualize your data so that both you and the others understand it better. The important part here is to interpret the result correctly and take action.
Even if your data analysis is completely perfect, there is always room for error. However, in a well-done analysis, this is such a small proportion that the result is completely compatible with the real world.
Frequently asked questions about the data analysis process
This article provides a general overview of the data analysis process. To gain more detailed information and focus on the areas that interest you most, consider checking out our frequently asked questions section.
Each data analysis process may go through different processes depending on the purpose of the research, techniques used, and the nature of the data. For example, a data analysis process in qualitative research will have fewer numbers than in quantitative research. Now, in a typical data analysis process, there are stages such as:
- Define what is your goal to solve with the analysis.
- Find relevant sources and collect data.
- Clean data and make corrections.
- Analyze the data with a data analysis method.
- Use data visualization to show results in a visible way.
- Interpret the data and report the results.
The four pillars of data analysis are descriptive, diagnostic, predictive, and prescriptive analysis. To explain them in order, descriptive analysis is a method used to reveal what happened. Diagnostic analysis is the next method used to reveal why it happened. Predictive analysis is used to understand future trends. Lastly, prescriptive analysis involves an interpretation of the result beyond predictive analysis.
The four Ps of data analytics are purpose, preparation, processing, and presentation. They are stages of an analysis process. First, one should have a purpose and an aim to fulfill. Then, one should prepare for the analysis by finding, collecting, and cleaning the data. Later, one should process the data and analyze it using various methods and tools. Lastly, one should present the findings and results visually or written.
Key points to take away
All in all, the data analysis process is all you need if you want to turn raw data into insightful information. You must proceed carefully through each step of this process and perform the steps appropriately. Create a perfectly reportable result by using data analysis methods effectively. This article showed you the way to data analysis; all that remains is to start doing an analysis for your business.
Atakan is a content writer at forms.app. He likes to research various fields like history, sociology, and psychology. He knows English and Korean. His expertise lies in data analysis, data types, and methods.


