A scale of measure is a categorization that reflects the kind of information contained within the variables’ values. The four primary types of measurement are nominal, ordinal, interval, and ratio. Each of the four scales provides a unique set of data.
Interval data and the interval scale may be used for a wide variety of purposes in the fields of data management, statistics, and marketing research. This article will examine the definition of interval scale in research, characteristics of interval scale, interval scale examples, and frequently asked questions about interval scale.
What is the interval scale?
The interval scale is the third of four measurement levels. The interval scale is a metric scale that represents quantitative values. Interval data not only relates to measurement categorization and ordering but also defines that the distances between each value on the scale are equal.
The intervals between data on an interval scale are equal and constant, but there is no genuine zero point. The value zero has no meaningful significance. As a result, ratios and real magnitudes cannot be calculated simply from the scale.
The interval scale collects and measures data where the distance between two points is equal. The scale indicates the degree of difference as well as the rank and order of the values gathered from market research or types of survey questions.
In Layman’s terms, the interval scale is a metric scale that represents quantitative values. An interval scale may always be separated into equal part scales, rulers for measuring length, and for measuring time intervals.
Characteristics of interval scale
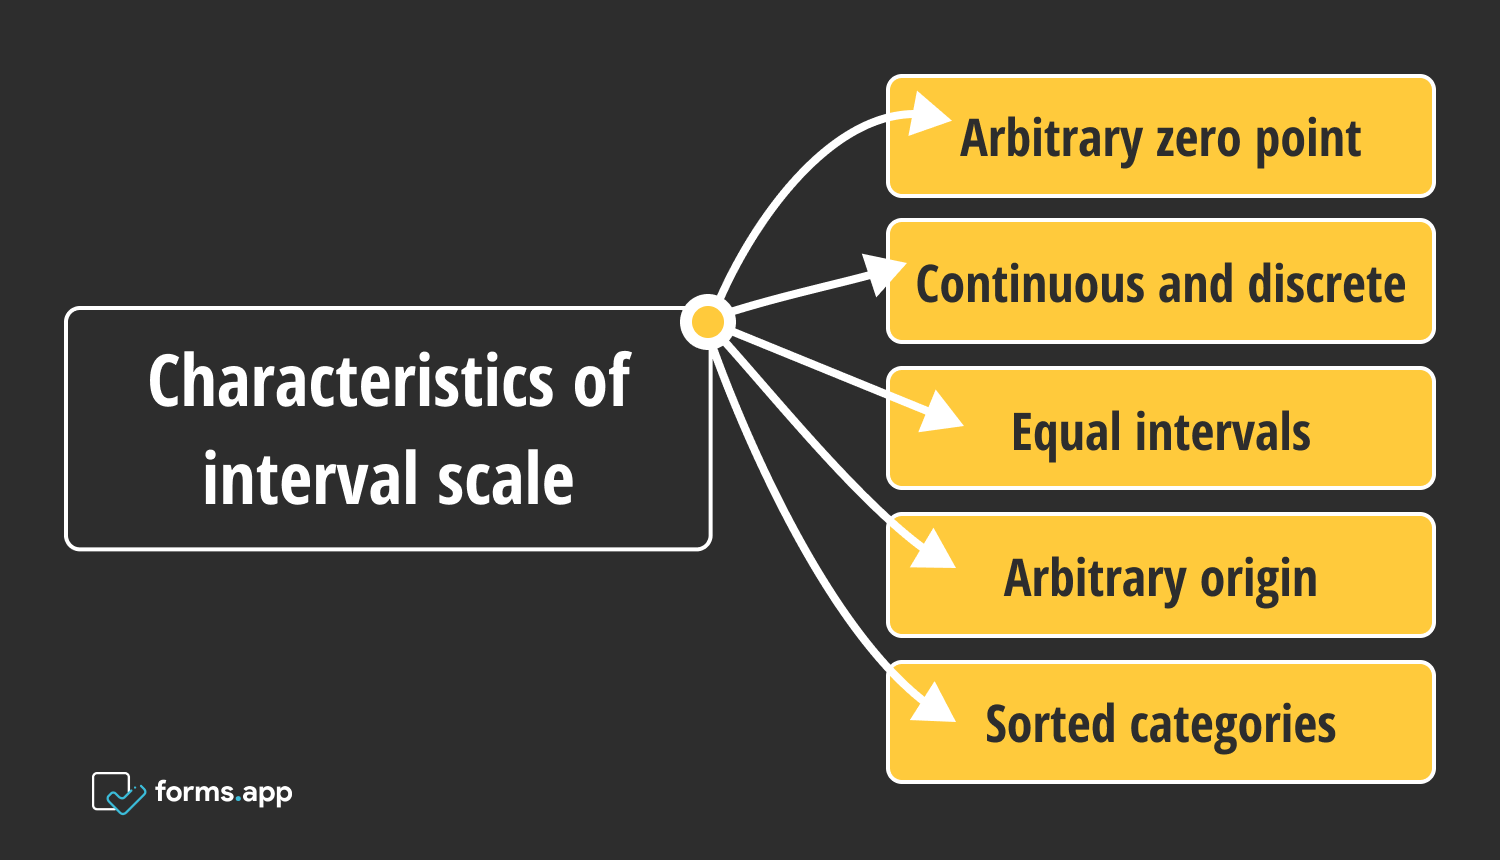
Interval data is a type of data that is measured along a scale, with each point at an equal distance from the others. Interval data always takes numerical values in which the distance between two points on a scale is standardized and equal. Some of the characteristics of the interval scale are as follows:
- Arbitrary zero point: An interval scale lacks a meaningful zero point. This implies that a scale value of zero does not imply the lack of the measured property.
- Continuous and discrete: Interval scale measurements can be both continuous and discontinuous. Continuous data is made up of values that can take any conceivable value within a certain range, whereas discrete data is made up of values that are particular and distinct.
- Equal intervals: On an interval scale, the intervals between various values are equal.
- Arbitrary origin: The interval scale’s origin or beginning point is arbitrary. It has no particular meaning or relevance in connection to the trait being assessed.
- Sorted categories: The ordering of categories or values is possible with interval scale data. It allows for value comparisons to identify which is bigger or lesser, but it does not offer information on the size of the difference between values.

Interval scale characteristics
Examples of interval scale
The absence of a genuine zero in interval scales makes determining how many times higher one number is than another difficult. As a result, the interval scale only shows the direction and difference of the numbers, but not their percentage or connection. Here are some interval scale examples:
- Time: When measured throughout the day, time passes is an excellent example of interval data. Because they are equidistant and quantifiable, the numerals on a clock are on an interval scale. For example, the difference between 3 and 4 o’clock is the same as the difference between 4 and 5 o’clock.
- Temperature: The temperature in Celsius or Fahrenheit is considered interval data since “0” is arbitrary. Therefore, 0°C and 0°F cannot be read on a thermometer. However, when measured in Kelvin, this is not the case. There can be no temperature below zero degrees, Kelvin, “0” is absolute for Kelvin.
- IQ test: IQ is an excellent example of interval data. According to psychological research, it is not possible to have an IQ of 0. In addition, IQ is calculated using a defined measuring scale.
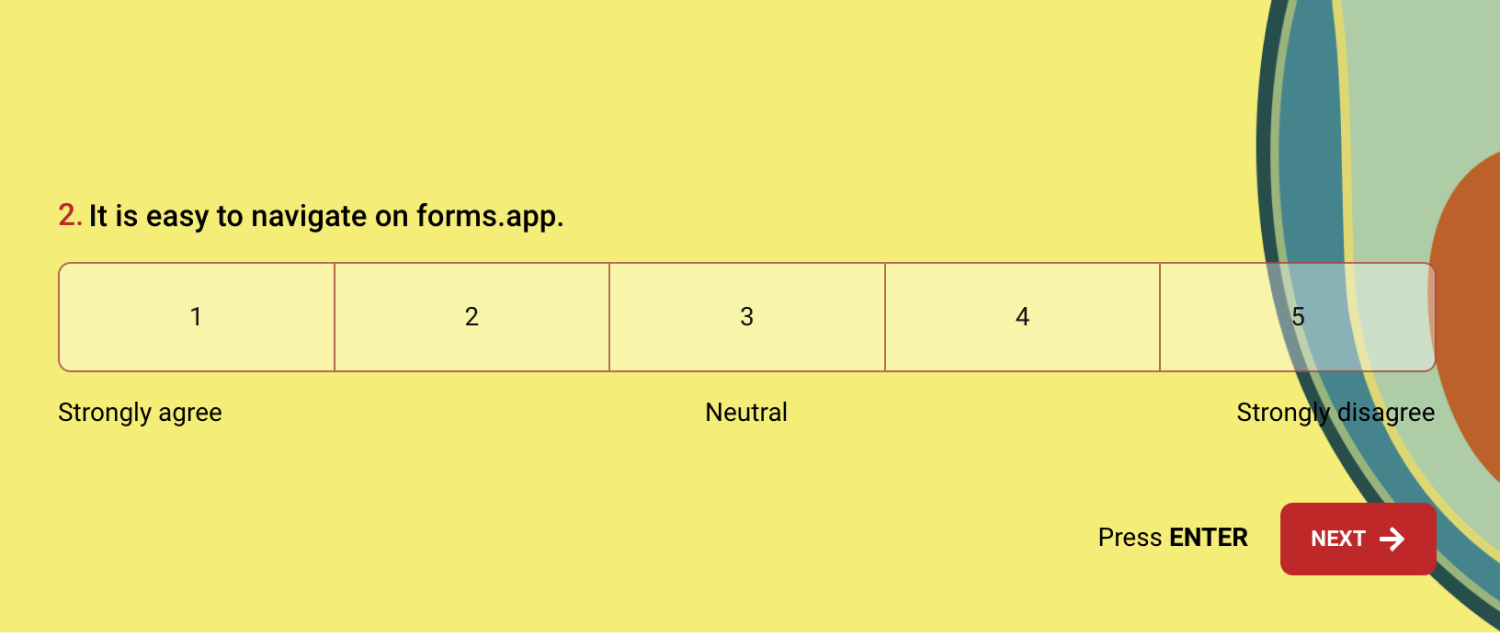
- Likert scale: A Likert scale question type typically presents a statement to the respondent and asks for a person’s degree of agreement with the statement by picking a point on the scale. The levels of satisfaction vary from severely dissatisfied to extremely satisfied.

An interval scale question example
Frequently asked questions about the interval scale
An interval scale may provide significant mathematical value to your opinion and feedback surveys. There are so many confusing questions about the interval scale. We have examined the questions about the interval scale:
The interval scale and the ratio scale are two quantitative scales that are used to quantify variables in research or statistics. While they have certain similarities, they also have significant distinctions.
The interval scale lacks a genuine zero point, whereas the ratio scale has one. When compared to variables measured on an interval scale, this distinction enables more complex mathematical operations on variables recorded on a ratio scale.
An interval scale is a measuring scale with meaningful and consistent intervals between the numbers. An ordinal scale, on the other hand, is a measuring scale in which the data set can be ranked or ordered, but the intervals between the numbers are not always equal or constant.
The ordinal scale just provides an ordered set of categories without specifying specific distinctions between them, but the interval scale contains equal and meaningful gaps between the numbers and enables mathematical operations.
The interval scale provides a controlled and regulated method for collecting, analyzing, and interpreting data, which aids in the generation of insights and the making of informed decisions in a variety of sectors.
Interval scales work well in surveys where respondents must provide temperature, time, and date variables. Interval scales may be readily integrated into multiple-choice or rating scale questions by asking respondents to rate using a numerical scale. Here are some common uses of interval scale:
- Surveys and questionnaires: The interval scale is extensively used in the design and administration of surveys or questionnaires. You can use an interval scale when create a survey. Respondents can score or rank objects on a scale, which allows researchers to obtain quantitative data for the study.
- Market research: In market research, an interval scale is used to assess client preferences, satisfaction levels, and buy intent. It aids in the analysis and interpretation of client feedback or ratings, helping organizations to make educated decisions.
- Measurement and quantification: By giving numerical values to distinct properties or variables, the interval scale provides for exact measurement and quantification of data.
The Likert scale is a type of ordinal scale. The Likert scale assesses respondents’ attitudes or levels of agreement and disagreement on a subject by asking them to select from a list of answer alternatives such as “strongly agree,” “agree,” “neutral,” “disagree,” and “strongly disagree.” The selections are arranged in a positive to negative sequence, reflecting a rating of views or levels of agreement.
Final words
In conclusion, the interval scale in statistics is a kind of scale in which the variable values are measured on a numerical scale, and the intervals between the values are equal and meaningful.
There is no actual “0” point on an interval scale. Temperature, calendar dates, and IQ scores are examples of variables assessed on an interval scale. Interval scale values can be added, subtracted, and averaged, but multiplication and division are not useful.
This article has examined the interval scale definition, characteristics of the interval scale, interval scale examples, and frequently asked questions about the interval scale. When you read this article, you can learn all details about the interval scale.
Sena is a content writer at forms.app. She likes to read and write articles on different topics. Sena also likes to learn about different cultures and travel. She likes to study and learn different languages. Her specialty is linguistics, surveys, survey questions, and sampling methods.


