Exploratory analysis may seem familiar to some and a foreign genre to others. However, data scientists know how valuable exploratory data analysis in data science can be for businesses. The usage area of exploratory analysis extends from customer segmentation to sales trends, which businesses need.
The potential for exploratory analysis comes from explaining events easily and simply. But, if you are new to this topic, you may need to learn its full potential. But do not worry. This article will explain how to effectively benefit from this type of analysis with methods, examples, and tools.
What is an exploratory analysis?
Exploratory data analysis (EDA) is an approach aiming at obtaining assumptions. And recognizing patterns to evaluate the basis of data sets.
It uses data visualization methods and tools better to show the relationships between variables or data entities.
It has several main objectives. Firstly, it reveals unpredictable data and puts forward arguments about causes. Secondly, it determines which statistical method will be more helpful and initiates other data analyses. For such usages, data exploratory analysis is the cornerstone of various analysis structures, including data mining.
Benefits of using exploratory analysis
Exploratory analysis is the first basic step to understanding the data. Its main aim is to illuminate hidden relationships and help test the assumptions. Thus, it allows you to look at datasets from a broader perspective. It does this by providing actionable insight into the decision-making process.
Here, you will see only three benefits that fit the main purpose. This is an opportunity to read precise information for you:

Advantages of using exploratory analysis
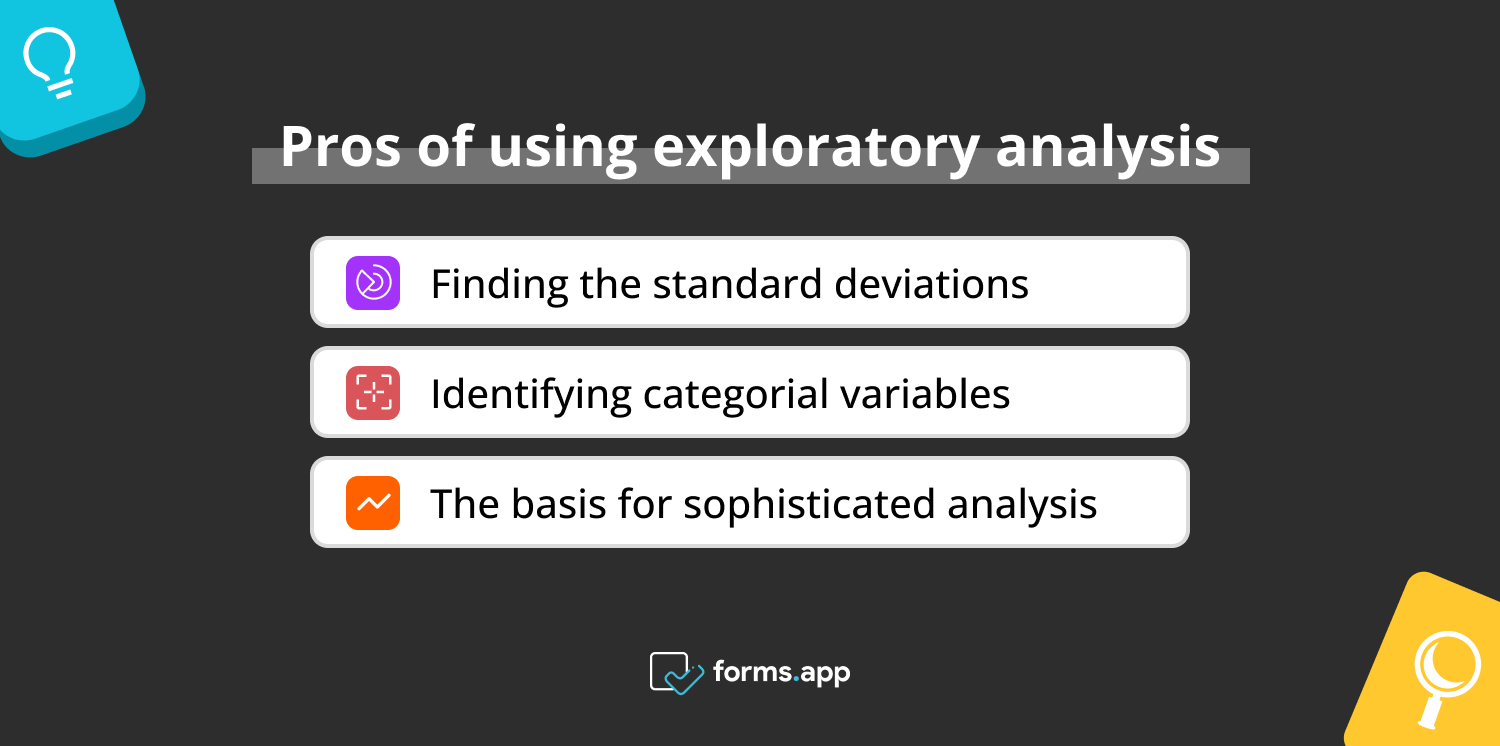
#1 Finding the standard deviations
Exploratory analysis allows you to understand the typical distance between data points around the mean. So, it helps to produce better quality data by determining the outliers of data points. In other words, exploratory analysis provides accuracy for other analysis types and modeling by revealing variables.
#2 Identifying categorial variables
You can find categorical variables in a complex distribution in the dataset. It is necessary to identify them in order to understand the classification and grouping of data. It also plays an important role in making more appropriate choices. It makes use of machine learning algorithms in the most efficient way when performing statistical modeling.
#3 The basis for sophisticated analysis
You can think of exploratory analysis as if making an early diagnosis. But, you can consider more comprehensive and purposeful analyses, such as conjoint analysis, as a full diagnosis. Therefore, examining and understanding the data through exploratory analysis initiates more advanced statistical models. So, the EDA process creates less burden on advanced analysis.
When to use exploratory analysis
There are exploratory data analysis steps you should take care of when performing an analysis. Because even though you know why you use it, you need to know when to use it. It may be too late even if it gives efficient analysis results.
Therefore, you see below the timestamps that may be the best time for you with exploratory data analysis examples.

Right times to use exploratory analysis
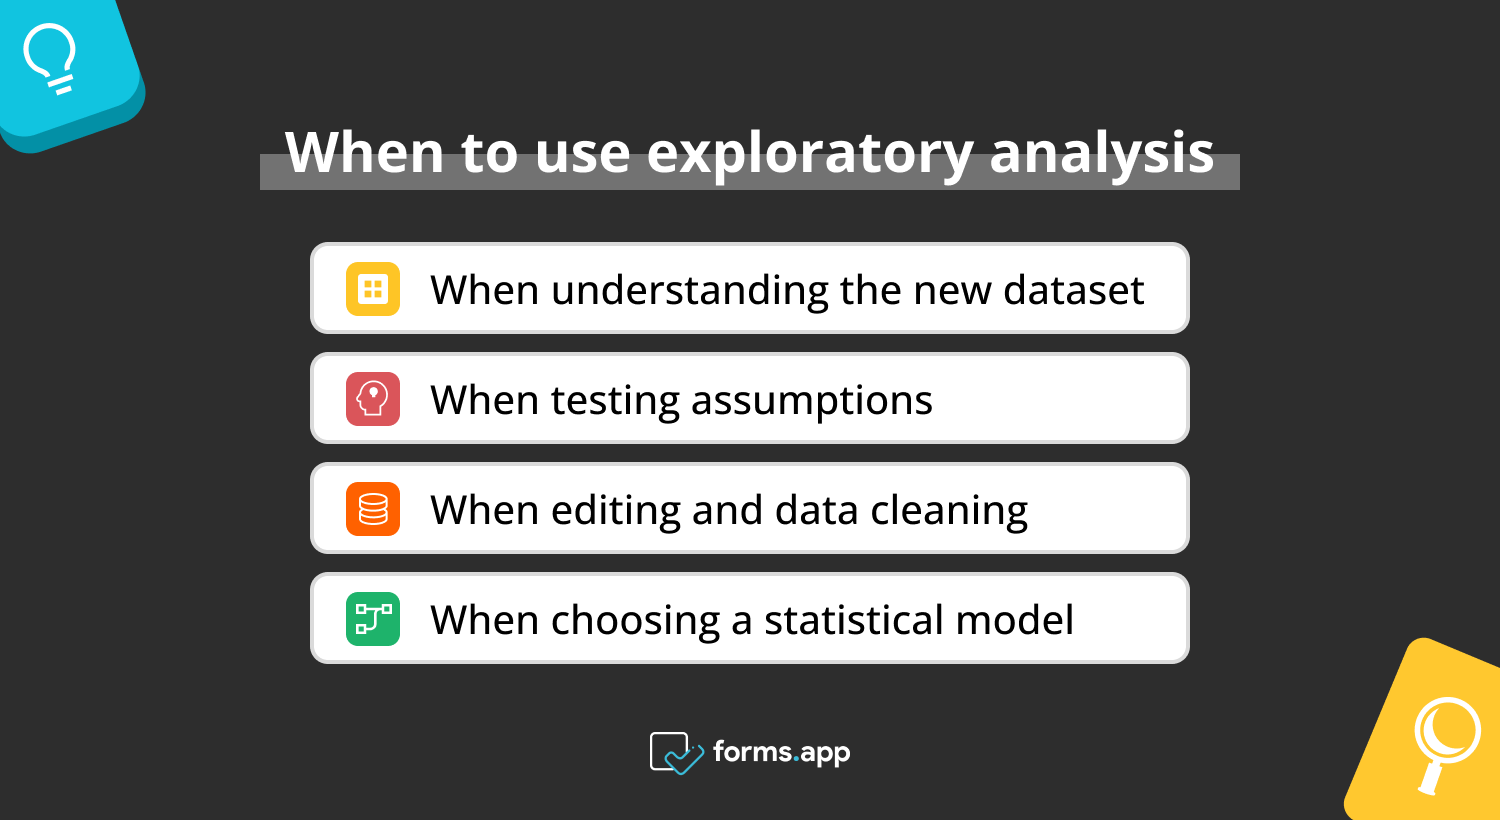
1. When understanding the new dataset
It is important to know that not all datasets are easygoing. You can expect a straightforward analysis of the data you have collected. However, a thorough exploratory analysis can show you the complex and unknown aspects of the dataset.
For example, a technology company gathered a very complex dataset, including customer age, product preferences, customer country/city, customer satisfaction, and customer churn. They should first understand this dataset with exploratory analysis to continue their elaborate analysis further.
2. When testing assumptions
You may have any hypotheses or predictions. It will be useful to reveal and evaluate them with exploratory analysis. You can see it as a first step for the subsequent processes.
For example, a business has an assumption that the company will benefit from the next holiday season. The business thinks like that because it had benefited from the previous season. Even though this comparison may seem true, the previous holiday may have distinguishing features from the upcoming holiday season. The business can not detect this at first glance but can reveal it through exploratory analysis.
3. When editing and data cleaning
There is no guarantee that the data collected will always be perfect. Sometimes, you may need to clean and properly edit the data. In this way, you create a more reliable analysis environment.
For example, exploratory analysis provides data standardization to be classified according to different databases. And it generally provides consistency for other people in your business who will use these databases.
4. When choosing a statistical model
You can use exploratory analysis to develop a seamless model with its outlines before making the final model with different techniques.
For example, a business may need a statistical model to forecast sales trends. For this, you may require an exploratory analysis. It will analyze accurate historical data and put it into the most appropriate model.
Exploratory analysis types
The article stated that exploratory data analysis played an active role in revealing the relationships between data entities. But to do this, it uses several different exploratory analysis methods. The approaches to the relationships between parts can distinguish each mother from the other. Here, five of the most used ones will be shared with you:

Types of exploratory analysis
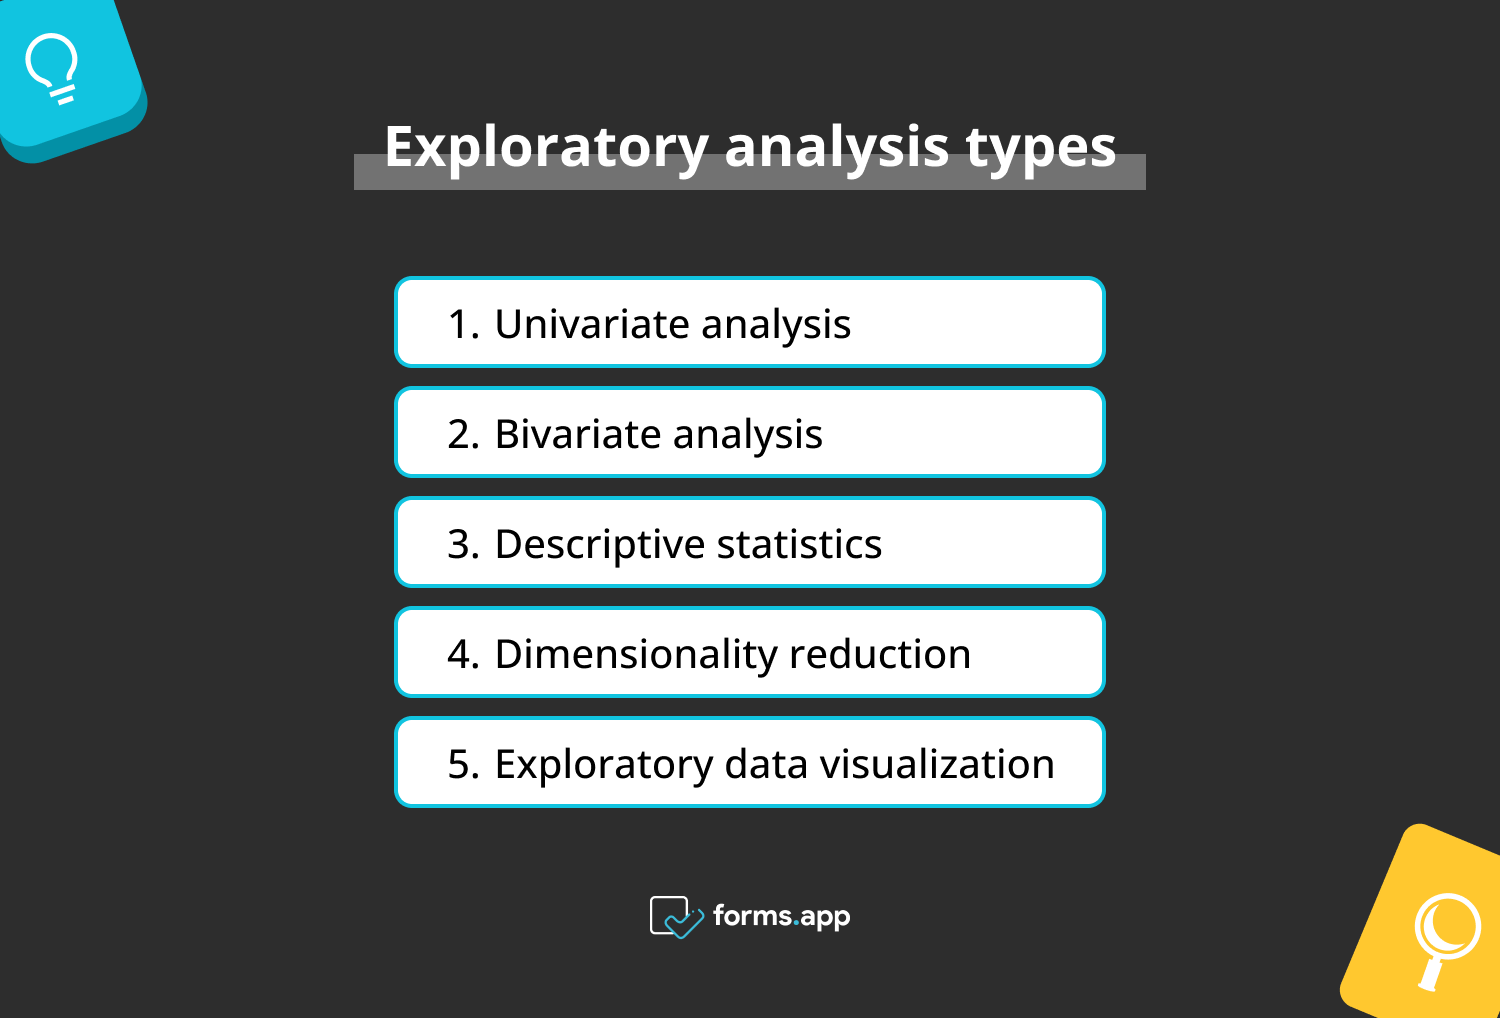
1. Univariate analysis
The main purpose of this type of data evaluation is to analyze the salient characters of the variables. It focuses on one variable at a time. It visualizes and summarizes the characteristic trend and distribution of that variable. To do this, using techniques such as bar charts and histograms reinforces the accuracy of the data.
2. Bivariate analysis
The bivariate method is a developed form of univariate analysis with two variables. However, this time, bivariate analysis considers the variable and the connections, correlations, and dependencies between variables.
The techniques it uses are naturally different from univariate. It utilizes graphs such as scatter plots and correlation matrices, which are among the most used. If you have data with more than two variables, then you can use multivariate analysis.
3. Descriptive statistics
Descriptive statistics compiles the main lines of the data as a summary. But it does this through three separate branches. These are distribution, measures of central tendency (mean, median, mode), and measures of variability (range, standard deviation, variance, interquartile range). Summing up using these reveals the properties of the dataset.
4. Dimensionality reduction
This type also reduces the size of multidimensional datasets by removing all but the necessary parts. Therefore, it determines which information is essential and which is unimportant. Principal component analysis (PCA) or t-distributed stochastic neighbor edging (t-SNE) are familiar techniques used in this process. They ensure a healthy understanding and classification of the data.
5. Exploratory data visualization
Data visualization is always useful because it reveals statistics with visible representations. This method has been widely used in other types of analysis. So, you can also benefit from it in exploratory data analysis. This allows you to see complex datasets with a simple model.
4 essential tools for exploratory analysis
Choosing the appropriate exploratory analysis tools for a comprehensive data exploration is necessary. However, choosing the right one may depend on your proficiency with these tools or the benefits the tools provide.
1. Python
Python is a widespread programming language. It is one of the first that comes to mind in data analysis. This is because many types of statistical packages, such as Pandas, measure, visualize, and explore the data. You can always benefit from Python when utilizing other tools like Jupyter Notebooks.
2. The R project for statistical computing
Another valuable resource for statistical science is the free software environment R. You can observe your data in detail with many statistical packages in The R project for statistical computing.
3. Tableau
Another popular tool is Tableau. It is a business intelligence and analytics software. It has many contents that data analysts may need in data mining, analysis, and visualization.
4. Jupyter Notebooks
It is a well-known web-based interactive data analysis environment. You can also perform a seamless data analysis using this tool.
Last words
To summarize, this article explains the purpose of exploratory data analysis in terms of the business environment. And it defines its usage for this purpose. You have seen the purpose under five headings. These are the definitions of exploratory analysis, when to use it, its benefits, its types, and tools.
This article provided you with examples and detailed explanations about the context. You are now ready to use exploratory analysis for data mining or analysis in a business context.
Atakan is a content writer at forms.app. He likes to research various fields like history, sociology, and psychology. He knows English and Korean. His expertise lies in data analysis, data types, and methods.


