Just as you can see the distance you want to reach when you use Google Maps, you can adapt a very similar system to see the distances between data points. If you are wondering how to do this mapping, the answer is multidimensional scaling.
Multidimensional scaling is a statistical tool that takes into account the similarities and differences in the data and places them on a new plane according to their distances. The purpose of this article is to provide you with a multidimensional scaling tutorial. To learn more, let’s start with the definition!
What is Multidimensional scaling (MDS)?

Multidimensional scaling (MDS) is a statistical technique used in data analysis to reduce the number of dimensions in high-dimensional data.
By doing so, the data are visualized for easier analysis and interpretation. MDS's area of use is quite wide: it is used to make critical decisions in market research, psychology, sociology, geography, health, education, and biology.
When to use the Multidimensional scaling
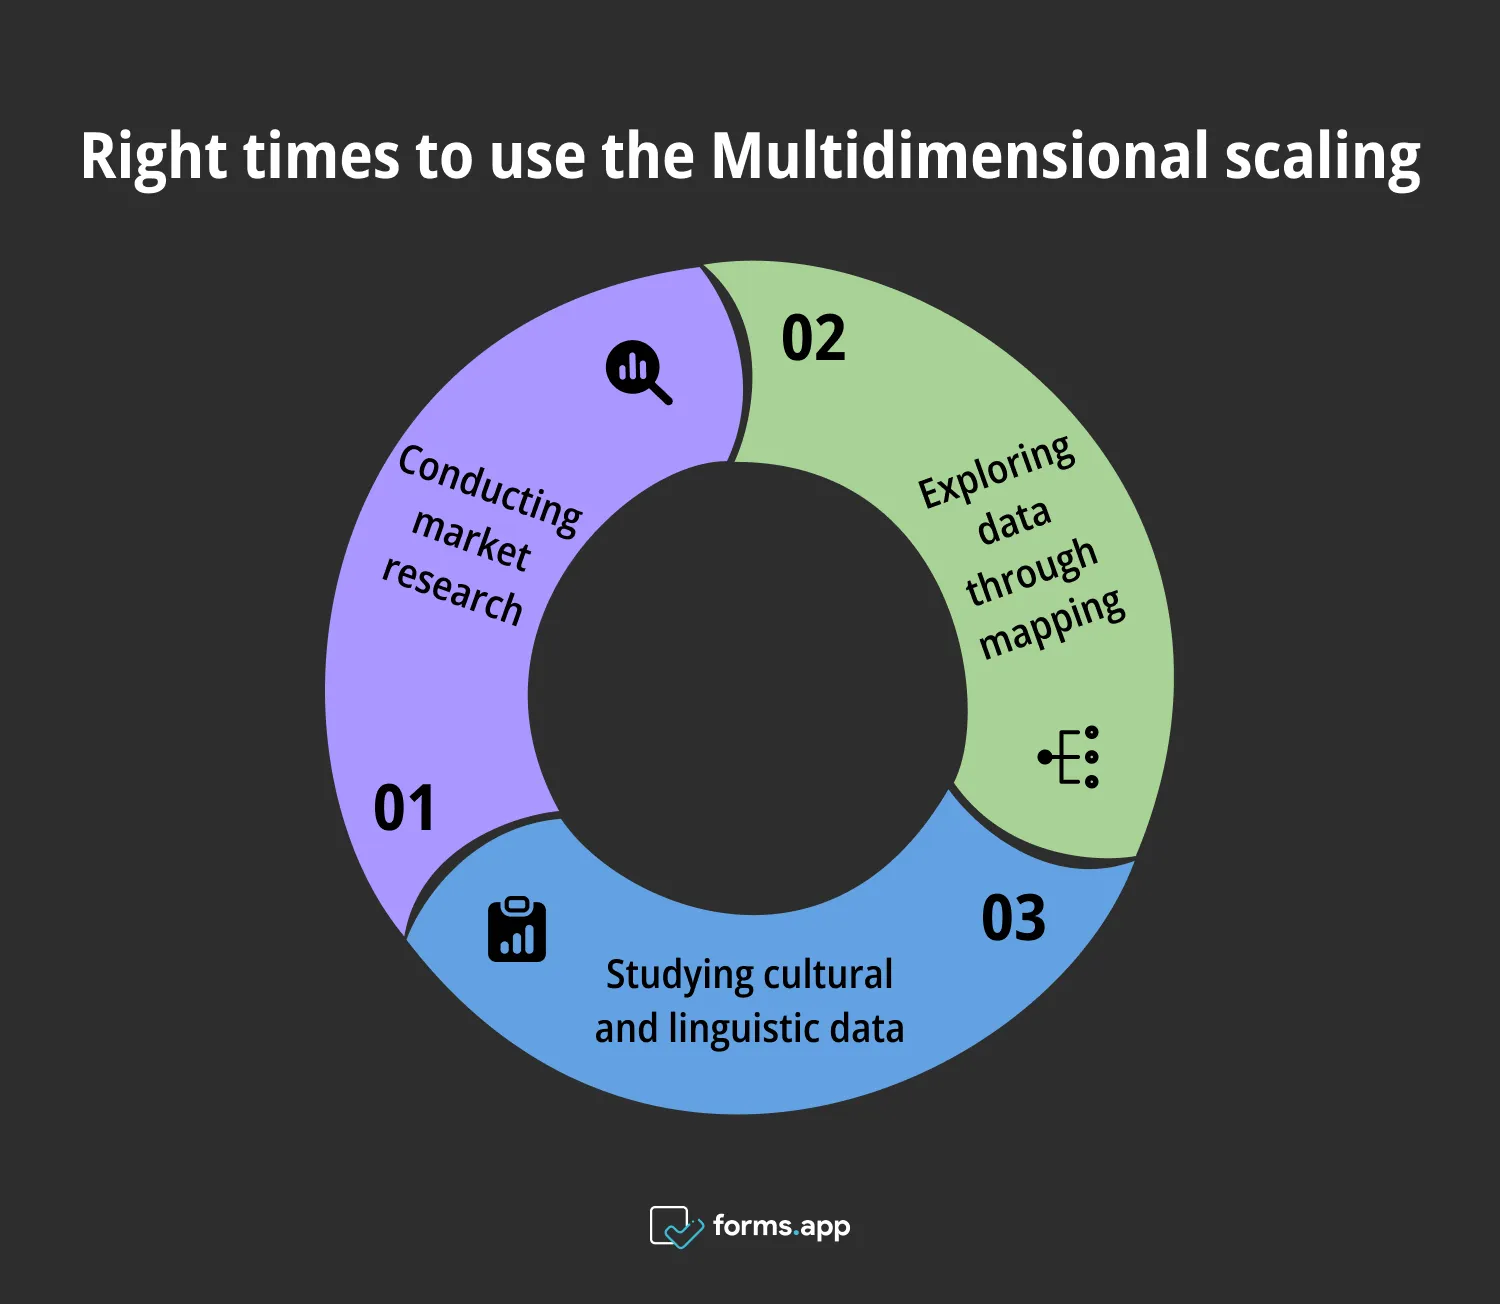
Multidimensional scaling visualizes complex data, making it useful in various times and situations. It is ideal for understanding critical points before, during, and after any research. When doing any research, there may be exact times when you might need to use it:

Correct times to use the Multidimensional scaling
⏰ When conducting market research: In this respect, MDS becomes very valuable during market research when knowledge of consumer perception and preference is required. It can visualize the similarities between products, services, or companies, showing their position in the competitive atmosphere. Businesses can use this insight to adjust marketing strategies and provide better service to their customers.
⏰ When exploring data through mapping, MDS visualizes complex data and reduces it to a lower-dimensional space. This allows one to see more easily the patterns and relationships in that dataset. It can also conserve relative distances of data points, which helps one see the underlying structure.
⏰ When studying cultural and linguistic data: MDS is used especially in sociology academic research, culture, and language studies because it facilitates geographical classification. It places the characteristics and patterns of cultures and languages at distances by considering the similarities and differences between them. Thus, it is an effective tool for cross-cultural studies.
Multidimensional scaling types
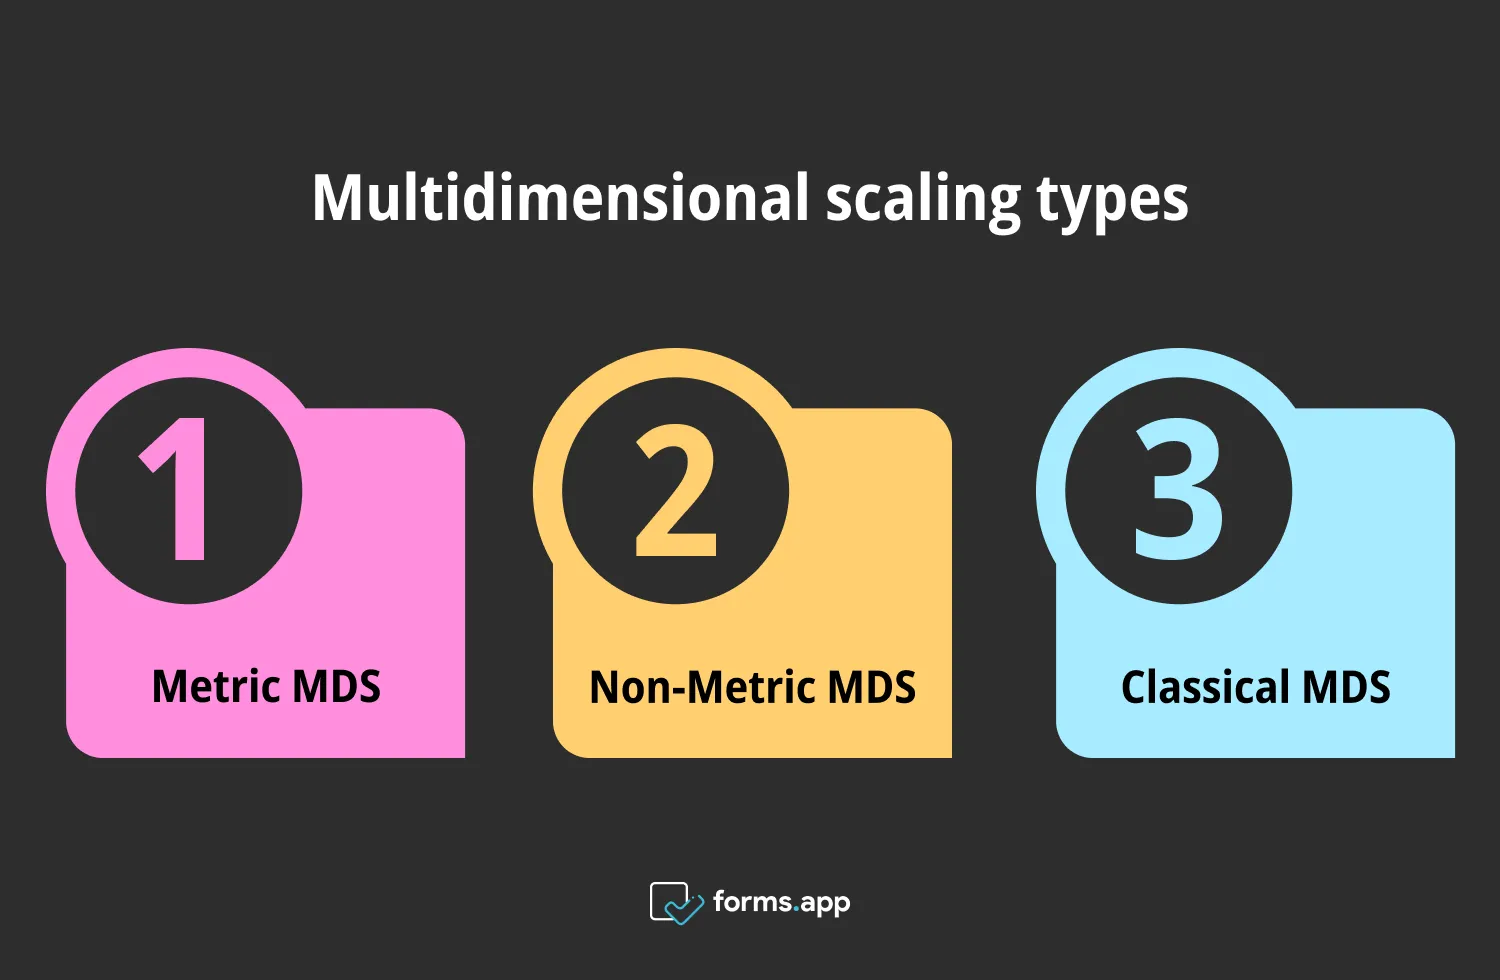
There are several types of multidimensional scaling that you can choose depending on the purpose of your research. Here, the three most commonly used types (metric, non-metric, and classical multidimensional scaling) will be explained:

Types of multidimensional scaling
1. Metric MDS: This type extends the optimization process to include different loss functions and input matrices with specified distances and weights. It reduces a cost function known as "stress," typically minimized through a method called stress majorization.
2. Non-Metric MDS: This technique is mostly used in examining qualitative data and understanding non-Euclidean relationships. It optimizes a "stress" function by taking into account a statically increasing function.
3. Classical MDS (Torgerson Scaling): This method is used to generate a coordinate matrix using an input matrix of dissimilarities between item pairs, aiming to minimize strain. It can be used when the data has Euclidean distance. Thus, it ensures that the distances are transferred as they are when transferring them to the new space.
Examples of Multidimensional scaling
Here, multidimensional scaling examples of its usage from two different areas will be given. It is recommended that you read these examples carefully, as they can be a guide in your analyses.
1. Linguistic study
Assume that there is a researcher who wants to create a map of dialects of a language based on their similarities and differences. The researcher uses the MDS technique in the following steps:
- Select linguistic features and measure a distance matrix for the dissimilarities between dialects. Set up language configuration in a lower dimensional space.
- Continuously readjust the positions of the dialects to preserve the original dissimilarities. This will minimize the stress function. Repeat the process until the stress function converges.
- Finally, visualize the set-up to show linguistic patterns and relationships.
2. Brand perception
Assume that there is a company that seeks to learn customer perception about their brand in the market environment. To visualize customer comments and their position in the market with MDS using survey data, it performs the following steps:
- Start collecting a distance matrix, which expresses consumer perceptions about the similarity or dissimilarity of various brands. Place the brands in a lower dimensional space.
- Adjust brand positions with repetitive actions, and this will minimize the stress function. Then, spatial relationships that reflect consumer perceptions will emerge. Continue adjustments until the stress function is stabilized.
- Finally, marketing strategies should be developed according to the resulting brand map.
Advantages of Multidimensional scaling
Multidimensional scaling has different benefits depending on which research area you use it in. For example, its benefit in the field of sociology is to be able to examine social structures on a visible and understandable level. Apart from that, it has generally such advantages as:
➕ Reduces the dimensionality of data while retaining essential information.
➕ It can test your hypotheses, provide resources for more complex analyses, and be an important basis for decision-making.
➕ It is applicable across various fields and data types thanks to its versatile nature. So you can use it in any research area without a problem.
➕ It can be used to reveal hidden structures in complex data sets and to show relationships between data points.
Frequently asked questions about the multidimensional scaling
This article gives a rough description of multidimensional scaling. Still, if you want to ask a critical point about which you are curious, you can check the frequently asked questions below.
Existem vários propósitos para o escalonamento multidimensional (MDS) que você pode utilizar. Seu principal objetivo é visualizar pontos de dados, que estão principalmente em um espaço bidimensional. Ao fazer isso, ele tenta preservar a distância entre os pontos de dados o máximo possível.
É usado para observar melhor os valores dos pontos de dados e visualizar padrões e relacionamentos. É especialmente útil para ajudá-lo a entender tabelas que contêm relacionamentos complexos e economiza você de se perder entre os pontos de dados. Assim, desempenha um papel importante na busca de soluções para problemas como pesquisa de mercado empresarial.
Não-métrico Multidimensional Scaling (NMDS) e Multidimensional Scaling (MDS) são técnicas estatísticas usadas para visualizar e explorar as relações entre os pontos de dados em um espaço de dimensão reduzida. No entanto, eles diferem na ordenação dos pontos de dados. NMDS é um método flexível que você pode usar quando não há uma relação linear direta entre as dissimilaridades e distâncias. Ele não mostra as distâncias exatas, mas preserva a ordem de classificação delas. Por outro lado, MDS mostra claramente as distâncias métricas entre os pontos de dados. Se você precisa de uma técnica adequada de mapeamento para mostrar dissimilaridades lineares, então você deve usar MDS.
Os passos chave do algoritmo de escalonamento multidimensional são os seguintes:
- Primeiro, construa uma matriz de dissimilaridade. Ela representa as distâncias entre pares de pontos de dados.
- Comece a configurar os pontos de dados no espaço de baixa dimensão.
- Em seguida, mova os pontos de dados no espaço para minimizar a função de estresse e repita esse processo várias vezes.
- Continue melhorando essa configuração até que a função de estresse tenha convergido.
- Pare o processo quando atingir a convergência e finalize a configuração para visualização e interpretação.
A Análise de Componentes Principais (PCA - Principal Component Analysis) e o Escalonamento Multidimensional (MDS - Multidimensional Scaling) são ambos métodos de visualização de dados utilizados para explorar conjuntos de dados complexos. No entanto, eles procedem de forma diferente em termos de entrada de dados, linearidade e gráficos de resultados. Ao contrário do MDS, o método PCA requer dados quantitativos para construir uma estrutura.
O PCA é usado para exibir dados em relacionamentos lineares em uma forma linear, mas para o MDS, não é necessário que os dados sejam lineares. Na parte de visualização dos dados, o PCA prepara um gráfico de acordo com novas variáveis conhecidas como componentes principais. Por outro lado, o MDS não adiciona novas variáveis e coloca os pontos de dados em um determinado plano de acordo com as distâncias entre eles.
Conclusion
In conclusion, multidimensional scaling is a perfect tool for visualizing complex data for a comprehensible analysis. It provides insights into hidden relationships and patterns in various disciplines. This article will help you to get the most out of this powerful tool. The article first introduces you to the topic by explaining its definition, when to use it, and its types. Then, the article ends with two different examples of usage and listing its advantages.
Atakan is a content writer at forms.app. He likes to research various fields like history, sociology, and psychology. He knows English and Korean. His expertise lies in data analysis, data types, and methods.


 4 min ler

