Complex business dynamics require analysis of variables to reveal this structure. This is where bivariate analysis comes into play. With bivariate analysis, you can uncover the factors that affect the results. Although researchers use this type of analysis in many different areas, businesses mostly use this analysis to understand the relationships between sales, products, customers, and employees.
In short, it is possible to obtain helpful information that will ensure the continuity of a business with this analysis. In this article, why bivariate analysis is important has been explained in detail many times. Accordingly, when and where you should apply it is also explained. And lastly, its types are presented with examples to help you understand. Now, join the world of statistics and bivariate analysis.
What is a bivariate analysis?
Bivariate analysis is a research method that investigates the relationships between two variables to gain statistical data about their mutual influences.
Examining the correlation and causation of data provides tangible information for decision mechanisms. The bivariate analysis aims to identify two factors that lead to a cause, examine their changes, and make sense of this dynamic.
Why use bivariate analysis?
Business owners can make better decisions for their businesses by taking advantage of many types of analysis, such as narrative analysis, conjoint analysis, bivariate analysis, and so on. With so many types of analysis, understanding why and when you should use bivariate analysis will help you make your decision-making choices.
Think of bivariate analysis as stepping stones to the tower of statistics. For a good business, it is necessary to both climb these steps and strengthen these steps. You will understand the durability of these steps with the examples shown below. Now, there are roughly five reasons you should use bivariate analysis:
- As its most basic feature, it reveals the relationship between two variables. It shows the dependencies and patterns of this relationship.
- Understanding patterns extracts appropriate data to prepare predictive models.
- Provides the opportunity to evaluate hypotheses about observed variables.
- Helps to observe the cause-and-effect relationship.
- Provides data that will affect your decision-making process when you make important decisions about your company or business.
When to use bivariate analysis?
Analyzes are resources that a business must use frequently in the normal course of business. Bivariate analysis is also included in this generalization, but some situations may be more optimal time for you to use analysis. Below, important timestamps when you should use bivariate analysis are explained with examples.
- Market research scenario: Bivariate analysis can be used for your company's market research. For example, it can be used in many marketing areas such as customer-product relationships, product supply-demand relationships, advertising expenditures-sales profit, and number of stores-store locations.
- Finance scenario: Financial analysts can easily examine interest rates, shares, sales, profits, and losses using bivariate analysis. For example, things like the relationship between interest and inflation and the fluctuation of sales depending on the summer or winter season can be examined.
- Human resources scenario: Your company's human resources relations may also be the subject of bivariate analysis. Variables such as working hours-work productivity relationship, training periods-job adaptation relationship can be examined.
Bivariate analysis types
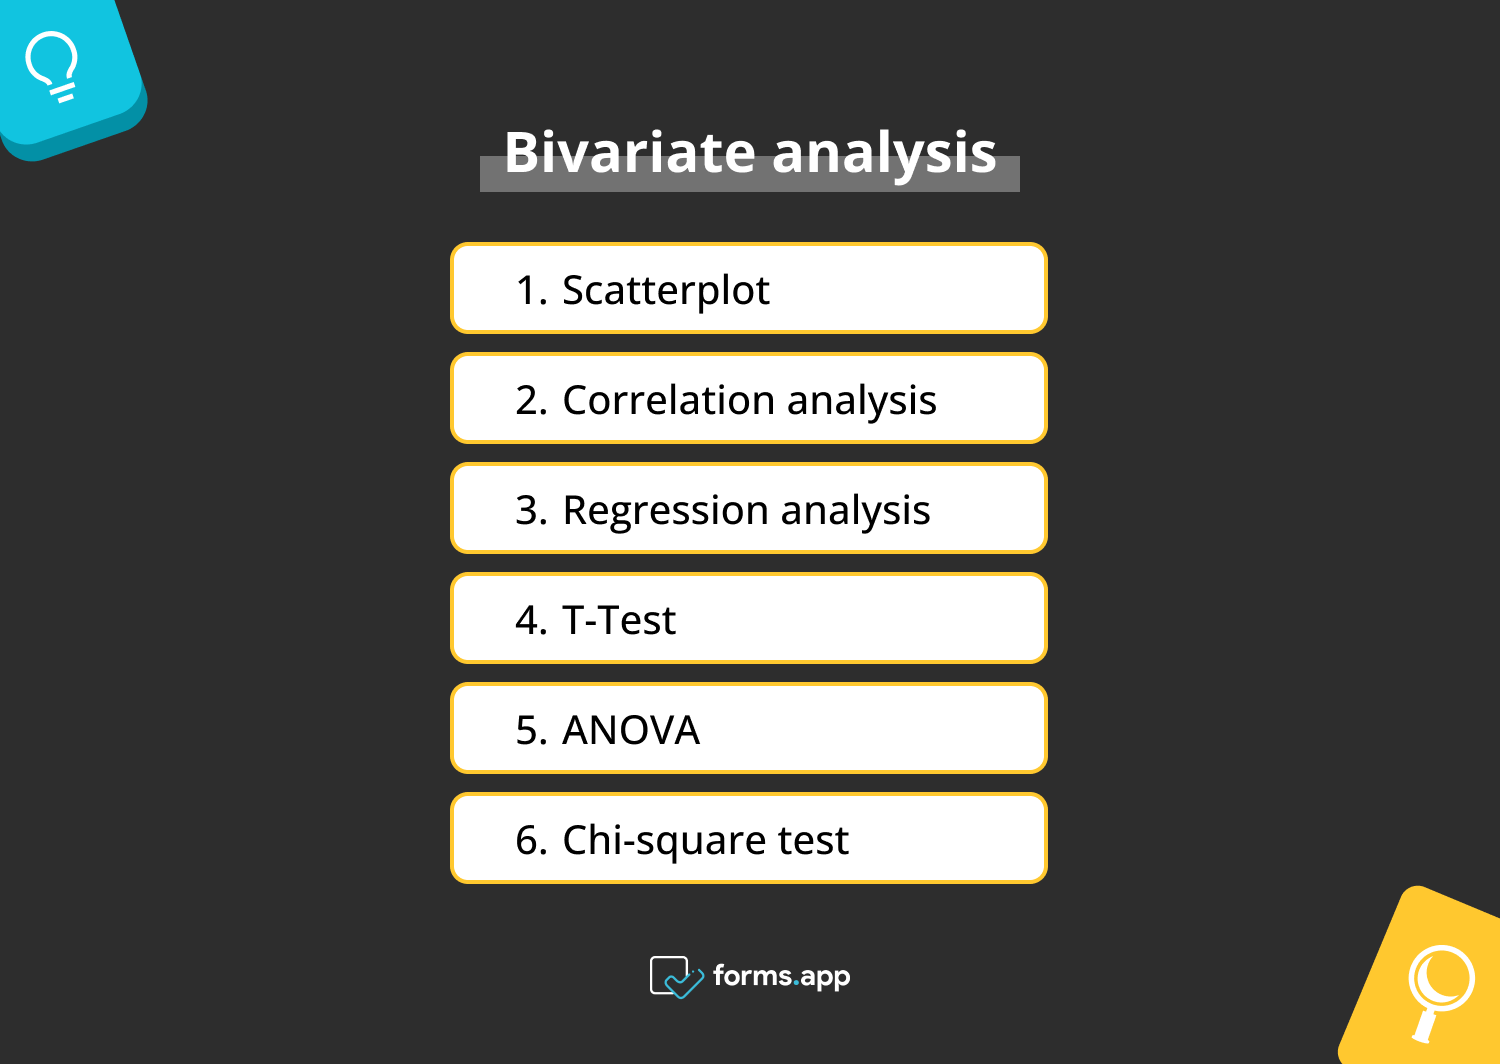
The world of statistics is a very fertile and diverse place. It may seem easy to derive statistics in this diverse place, but when, where, and which statistical method you will use is a very important factor to make it easy. There are six main bivariate analysis methods/types you can use:

Types of bivariate analysis
1. Scatterplot
A scatterplot is a statistical graph that shows the relation of two variables on the x-axis and y-axis. It is the most basic tool that shows a pattern when you place the data you collected from a survey on the x-axis and y-axis. This pattern will lead to the conclusion of your analysis.
Example: You want to compare the monthly incomes of your stores in 2023 and 2024. The X-axis is used for 2024 monthly incomes, and the y-axis is used for 2023 monthly incomes. You place the data on both axes and dot the corresponding months on the chart. All you do here is called scatterplot.
2. Correlation analysis
This is a scatterplot evaluation method. It is also called the correlation coefficient. It shows the direction of a linear relationship between two variables, whether positive or negative. The most known correlation analysis types are Pearson analysis and Spearman rank analysis. There are three main measures of correlation:
- A positive correlation is a linear increase from a negative value to a positive value.
- A negative correlation is a linear decrease from a positive value to a negative value.
- Zero correlation is the absence of available linear patterns that can be evaluated.
Example: You will launch a new electronic product, and before launching it, you ask consumers whether they need this product(or whether they will use it). You can prepare a scale from 1 (I never use) to 5 (I always use) as an answer. Consider the age of the consumers as one axis(x) and whether they will use the product or not as another axis(y). Using appropriate programs, you can easily create a correlation table of the resulting data. If those in the 20-25 age range chose 5, and those in the 55-60 age range chose 1, then a positive correlation appears.
3. Regression analysis
Regression analysis is a quantitative analysis method used to find out the relationship between two or more variables. If a single variable is used, it is called univariate regression(simple linear regression); if more than one variable is used, it is called multivariate regression(multiple linear regression) analysis.
Example: There are five stores of yours, and their monthly income varies from 50 to 80 thousand dollars. The expenses of these shops are in the range of 20 to 30. Place the variables on the x and y axes. Draw a regression line on the scatter diagram, and after the calculations, it will give you the predicted score of one-to-one correspondence of each value.
4. T-Test
A t-test is used to measure the degree of difference between the two groups. It is useful to understand whether the resulting data is correct or whether it occurred randomly. A bivariate analysis table can be prepared to organize groups and variables. It will help you to compare percentages and frequencies.
Example: You have prepared a survey to examine the problem-solving skills of employees who have been working for more than five years and those who have been working for less than one year in your workplace. First, determine your hypothesis. For example, those who have worked for more than five years will have more problem-solving skills. Then, do a t-test, compare the data with your hypothesis, and determine if there is a deviation.
5. ANOVA
Analysis of variance or ANOVA test is an extension of the t-test. It compares multiple groups using one variable to reach a conclusion. For example, healthcare is one group, and education is another group. They have common grounds, like medical education.
Example: There are 3 different phone brands (these are a group), but they all have different battery life (this is a group). You've hypothesized whether there is a significant battery life difference between them and collected data to measure it. You applied the ANOVA test and decided whether the result matched your prediction or not.
6. Chi-square test
It is a type of analysis performed to examine the difference between what is expected to happen within a group and what actually happens. This way, you can uncover why this deviation in your hypothesis occurs and use it in decision-making.
Example: You will launch a new drug, but you want to measure whether this drug responds positively to the disease. You can create a contingency table, a section for those who use the drug and those who do not use it, and a section for those who do or do not have the disease. Then, the result is obtained by doing a chi-square test.
Frequently asked questions about bivariate analysis
Do you want to know more about bivariate analysis? This FAQ guide will give you answers about this type of analysis. Whether you are new to statistics or looking here to clarify some issues, these questions have been compiled to answer the questions you are looking for quickly.
Bivariate analysis is used to find out the strong relationship between two variables. Therefore, it provides data that is very easy to understand and read instead of complicated data such as multivariate analysis. By examining the variables, cause and effect relationship groups can be found, and accordingly, this may positively affect your decision-making situation.
Bivariate and correlation are two concepts that are related to each other but do not have the same essence. While bivariate is a type of analysis that examines two different variables in general terms, correlation means that two variables are linearly connected to each other. Therefore, it can be said that bivariate is a large-scale relationship analysis, but correlation is a measure of the stage of a relationship.
A contingency table is a method used to examine two variables together with their occurring frequencies. This table becomes a tool for analyzing the relationships between these two variables. A contingency table is very easy to create yourself; you just need to draw rows and columns and place the values obtained from the data. Thus, these tables help you organize your data.
There are many types of tests for bivariate analysis. Commonly used methods are regression analysis, correlation coefficient, T-Test, chi-square test, ANOVA (Analysis of Variance), and contingency tables.
First of all, the number of variables they use is different. Therefore, the methods of analyzing data are naturally different. The univariate analysis utilizes descriptive statistics such as mean, median, range, and mode.
However, bivariate analysis utilizes methods such as correlation, regression, t-tests, and ANOVA tests. For example, univariate analysis can be used to examine the age of your customers, and bivariate analysis can be used to examine which product models your customers prefer based on their age.
Conclusion
In this article, the structure and content of bivariate analysis has been explained. It also has been shown how businesses can use this statistical analysis to their advantage. Examples of bivariate analysis have been provided to get a better insight into it. As a result, it is very easy to benefit from the bivariate analysis whether you are a large or small business.
Atakan is a content writer at forms.app. He likes to research various fields like history, sociology, and psychology. He knows English and Korean. His expertise lies in data analysis, data types, and methods.


