Today, all businesses, small or large, must analyze data to be successful in their fields. Data analysis is the best way to make sense of your business, employees, customers, and products/services. But data analysis is a very wide field, and it is always important to choose the one that suits your purpose.
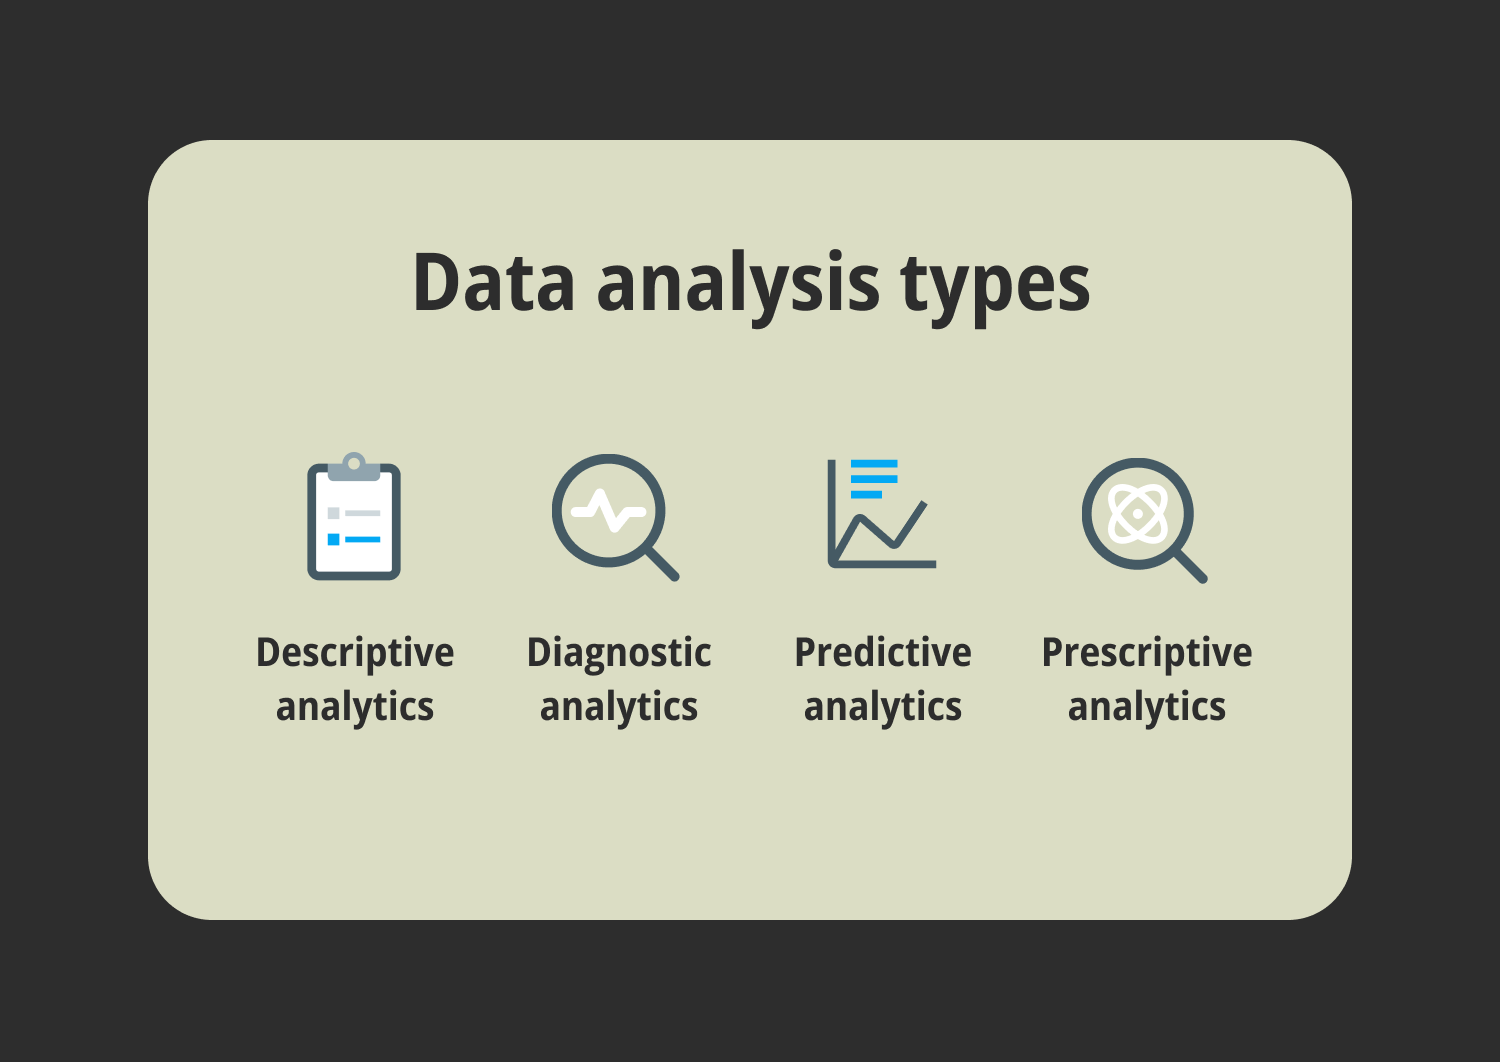
Four generally accepted basic types of data analysis are used to make data-driven decisions. We will examine these under separate headings and explain them to you in the shortest and most concise way. Depending on your needs, you may want to perform simple or complex data analysis. This article will start from simple to complex types for convenience.
What is data analysis?
Data analysis is a research process that starts with data collection and continues with statistical modeling and analysis of the data.
Various statistical tools and methods are used to do this. These methods generally proceed according to two main approaches: quantitative and qualitative research.
Businesses, organizations, and institutions strive to achieve their goals and maintain their order by using these analysis methods. Therefore, a well-organized systematic data analysis is the key action behind all successful businesses. So, if you ask what exactly these analyses are and what types they are, you can look at the heading below.
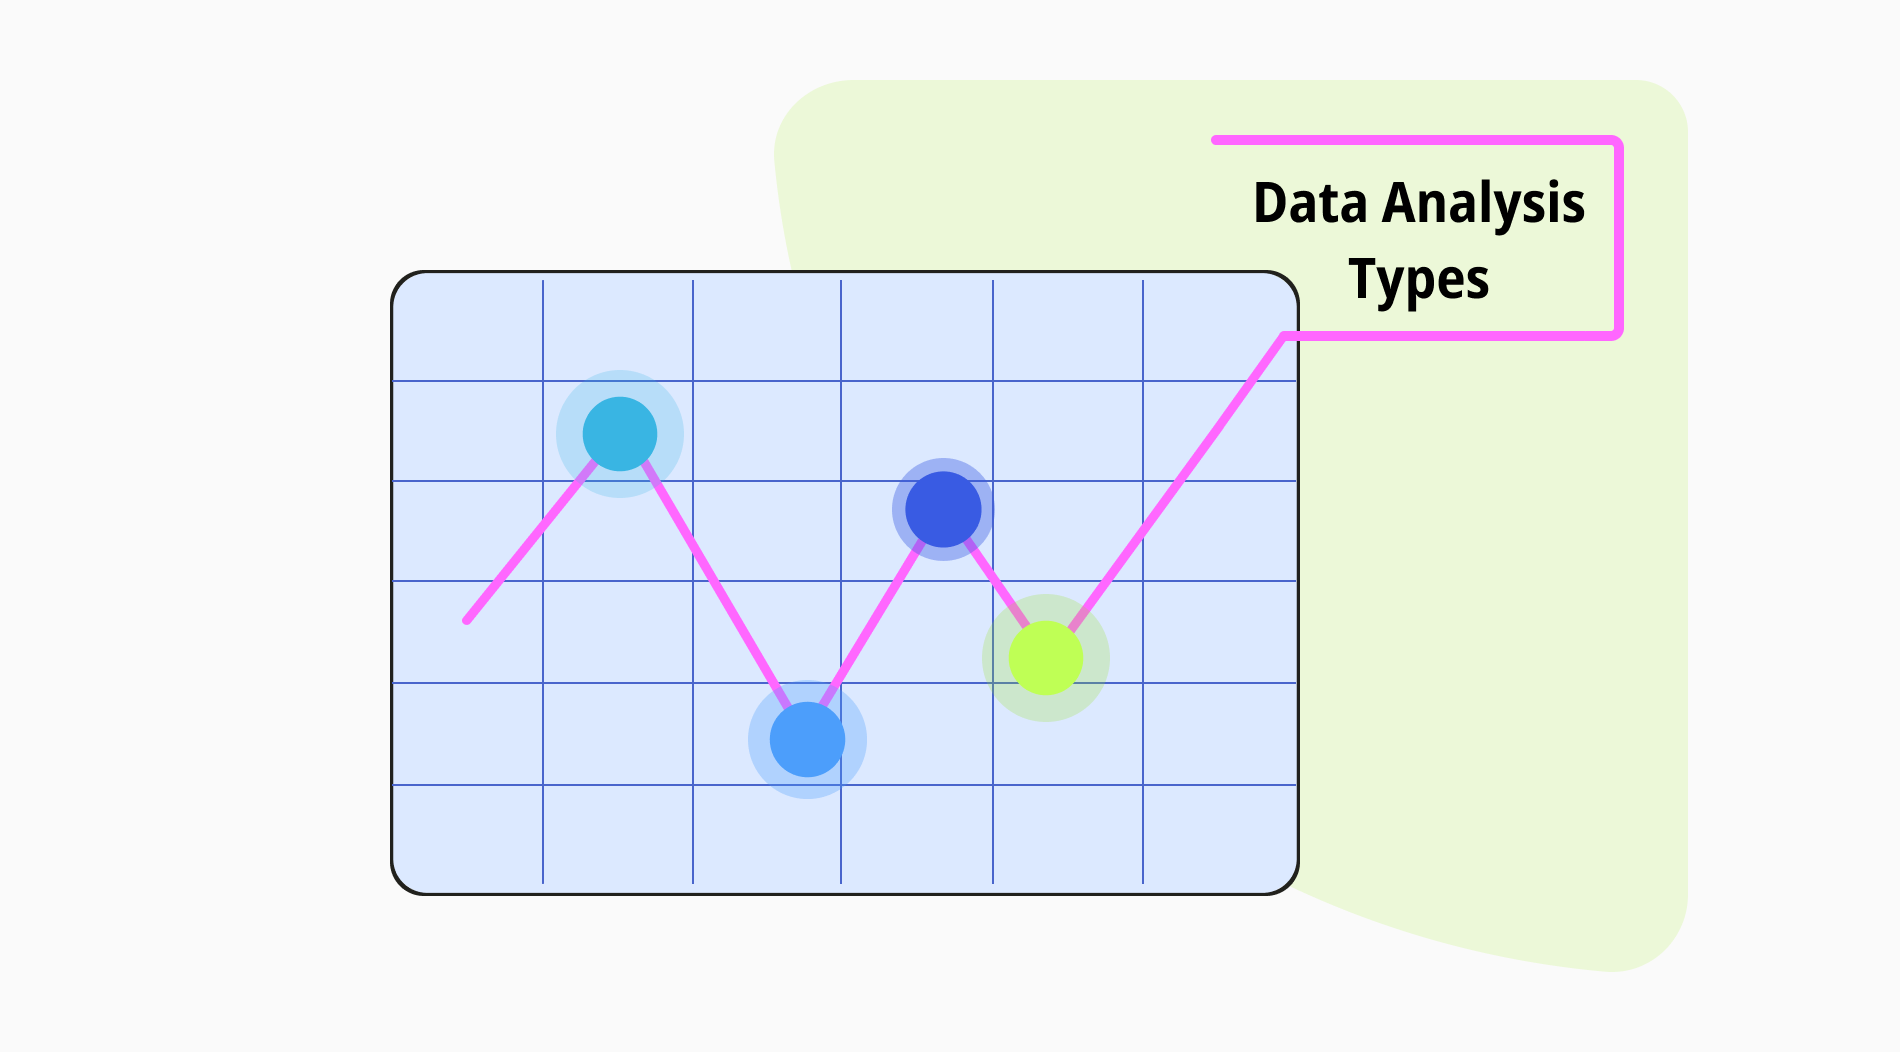
4 types of data analysis
Your approach to data varies depending on your goal and the question you ask the data. It is important whether your purpose is better expressed with a simple analysis or a complex analysis. Therefore, there are four main data analysis types in research.
These can actually be considered as intertwined rings of a process. You will better understand their connections with each other through data analysis examples and explanations.
Data analysis types
Descriptive analysis
Descriptive analysis is the first and simplest step in the data analysis process. The goal of this analysis is to find an answer to the question, "What happened?". Datasets go through a number of processes to be organized, processed, and ready for interpretation. Data is modeled through appropriate programs in these processes and becomes visibly readable.
What follows are the results produced by data researchers and businesses with their own input. Because in descriptive analysis, most of the work is based on human input. For this reason, quantitative data that will not allow for error are examined more in this type. Finally, this type of analysis serves as a stepping stone to the next analysis, which is diagnostic analysis.
Example techniques
1. Measures of frequency distribution: It is a technique for measuring how often each value is repeated in a dataset.
2. Measures of central tendency: It is a method of finding mean, median, and mode by examining numerical values in a dataset.
3. Measures of variability: It is a method of measuring the distribution of data points in the dataset. Four criteria are used: range, interquartile range, standard deviation, and variance.
Diagnostic analysis
The goal of diagnostic analysis is to find an answer to the question, "Why it happened?". This type of analysis is actually the descriptive one with a bit more machine input. It is used when dealing with non-complex problems to determine why something happened.
It is frequently utilized by businesses because it often provides accurate results and actionable insights. Finally, the diagnostic analysis also plays a stepping stone to the analysis types that follow it.
Example techniques
1. Root cause analysis: It is a method that aims to see the reasons of the reasons of the situation examined, usually using the five why method.
2. Correlation analysis: It is a method used on datasets with two or more variable values. It is used to make sense of the relationship and balance between variables.
3. Fishbone diagram: This is a method of showing the reasons with a simple visual diagram. This diagram got its name because it resembles a fishbone.
Predictive analysis
The goal of predictive analysis is to find an answer to the question, "What will happen?". It passes historical data through a classification filter and makes predictions about what will happen in the future based on what has occurred.
The use of predictive analytics is widespread in many fields of finance and academia, including business. Predictive modeling is predominantly a quantitative analysis method and is, therefore, more closely related to numerical values.
Example techniques
1. Regression analysis: It is a method used to discover the relationship between a dependent and one or more independent variables.
2. Decision trees: It is a visual diagram method based on classification. Ideas are collected in a tree-like diagram, and predictive results are indicated from the branches according to these ideas.
3. Clustering: It is a method that allows dividing the data set into segments and examining it in a more natural and simple way.
4. Time series analysis: It is a method used to reveal the relationship between data collected at certain time intervals.
Prescriptive analysis
The goal of prescriptive analysis is to find an answer to the question, "What to do?". Prescriptive analysis is an analysis method in which the interpretation of possible situations is done with AI input. From big data collection to evaluation, human input is very low.
This type of analysis is the most advanced and complex. That is why it is often also known as the final analysis among data analysis techniques.
Example techniques
1. Programming models: It is a method for making sense of complex datasets by using non-linear and linear programming, which are programming types.
2. Simulation: It is a method of creating simulations that reflect real-world scenarios to examine a situation, which is usually a complicated multi-factor issue.
3. Machine learning algorithms: Prescriptive methods are the ones most closely associated with AI. It is a method in which AI provides its own data analysis and possible scenarios.
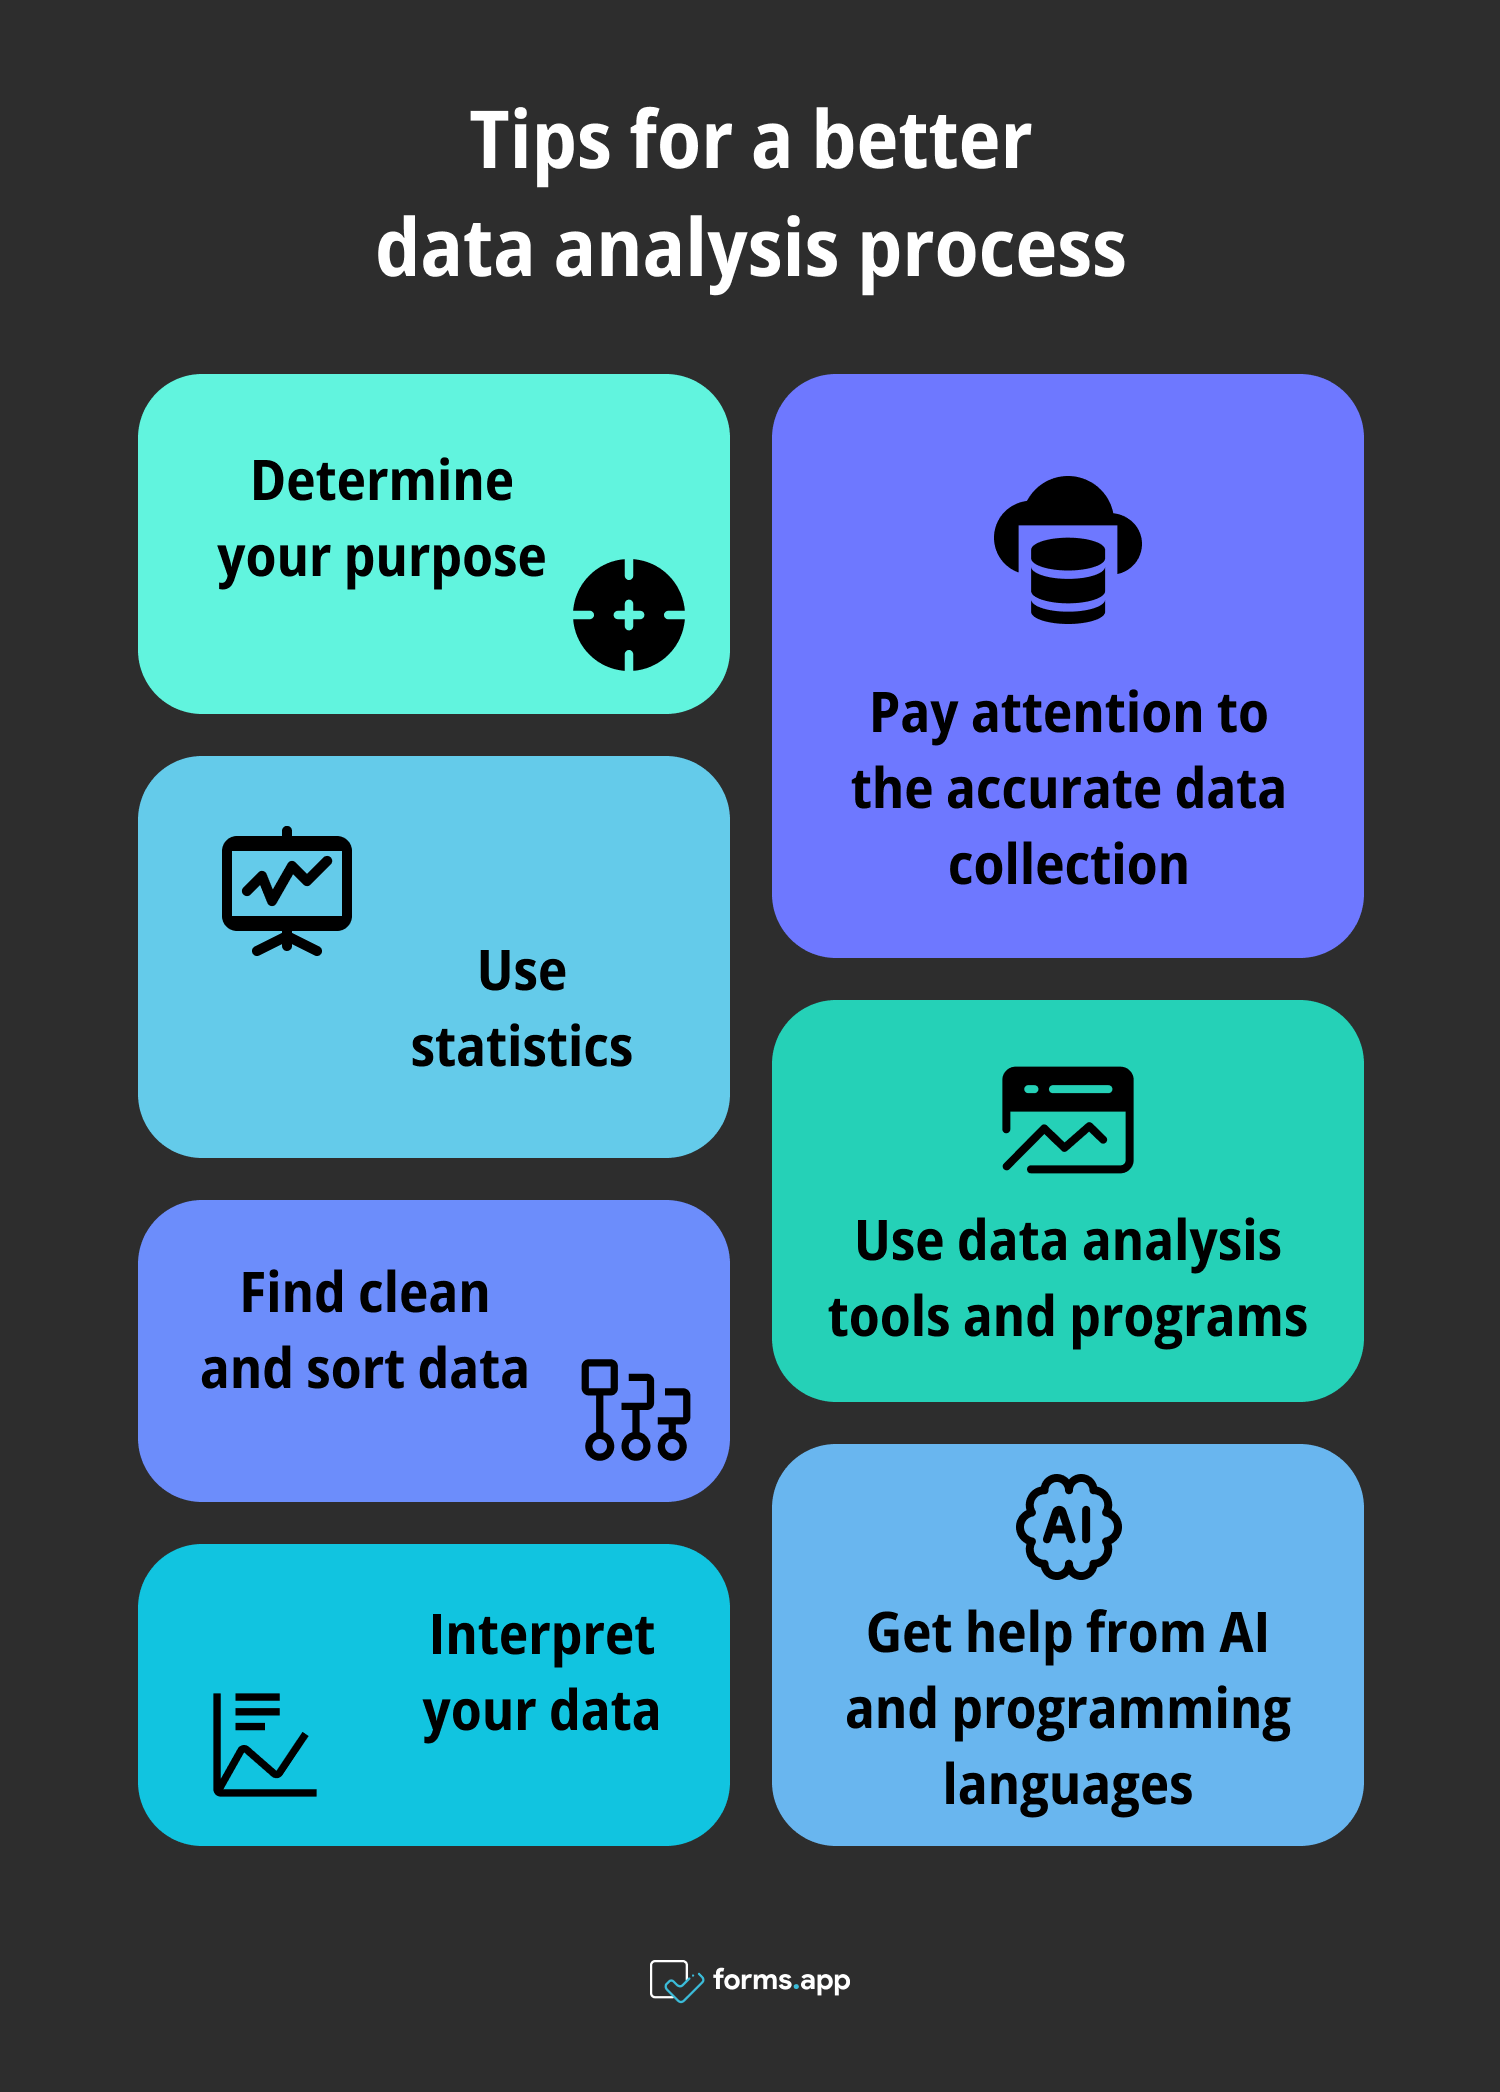
7 tips for a better data analysis process
Data analysis methods help you for specific purposes. First of all, data can be summarized and classified using descriptive methods. Then, results and predictions are calculated based on sample data using predictive methods. Ultimately, businesses make the final decision about an event using these methods. Here are a few tips for using these methods better.
Expert tips for data analysis
1. Determine your purpose
The starting of every analysis begins with determining your purpose. If you know why you need the data, you can act in accordance with this definition. Therefore, first decide whether your problem is in marketing, customer satisfaction, new product projects, or churn rate calculation. Then, you can move on to the next step.
2. Pay attention to the accurate data collection
Research that yields solid results starts with accurate data collection. Decide which type of data collection is right for you. You can collect data from many places, such as surveys, interviews, websites, news sources, etc. It is important to use quantitative or qualitative data with the correct analysis algorithm for your purposes when classifying datasets.
3. Find clean and sort data
The data you collect is not always perfect for analysis. Data may exist in different formats, in a poor state, or have duplicate records. That's why you need to clean and sort the data. After that, it will provide a smoother analysis experience.
4. Use statistics
Data analysis methods are used specifically for modeling because statistical models are ideal for people to read data without any difficulty. In this way, the issues and problems to be addressed are determined in a simple and smooth way.
5. Get help from AI and programming languages
Getting help from artificial intelligence and programming languages will always help you look at things from another perspective. Additionally, AI will often ease your workload. It is possible to make a better analysis with the help of Python and R programming languages and the packages they contain.
6. Use data analysis tools and programs
Do not forget to take advantage of data science analysis tools and programs. You can benefit from Google and many other business intelligence and analytics tools. In particular, tools such as Tableau will make your life easier, both with the user-friendly interface it provides and the analysis processes it contains.
7. Interpret your data
In methods where human input is intense, one of the parts where most mistakes can be made is the interpretation of data. It is essential for data analysts to be able to evaluate statistical results well enough. Although the analysis shows you the patterns and correlations in the most perfect way, an incorrect interpretation can reverse this.
Obstacles in data analysis
Although data analysis is actually summarized very simply as the collection, analysis, and interpretation of data, this task is not as easy as it seems. Because you are likely to encounter different obstacles in each section. But of course, it is also possible to overcome them. These are the some obstacles you may encounter:
- It is a problem that the data sample size is too large and complicated. It is important to keep the sample size fairly limited because it produces a more reliable result.
- Collecting data can sometimes cause problems with privacy laws. It is, therefore, important to choose the right sources for the data you collect.
- Do not try to prove a hypothesis or maintain your objectivity when your hypothesis conflicts with the data statistical result.
- Your data collection purpose or hypothesis may be flawed or incomplete. This means that analysis becomes completely useless.
- Lack of communication and relationships between partners, businesses, or employees who will use the data is a problem. Therefore, tools and programs that provide the opportunity to work together can be used.
- Your statistical analysis may lead to inaccurate results due to programs, tools, or AI not originating from you. To prevent this, you need to check your analysis with perhaps more than one different method or tool.
- Lack of data you want to access is also an important problem. However, you can also start this data collection process, but remember that this will be a long process.
Key points to take away
This article focused on which data analysis methods should be employed in which situations while conducting research. The four types of analysis, descriptive, diagnostic, predictive, and prescriptive, were explained with examples under separate headings.
Then, it is stated what points you should pay attention to in your research. From now on, it's all about understanding these methods and turning them into actionable insights with the help of the necessary analysis tools. Thus, you will raise the quality of your business to the next level in the competitive environment.
Atakan is a content writer at forms.app. He likes to research various fields like history, sociology, and psychology. He knows English and Korean. His expertise lies in data analysis, data types, and methods.