Net Promoter Score calculation is the perfect way for you to collect the whole data that you have asked about your target. Especially a place where you can directly hold the whole data safely, like Excel. To present them with a better harmony of these two will help you a lot!
With its excellent advantages and usefulness, Net Promoter Score Survey does not look like it will lose its popularity yet. On the other hand, in Excel, daily, monthly, and even annual accounts and important documents are kept, making the work of many companies easier.
In this article, we aimed to discuss the definition of NPS scoring, how to calculate net promoter score in Excel for free, and more! Let’s start with the basic definition of Net Promoter Score.
What is a Net Promoter Score (NPS)?
Net Promoter Score, or NPS in short, is a benchmark that ranges from -100 to +100 and aims to measure a company’s happy and unhappy customers. In order to get a Net Promoter Score, you need to ask your customers basic and general questions such as the level of their satisfaction with the latest service from 1-10, etc. Only in this way can you present them with a better service and increase the customer loyalty rates.
NPS surveys, which test the customer experience with a simple and direct question, aim to improve customer satisfaction. According to the data of Brain & Company, NPS detectors are in charge of 80% of word-of-mouth. For that reason, the power of NPS should not be underrated.
NPS calculation formula
Creating an NPS survey also means that you will need to know how to calculate your NPS score. As can be understood from the image given below, we have three main terms for the net promoter score calculation formula: promoters, detractors, and passive. Basically, subtracting the percentage of detractors from the percentage of promoters gives us the net promoter score.

NPS calculation formula
How to Calculate NPS in Excel (in 5 steps)
Now that you know what the NPS score is and how to calculate it, you can easily adapt it on Excel or Google Sheets. As long as you follow these 5 steps given above with the net promoter score calculation example, you can easily get what you want:
1. Conduct an NPS survey
First of all, you need to be sure that you have the total number of detractors and the total number of promoters. With the data you collected from your survey questions made with good survey templates, you can transform them into NPS percentages by following the instructions given under the “NPS calculation formula” title.

Conduct an NPS survey
2. Open your survey data in Excel
Did you know that if you want to, you can open your survey data in Excel in real time? Good Net Promoter Score surveys are done on forms.app easily, for sure. After sharing your NPS survey with your target prepared on forms.app, you can download the data.
All you need to do is click “Responses,” then, on the bottom right, you can find the “Download” button and get the whole data. The record will sent to you via email. On the email, you can easily downlıad the data by just clicking the link. After downloading the data, you can easily carry all of them to Excel as you wish.
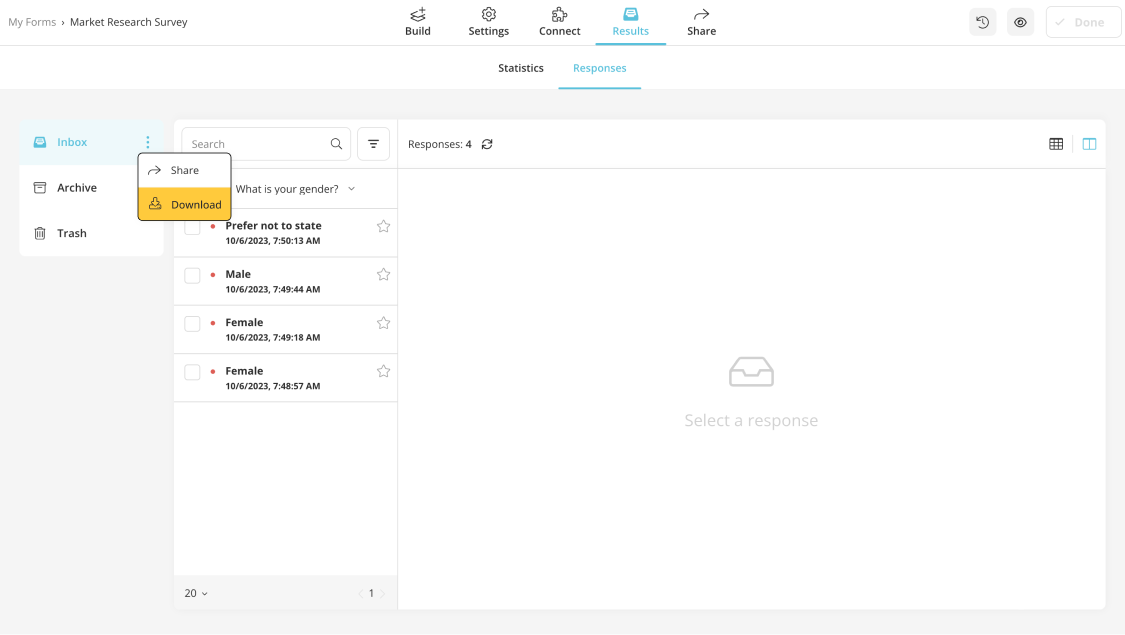
Open your survey data in Excel
3. Get the file exported
As the second step, you need to deal with the NPS data you have collected again. Your NPS survey data should be exported as a .CSV or .XLS file. After having them as a file, you can easily go on with the other steps.
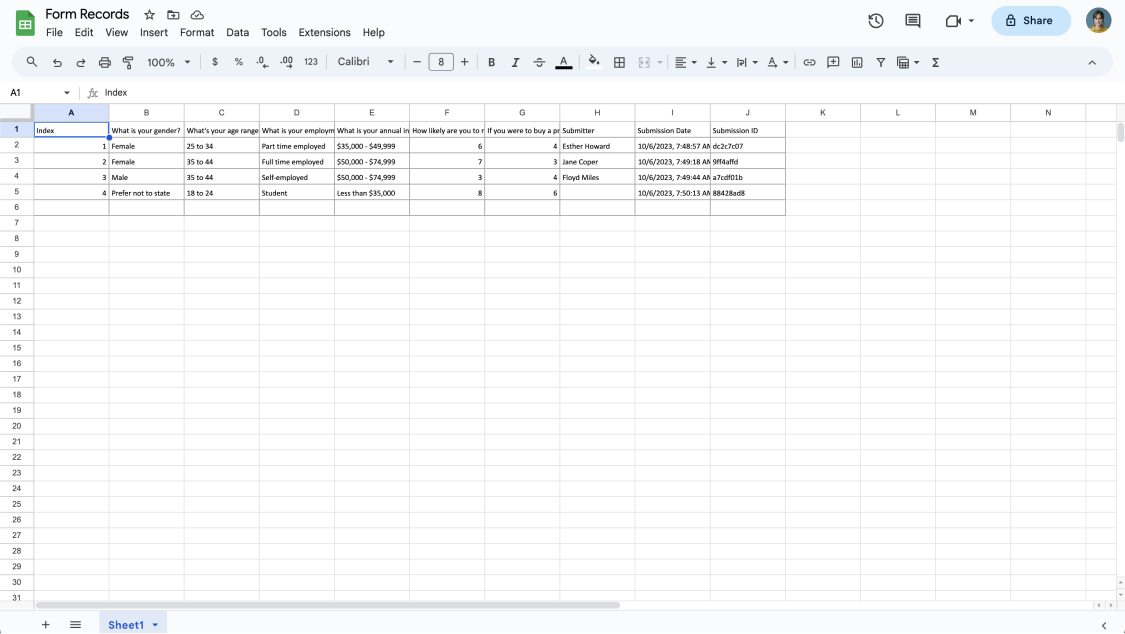
Get the file exported
When you have the whole data in Excel, you will see them in a messy situation without categorization; however, no worries because we will handle them in the next step.
4. Do the COUNTIF method
The COUNTIF function is used in statistical situations. Thanks to this formula, you will be easily able to find the exact number of the data you are looking for. The main formula can be explained as: =COUNTIF (The data you want to look for).
To give an example, while looking for promoters and if it belongs to Column A, you need to type =COUNTIF (A: A,”>=9”). Similarly, for the detractors, you need to type =COUNTIF (A: A,”<=6”). But you need to pay attention to type; do not copy and paste the function.
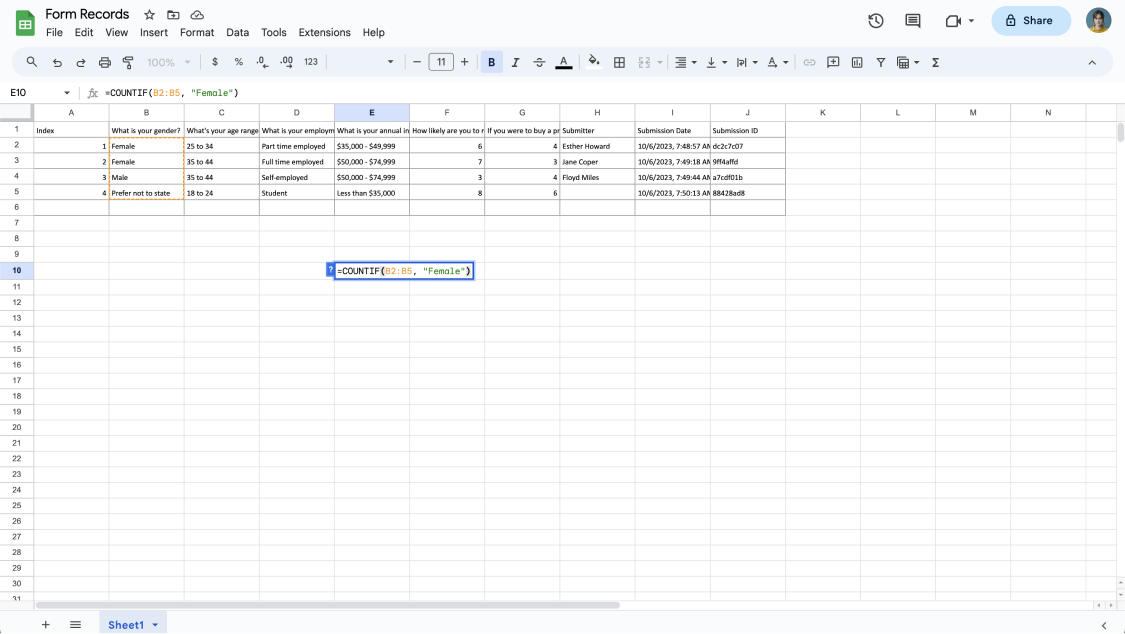
Do the COUNTIF method
5. Check the results
In the final step, now that you have the numbers as categories, you can check the results of the data you have on Excel or Google Sheets. By copying the NPS data and saving them on the Sheets, you can use them as you wish!
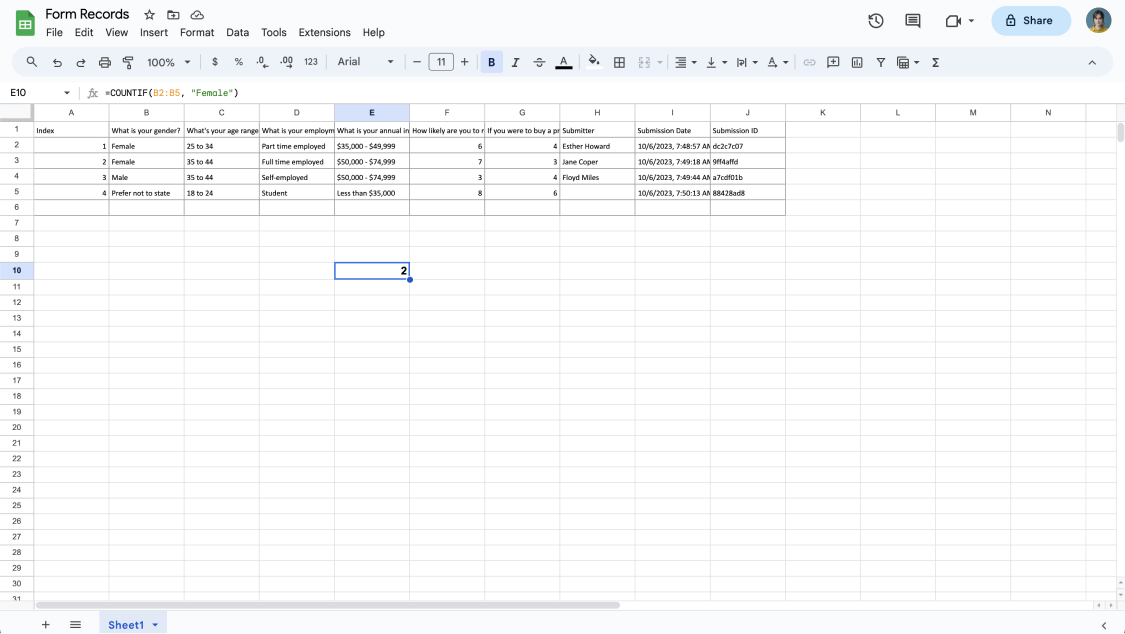
Check the results
Final words
To wrap it all up, it is impossible to deny the importance and easiness of Excel while running your businesses. Also, NPS surveys are an excellent tool for your business to learn how your customers are satisfied with the service. With the harmony of these excellent tools, you can take advantage of them because you have already learned how to calculate NPS in Excel and more!
Şeyma is a content writer at forms.app. She loves art and traveling. She is passionate about reading and writing. Şeyma has expertise in surveys, survey questions, giveaways, statistics, and online forms.


 4 min lesen