Effective decision-making is very important for success in today’s fast-paced and complex business landscape. Decision-making models provide structured frameworks and methodologies to navigate uncertainty and analyze data. These models can empower your business to make informed decisions that drive growth, mitigate risks, and leverage opportunities in an increasingly competitive environment.
Today, we will cover one of these decision-making models: the Pareto Analysis. It is a decision-making model based on the principle that a large majority of effects come from a small number of causes. We will see its suitable environments, steps to follow, examples as well as advantages and limitations. Let’s discover the world of Pareto analysis!
What is Pareto Analysis?
The Pareto analysis, also known as the 80/20 rule or the law of the vital few, is a decision-making method based on the idea that a minority of inputs typically generate the majority of outcomes. It involves identifying and focusing on the most significant factors that contribute to a particular outcome or problem.
This concept originates from the work of Italian economist Vilfredo Pareto, who observed that approximately 80% of Italy’s land was owned by just 20% of the population. This principle also applies to a wide range of fields. The essence of Pareto analysis lies in analyzing data to determine which inputs or activities are responsible for producing the majority of results.
It allows for more efficient allocation of resources and prioritization of efforts. The analysis helps businesses and individuals prioritize tasks and identify areas for improvement. It also enables businesses to optimize performance by addressing the most influential factors first. Leveraging this decision-making model is essential for achieving agility, resilience, and sustained success.
9 Steps to follow in Pareto Analysis
There are some typical steps to follow in Pareto analysis to use it in the business context. By following these steps, you can effectively use Pareto analysis to prioritize efforts and resources, address root causes, and achieve meaningful improvements in performance. Here are the 9 steps to follow:

Pareto Analysis steps
1- Define the Problem
Begin by clearly defining the issue at hand, ensuring all stakeholders have a shared understanding. For instance, if it’s a manufacturing problem, define the specific defects impacting production efficiency or product quality, setting the scope for the analysis and subsequent actions.
2- Identify Categories or Factors
Identify all possible factors contributing to the problem. In a customer service scenario, factors might include product defects, shipping delays, billing errors, customer complaints or communication issues. Ensuring comprehensive coverage of potential causes lays the foundation for a thorough analysis and effective problem-solving.
3- Collect Data
Gather relevant data on each identified category or factor. This could involve extracting information from various sources such as databases, customer feedback forms, production logs, or quality control reports. Accurate and comprehensive data collection is crucial fro the validity and reliability of the analysis.
4- Quantify Data
Quantify the data collected for each category or factor. For example, if you are analyzing product defects, quantify the number of occurrences of each defect type over a specific time period. This step involves converting qualitative observations into measurable quantities to facilitate comparison and analysis.
5- Calculate Total
Calculate the total frequency or impact of the problem by summing up the qualified data for all categories. This step provides a holistic view of the extent of the problem. It serves as a benchmark for evaluating the significance of individual categories in the Pareto analysis.
6- Calculate Percentage
Calculate the percentage contribution of each category to the total. This involves dividing the frequency or impact of each category by the total and multiplying by 100 to express it as a percentage. Percentage calculation standardizes the comparison of categories, allowing for meaningful prioritization.
7- Rank Categories
Rank the categories in descending order based on their percentage contribution to the total. The category with the highest percentage becomes the top-ranked category, followed by the next highest. Ranking the categories enables clear identification of the most significant contributors to the problem.
8- Calculate Cumulative Percentage
Calculate the cumulative percentage for each category by adding up the percentages starting from the highest-ranked category and progressing downwards. The cumulative impact percentage represents the cumulative contribution of categories to the total problem, helping visualize the Pareto principle.
9- Construct Pareto Chart: 80 - 20 Rule
Create a Pareto graph using the ranked categories and their corresponding percentages. This bar chart consists of bars for each category, arranged in descending order and along with a line graph showing the cumulative percentage. While the vertical axis will represent the frequency of occurrences and impact of each category, the horizontal axis will represent the categories or factories analyzed.
Pareto Analysis example
Pareto analysis has a mathematical and visual nature. To understand it better, let’s see a hypothetical scenario. In this scenario, H&M, one of the leading fashion and garment brands, uses Pareto Analysis and gets positive results from it:
The H&M example
H&M identifies the problem as an increase in garment defects affecting customer satisfaction and brand reputation. Categories include types of defects such as stitching errors, fabric tears and color bleeding and sizing inconsistencies. H&M collects data on customer complaints, returns and quality control reports and then quantifies the frequency of each defect type based on the feedback received.
H&M calculates the percentage contribution of each defect type to the total number of complaints or returns. It ranks the defect categories in descending order based on their percentage contribution to the total. It also calculates the cumulative percentage of defects. Using the ranked list and cumulative percentages, H&M constructs a Pareto chart.
H&M analyzes the Pareto chart and identifies the top few defect types that contribute to the majority of customer complaints. It sees the root causes, such as production errors and supplier issues. It develops and implements action plans such as improving manufacturing processes and enhancing quality control measures. As a result, H&M has greater customer satisfaction and reduced returns.
When to use a Pareto Analysis?
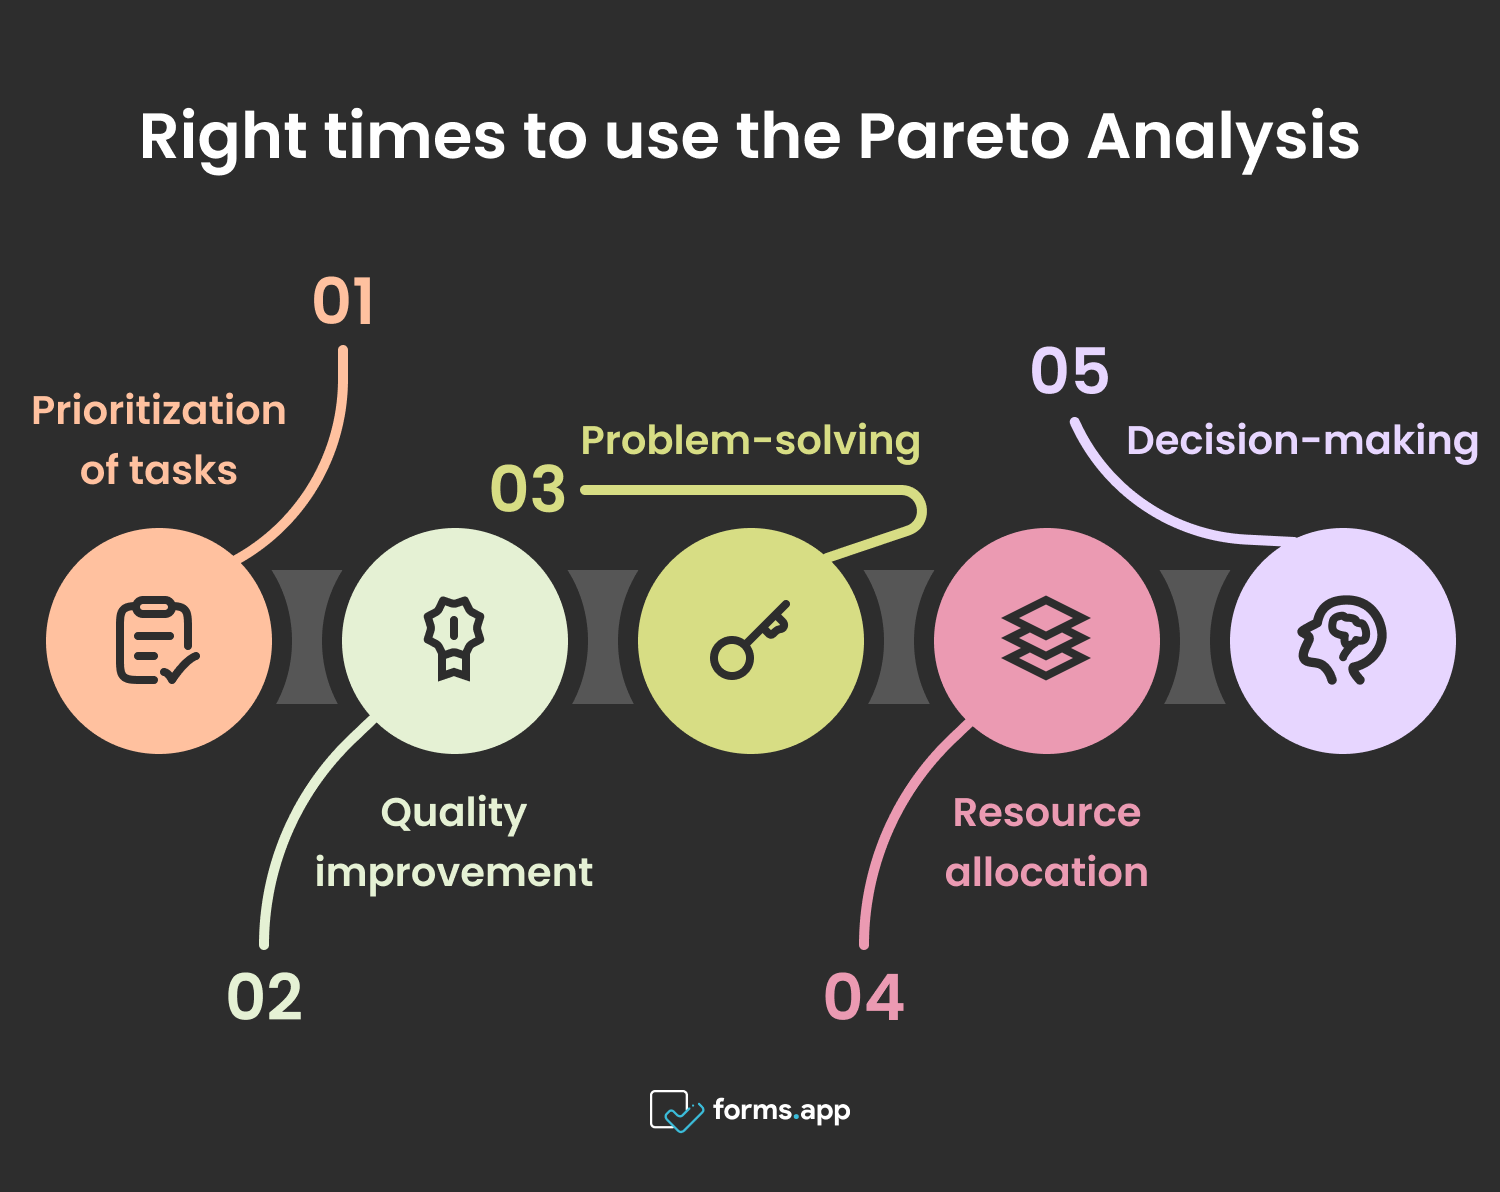
Pareto analysis is particularly useful in situations where businesses or organizations need to prioritize resources, identify key areas for improvement, and maximize their efficiency. Here are some of the suitable environments where the Pareto analysis can be applied quite effectively:

Correct times to use the Pareto Analysis
- Prioritization of tasks: Use Pareto analysis when you have a long list of tasks or issues and need to identify the most critical ones to tackle first. This method helps in allocating resources effectively by focusing on the tasks that will yield the greatest results.
- Quality improvement: Use Pareto analysis when dealing with quality issues or defects. By identifying the most frequent or severe problems, you can prioritize efforts to address them and improve overall product or service quality.
- Problem-solving: Utilize Pareto analysis when you face complex problems with multiple potential causes. By identifying the key factors contributing to the problem, you can develop targeted solutions addressing the root causes and lead to more sustainable improvements.
- Resource allocation: Use Pareto analysis to allocate resources efficiently. By focusing on the areas that have the most significant impact, you can optimize resource allocation and maximize the return on investment.
- Decision-making: Apply this model when making strategic decisions. By focusing on the critical few factors that have the most significant influence on outcomes, you can make informed decisions that lead to better results.
As you can see, the Pareto analysis is a valuable tool for your business in several cases. You can use it for prioritizing business matters, solving complex problems, allocating your resources and decision-making processes in various business and organizational contexts.
Advantages of Pareto Analysis
The Pareto analysis is a powerful tool for businesses. It helps a great deal in problem-solving, decision-making and performance improvement across various domains. Here are some of the advantages of the Pareto analysis when you use it in your business:
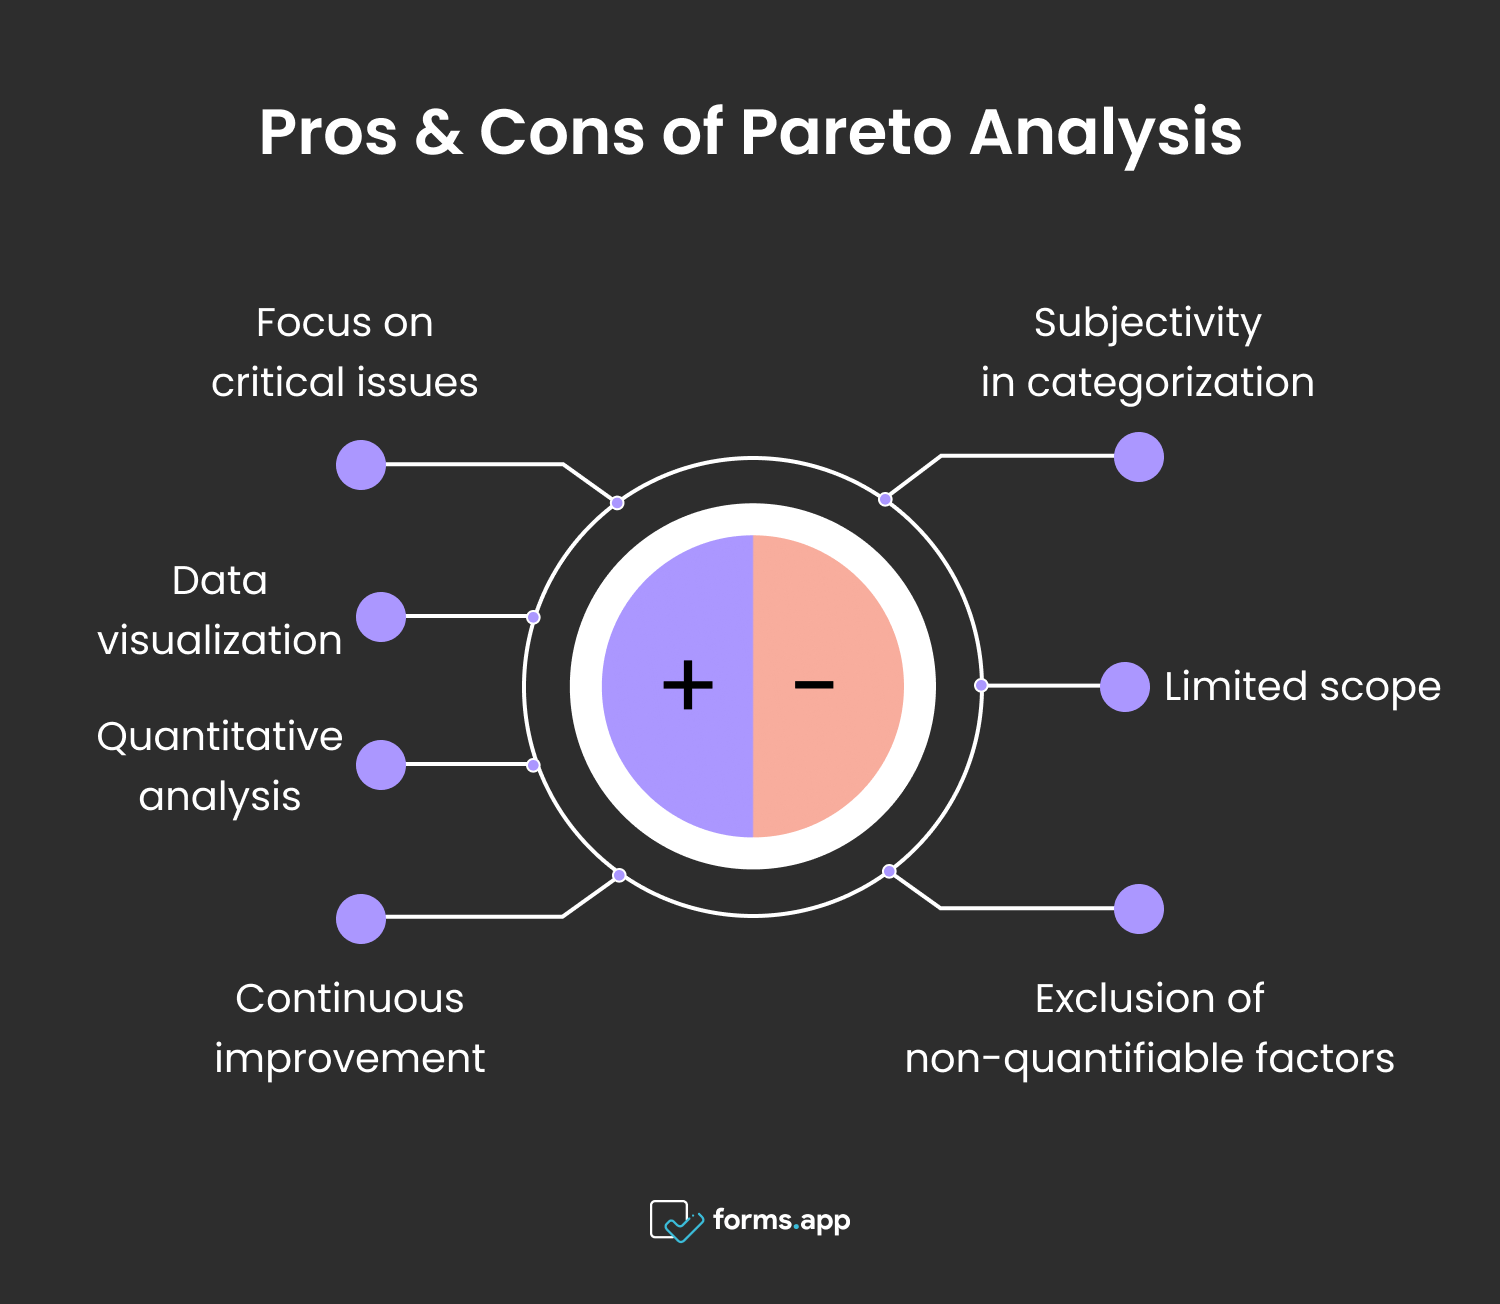
- Focus on critical issues: It identifies the vital few and trivial factors contributing most significantly to a problem, allowing resources to be directed where they will have the greatest impact.
- Data visualization: It presents data in a clear and visual format (Pareto Chart), making it easy to understand and communicate key findings.
- Quantitative analysis: It provides a quantitative basis for decision-making, allowing for objective comparisons and prioritization of issues.
- Continuous improvement: It supports a culture of continuous improvement by systematically addressing and eliminating the most impactful problems over time.

Advantages and disadvantages of Pareto Analysis
Limitations of Pareto Analysis
Although the Pareto analysis has various advantages for your business, as we discussed above, no decision-making model is perfect. Here are some of the limitations of the Pareto Analysis tool that you may encounter when using it in your business:
➖Subjectivity in categorization: The process of categorizing issues or factors may involve subjectivity, leading to potential biases in the analysis.
➖Limited scope: Pareto analysis focuses on a specific problem or outcome, which may overlook broader or complex systemic issues.
➖Exclusion of non-quantifiable factors: It may neglect some important factors that are difficult to quantify, such as cultural or organizational issues.
Despite these limitations, the Pareto analysis remains a valuable tool for identifying and prioritizing issues. This model should be used in conjunction with other analytical methods and considerations for a more comprehensive understanding of problems. When using it for your business, you should take into account both the advantages and disadvantages of Pareto analysis.
Frequently asked questions about Pareto Analysis
So far, we have covered the Pareto analysis with many of its aspects and seen its suitable environments, steps, advantages, and limitations. That said, let’s also take a look at some of the most frequently asked questions about the Pareto analysis:
There are 4 main components of a Pareto Chart. The bars represent individual categories or factors, typically displayed as vertical bars. The height of each bar corresponds to the frequency, occurrence, or impact of the category. The horizontal axis displays the categories or factors being analyzed.
The vertical axis represents the frequency, occurrence, or impact of each category, usually measured on a numerical scale. The cumulative percentage line shows the cumulative percentage of the total. It starts at 0% on the left and ends at 100% on the right.
While both a Pareto chart and a standard vertical bar graph display data using vertical bars, they serve different purposes. A Pareto chart ranks categories by frequency, or impact with the vertical axis showing cumulative percentages. In contract, a standard bar graph typically displays individual values without prioritization or cumulative analysis.
You can use the Pareto chart for root cause analysis by identifying the most significant factors contributing to a problem. By focusing on the vital few factors, it helps prioritize investigation efforts to determine the underlying root causes and makes it easy for you to find targeted solutions for long-term problem resolution.
Key takeaways
In conclusion, the Pareto chart is a valuable tool for businesses, and it offers practical insights for businesses striving to optimize their performance. It helps them address critical issues effectively by identifying the vital factors. You can simply follow the typical steps of the Pareto analysis in your business environment and witness its advantages.
In this article, we covered the Pareto analysis, including the typical steps, suitable environments, advantages, and limitations. We have also seen a scenario to understand this visual model better. Last but not least, we have answered the frequently asked questions. Now that you know more about the Pareto analysis, you can start using it in your business!
Fatih is a content writer at forms.app and a translator specializing in many text domains, including medical, legal, and technical. He loves studying foreign languages. Fatih especially likes to create content about program management, organizational models, and planning tools.


