Google Sheets comes with features to make data work smoothly and efficiently. Among these many tools, learning how to make a pie chart in Google Sheets stands out for enhancing how we present and interpret data. With the ability to create visual elements, Google Sheets turns complex information into easy-to-understand visuals. Analyzing trends and key data points is straightforward, helping you make decisions faster.
In this guide, you'll learn the essentials of creating a pie chart in Google Sheets. We will cover everything from selecting the right chart type to using the pie chart maker effectively. By the end, you will be skilled in choosing the correct chart type and creating a pie chart that highlights key data points.
When to use a pie chart
Pie charts are best for displaying data easily and naturally. These chart styles excel when illustrating the composition of a whole, revealing how individual sections contribute to the total. They provide a clear visual comparison of different parts, making them ideal for presenting percentage or proportional data.
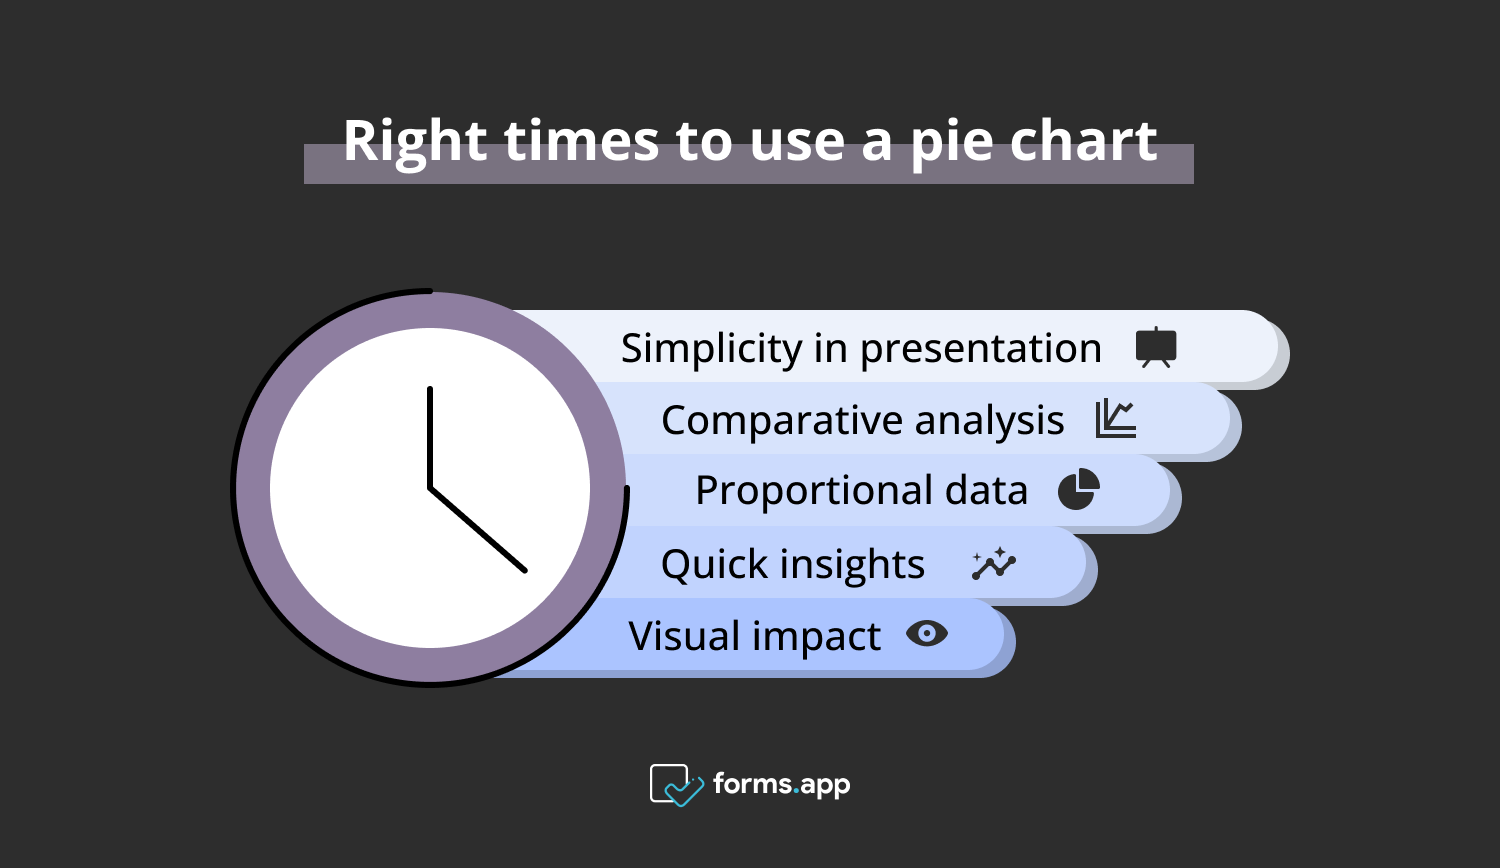
Ideal times to use pie charts
- Simplicity in presentation: Best for datasets with a clear, concise structure.
- Comparative analysis: Useful for highlighting the differences between categories.
- Proportional data: Ideal for showing how parts make up a whole, like budget allocations.
- Quick insights: Allows for immediate understanding of data distribution.
- Visual impact: Engages viewers with an easy-to-interpret visual format.
Why do you need a pie chart in Google Sheets?
A pie chart is vital for turning complex datasets into clear visuals in a Google spreadsheet. Selecting a chart like this can be crucial for effective data analysis and presentation. A pie chart in Google Sheets can quickly highlight key data trends and patterns, making it an essential tool for any data-driven task.
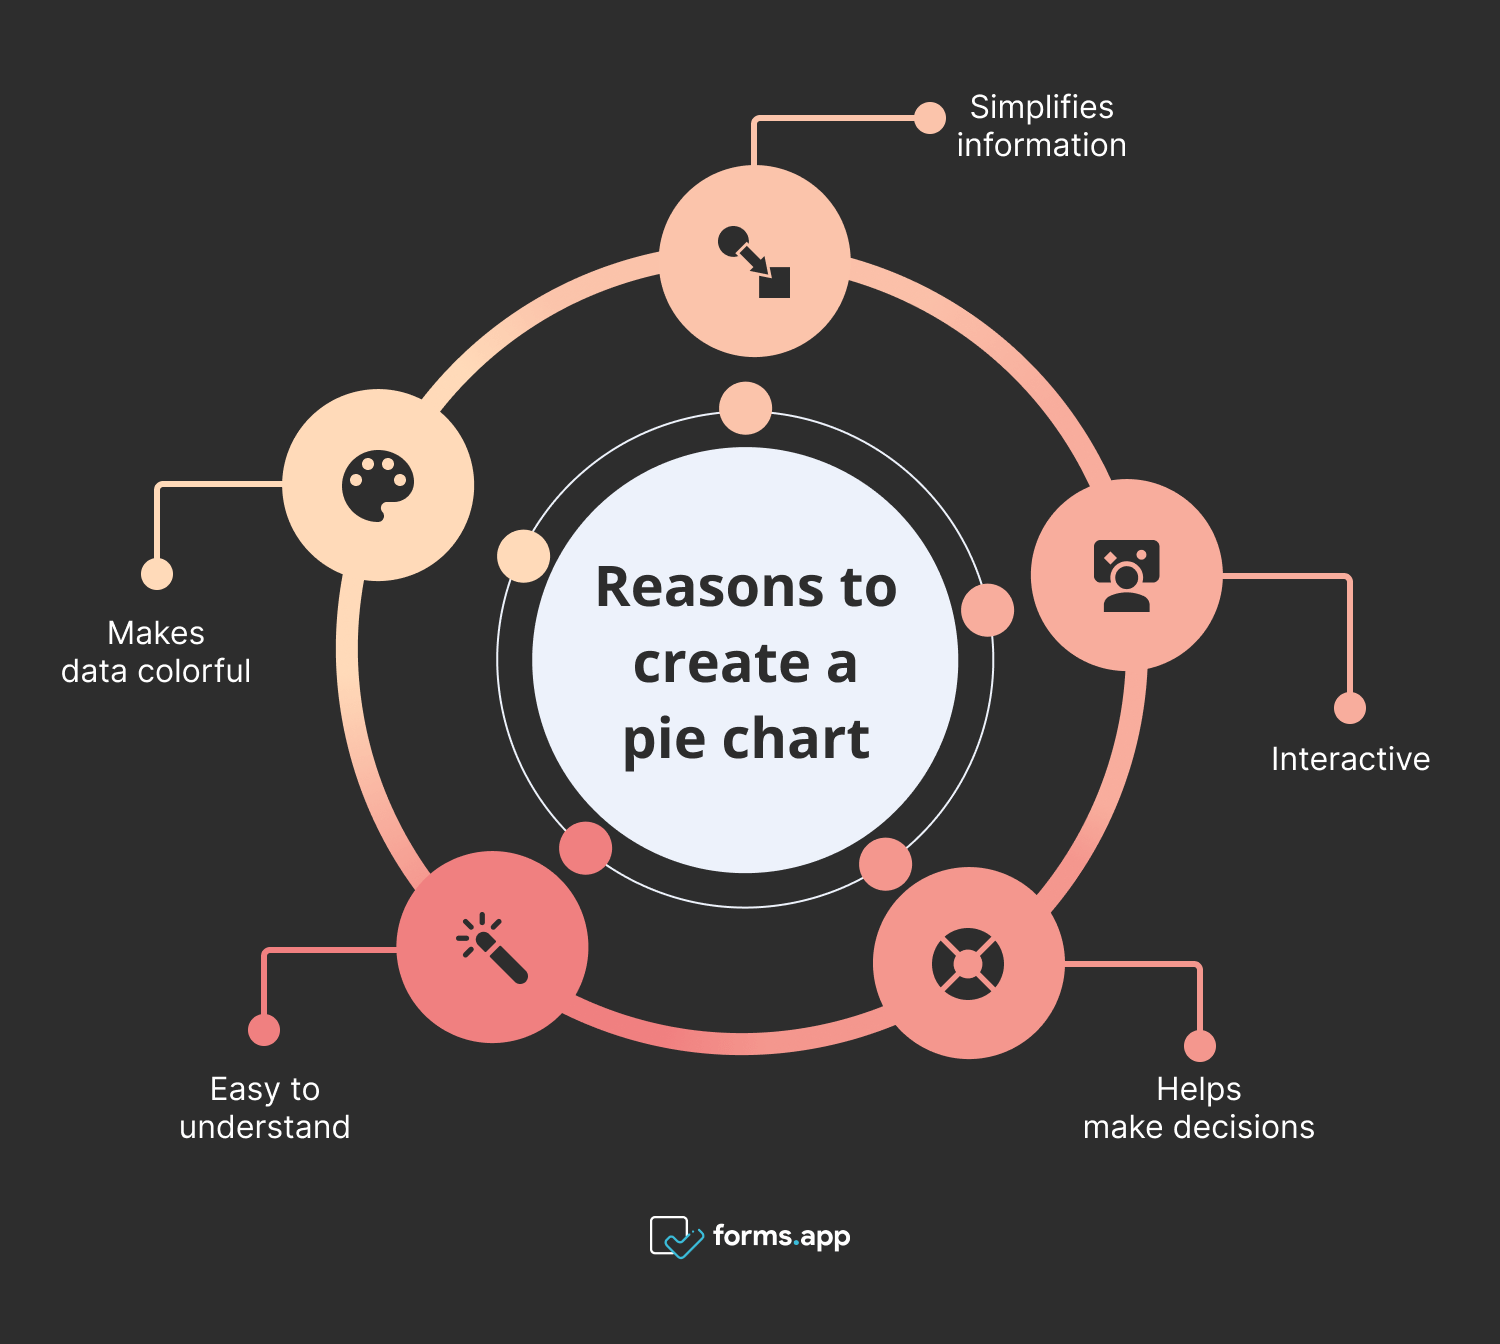
Reasons to create a pie chart in Google Sheets
- Makes data colorful: Changes numbers into colorful visuals for quick analysis.
- Easy to understand: Simplifies complex information into clear parts.
- Helps make decisions: Provides clear visuals to aid in decision-making.
- Interactive: Allows users to interact and get familiar with the data.
- Simplifies information: Breaks down hard data into simple pieces.
How to create a pie chart in Google Sheets (step-by-step)
Creating a pie chart in Google Sheets allows you to google sheets pie chart show values and make charts easily understandable. This step-by-step guide will walk you through the process of turning your data into a visually appealing and informative pie chart.
1. Step
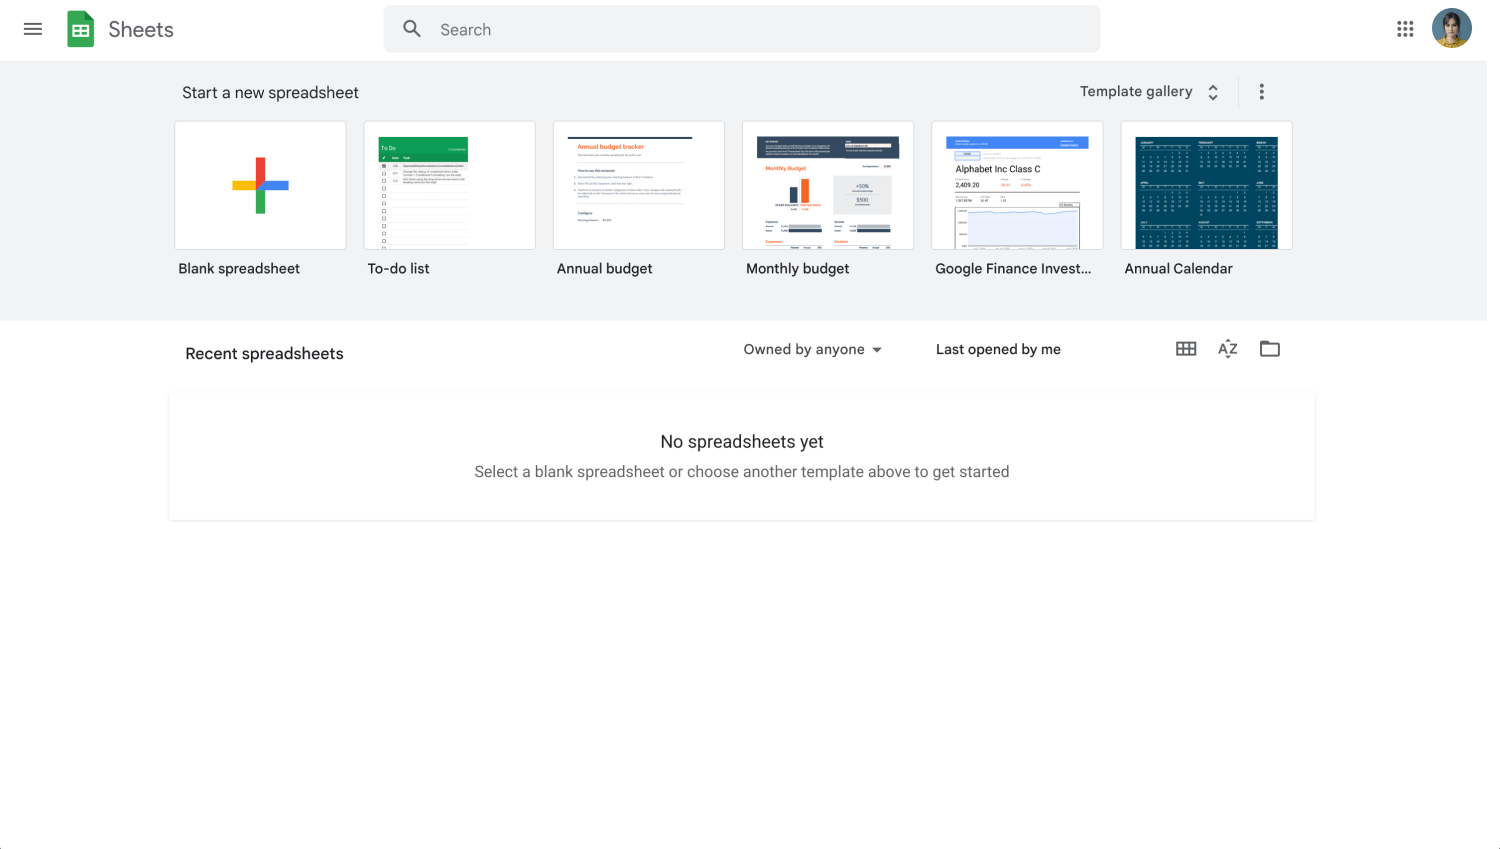
Google Sheets dashboard
Log into your Google account and open Google Sheets. Select the sheet containing the data you want to visualize or create a new one to input your data.
2. Step
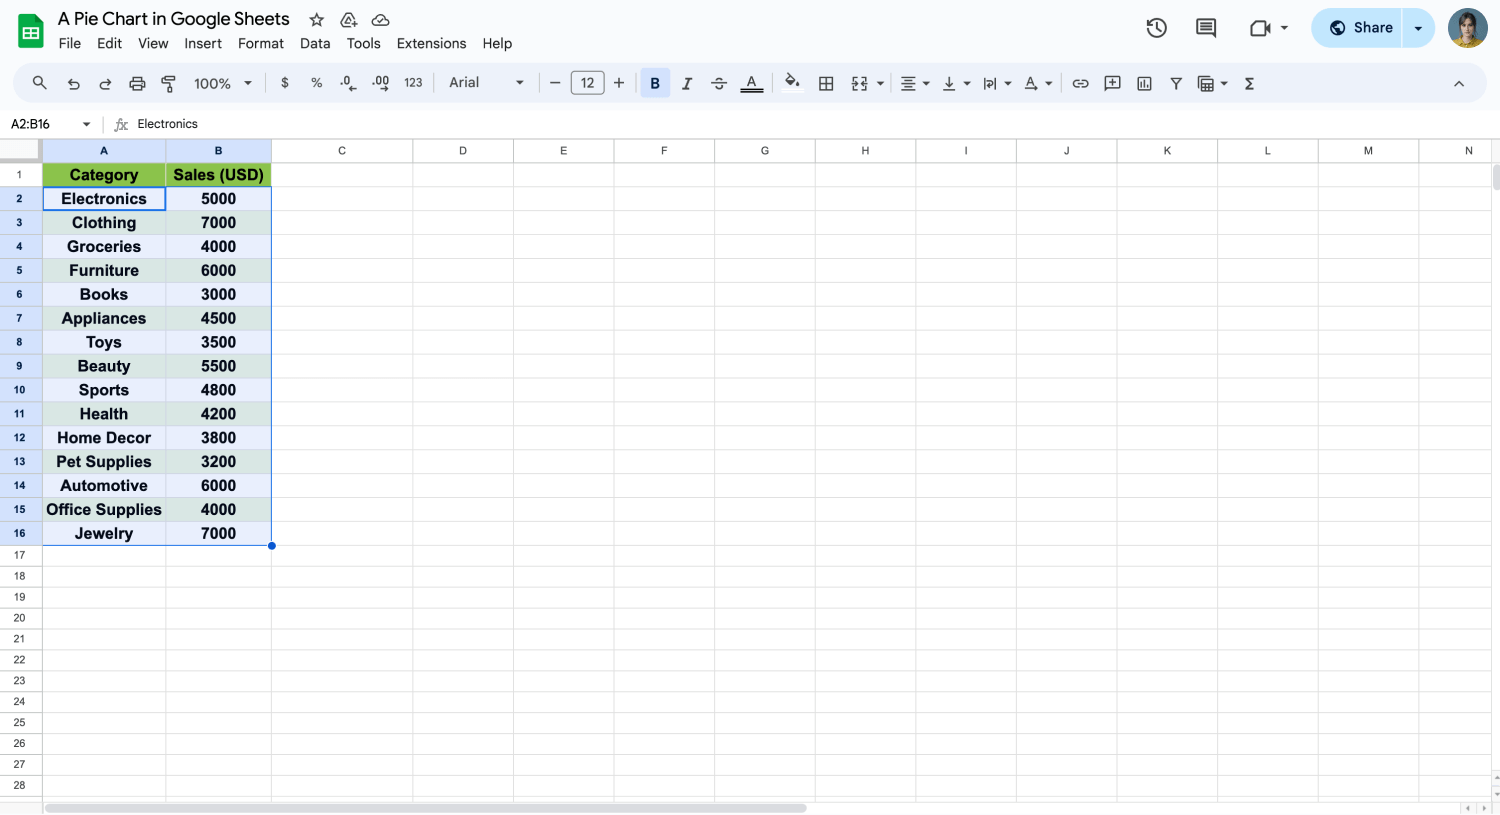
Choose your data to insert a pie chart
Click and drag to highlight the data for your pie chart. Make sure you have one column for categories and another for their values arranged neatly.
3. Step
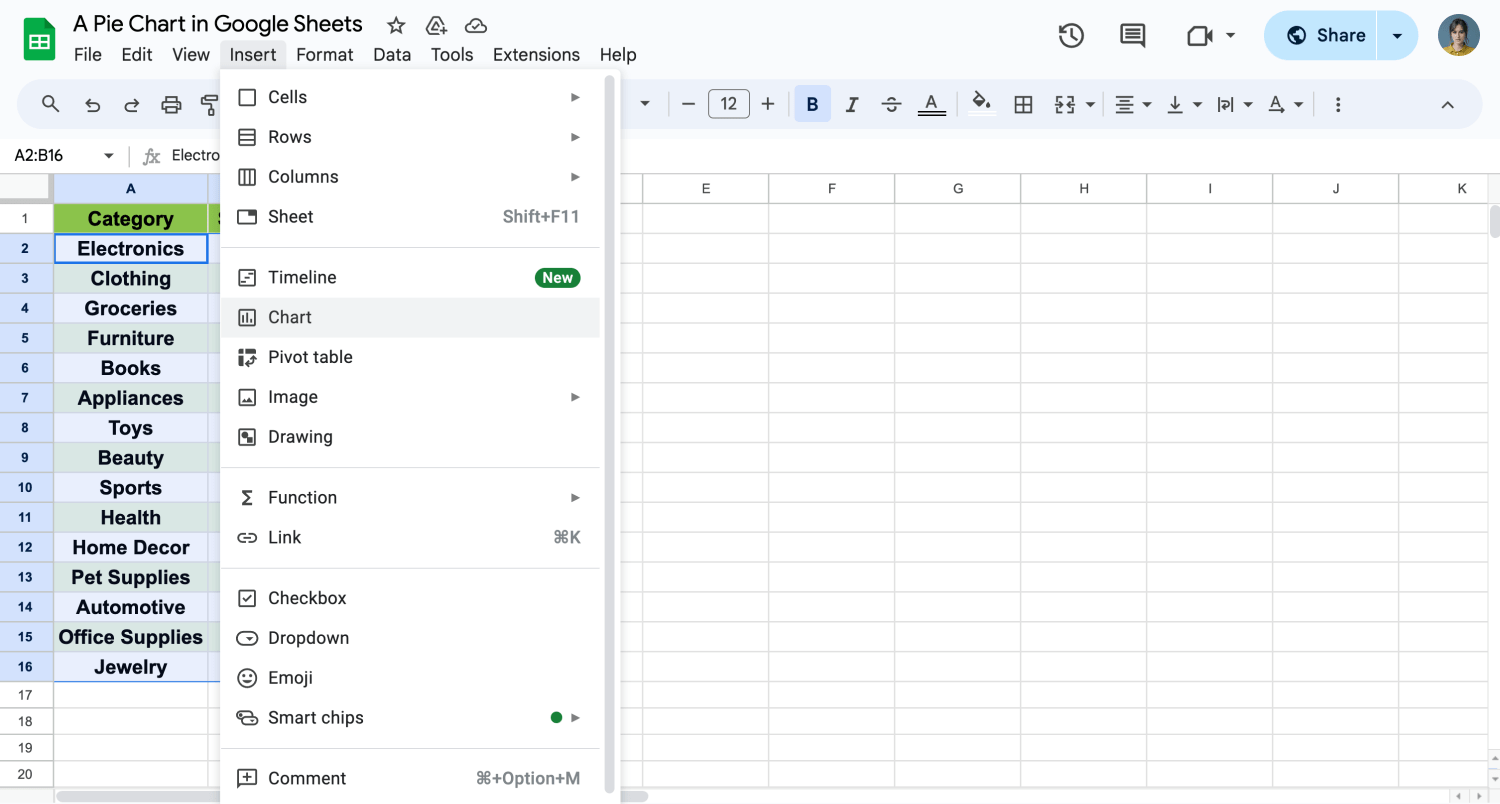
Insert a pie chart
With the data selected, click on the “Insert” menu, then select “Chart”. This action will open the chart editor, where you can choose the type of chart you want to create.
4. Step
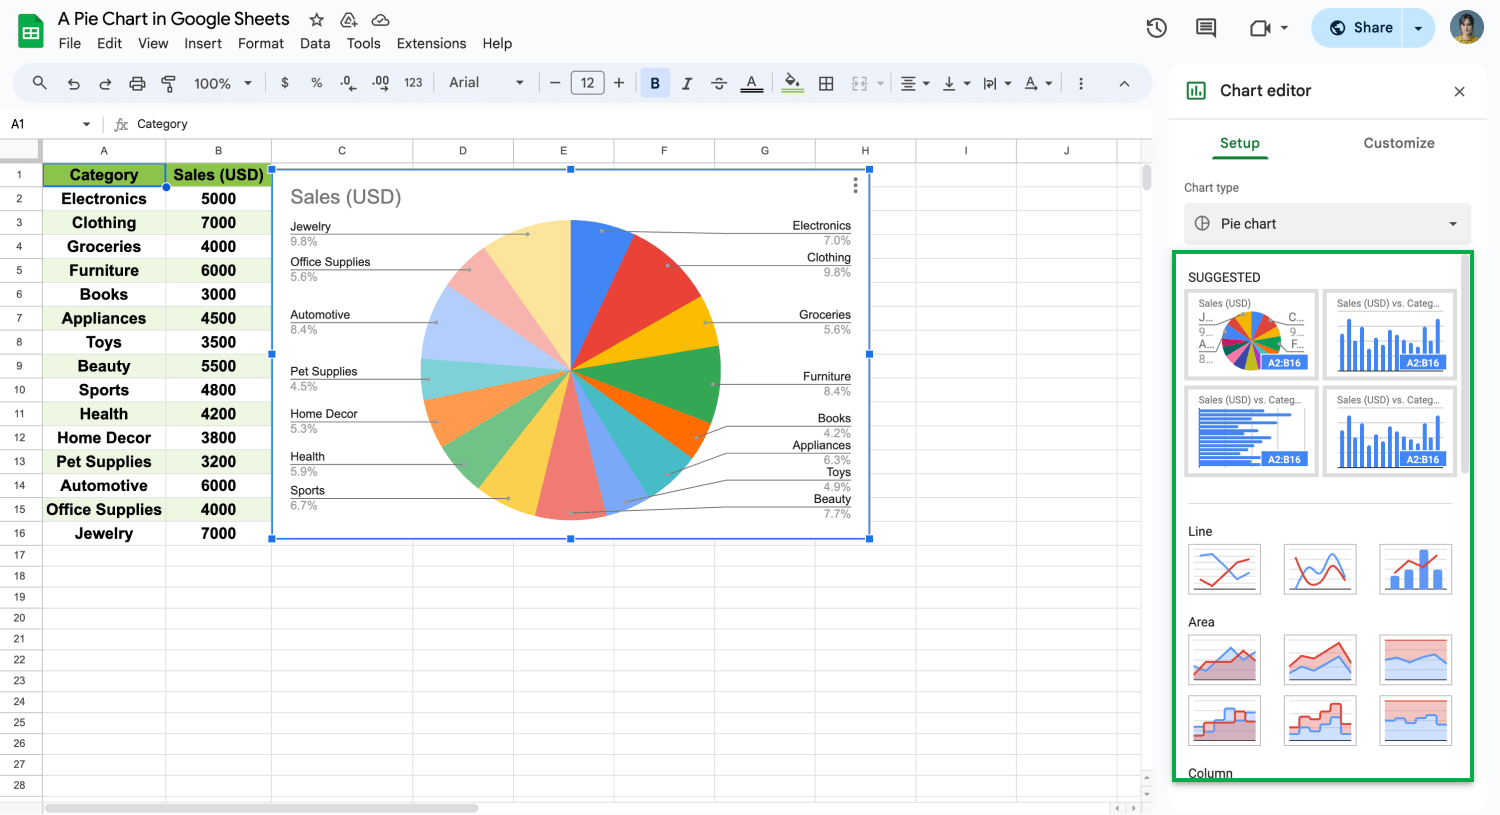
Choose a chart type
In the chart editor, navigate to the “Chart type” section and select “Pie chart” from the list of available chart types. Now that we have created our chart, the next step will be to customize it to look more professional.
5. Step
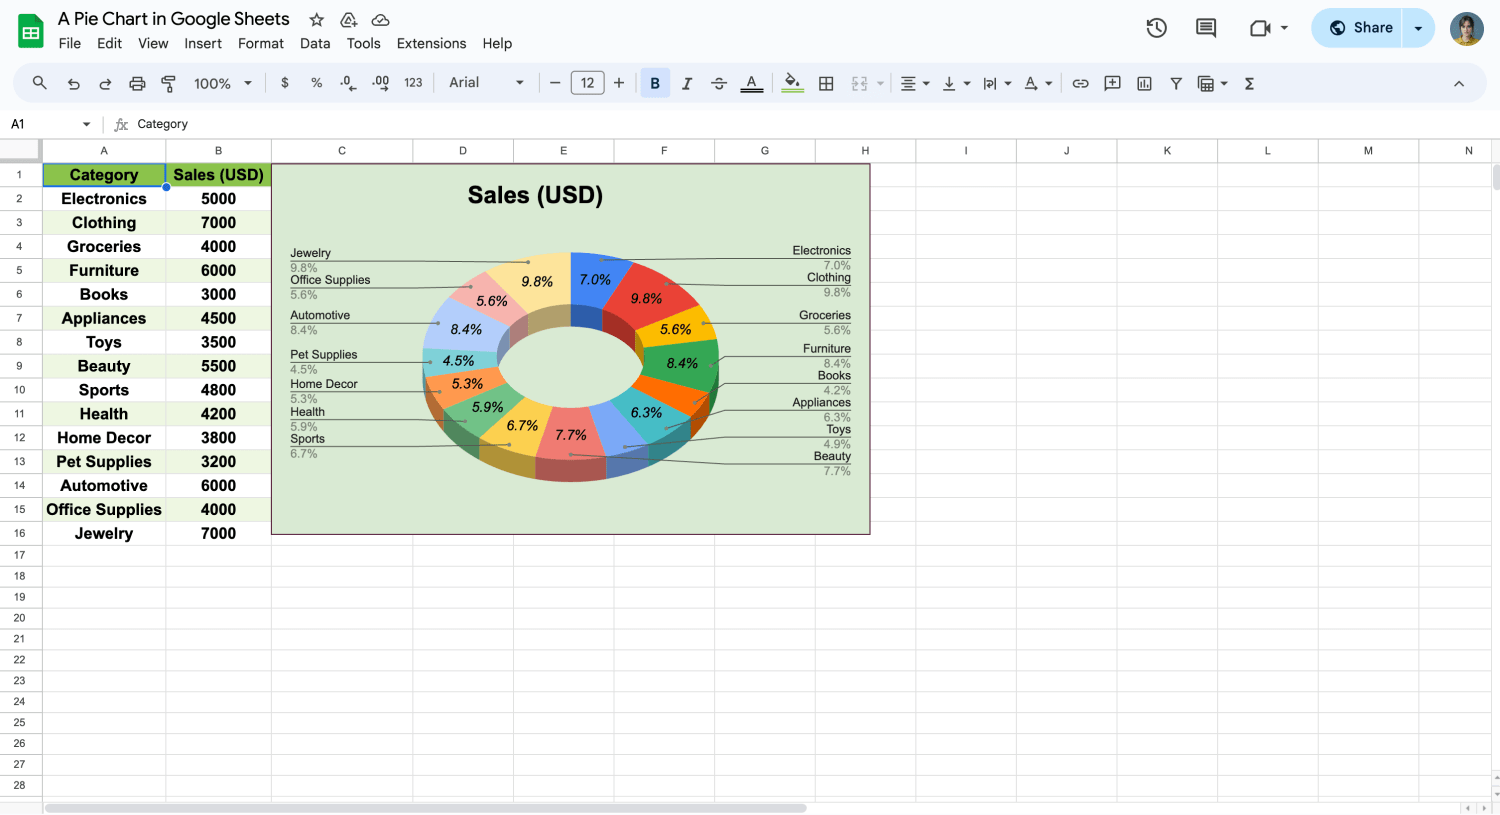
Customize your pie chart
After clicking the three points on the right-up corner, you can use the customize tab in the chart editor to make your pie chart more informative. In “Chart Style,” you can change the color of the background and draw lines for your chart. For this example, we chose a “3D” box to give a better look.
You can also add a “Donut Hole” to shape it in an aesthetic way in the “Pie Chart” part. Discovering other custom options will expand your skills to catch the best chart look for your data.
6 tips for a better pie chart
Enhancing your pie chart in Google Sheets not only makes it more visually appealing but also more effective in conveying your data's story. With the right techniques, you can transform a basic pie chart into a powerful tool for data presentation. Here are six tips to customize your chart and make it stand out:
💡 Use clear labels: Ensure each segment of your pie chart has clear, descriptive labels. This will help viewers understand the data without needing to refer back to your dataset.
💡 Choose the right chart template: Start with a suitable chart template that fits your data. This can provide a solid foundation for your customization efforts, ensuring that your pie chart effectively represents your data.
💡Use doughnut charts for variety: Consider using doughnut charts as an alternative to traditional pie charts. They offer a modern twist and can help to highlight data points more effectively.
💡Adjust the background color: Enhance the readability of your chart by choosing an appropriate background color. A contrasting background can make your chart more striking and easier to understand.
💡Customize your chart details: Pay attention to the details when you customize your chart. Adjust the legend, labels, and colors to make the chart clear and easy to read. This attention to detail can make a big difference in the effectiveness of your pie chart.
💡Explore other graph types: To deepen your data analysis, learn how to create line graphs and make x-y graphs in Google Sheets. These graph types provide additional ways to visualize trends and relationships, enriching your overall data storytelling.
Frequently asked questions about Google Sheets pie charts
Google Sheets pie charts are a popular tool for data visualization. They help in simplifying complex information into easily digestible visuals. Many users have questions about creating and customizing these charts effectively. Let’s address some common queries to enhance your chart-making skills:
To show values in a pie chart, click on your chart, then select the "Chart Editor" on the right. Under the "Customize" tab, find the “Pie Chart” section and check the option to display values on the chart.
For a beautiful chart, use the "Customize" tab in the chart editor to adjust colors, fonts, and backgrounds. For a more polished look, consider adding drop shadows or changing the chart style.
To make a Google chart, select your data, go to the “Insert” menu, and choose “Chart”. From there, you can pick the type of chart you want to create and customize it to your liking.
In Excel, highlight the data for your chart, click on the “Insert” tab, and choose “Pie Chart” from the available chart options. Then, select the specific style of pie chart you want to use.
Final words
Throughout this guide, we've detailed the process of creating and customizing pie charts in Google Sheets, demonstrating the critical role of visual data in effective communication. By mastering these skills, you can transform raw data into clear, impactful visual stories.
Our articles provide insights into advanced Google Sheets features, teaching you to add a date picker or to add a drop-down menu. These enhancements make your spreadsheets more interactive and user-friendly, helping you to manage and analyze data more efficiently.
Behçet is a content writer at forms.app. He is a music producer and enjoys blending electronic and acoustic tunes. Behçet has expertise in Google Sheets, survey questions, and online forms.
