Predictive analysis is extensively used in businesses as a tool to predict the future. It is preferred especially because it produces more successful results with the increasing number of analysis models in recent years. Both small and large businesses use this type of analysis with peace of mind. Because, as will be explained, the working logic is quite simple, and the outputs are quite effective.
In this article, what predictive analysis means, its advantages, and methods will be explained to you. And they will be supported by examples. By the end of the article, you will become competent in predictive analysis, and you will be able to start using it for your business.
First thing first: What is a predictive analysis?
Predictive analysis is a data analysis technique using historical data to forecast future trends. In other words, in order for predictive analysis to take place, it is necessary to feed it with historical, real-life scenario examples. But other than that, predictive analysis uses statistical modeling and machine learning algorithms to get actionable insights. Therefore, it is a valuable type of analysis that businesses benefit from before taking necessary steps.
Apart from businesses, it can also be used in weather forecasts, investments, banking transactions, credit qualification, and even video game creation. However, it should be noted that all of these fields contain values that can be measured with numerical data. In other words, it is a quantitative analysis type, not a qualitative data analysis. However, the fact that it is useful in so many different areas shows how useful the data it provides is.
Advantages of using predictive analysis
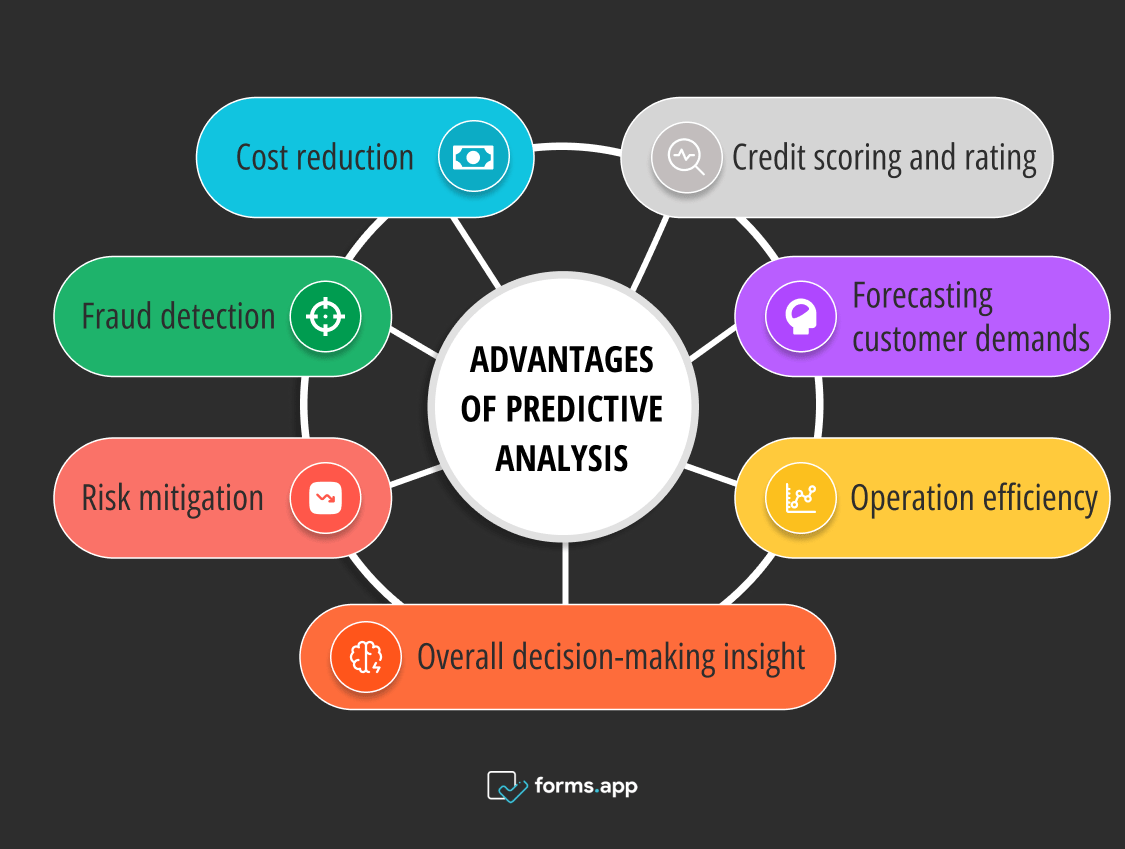
Predictive data analysis is one of the main principles of future planning for businesses. To give a comparative example, situational analysis mostly uses real-time data, while predictive analysis uses historical data. It is a powerful tool as it statistically reveals the risks that the business may face in the future, future customer trends, and the economic and social situation in the long term. But it is not limited to these; you can check the general benefits listed here:

Benefits of predictive analysis
- Cost reduction: You can calculate the right time and efficient ways of business actions with the modeling offered by predictive analytics techniques to minimize overall expenses.
- Fraud detection: It helps you take a stand against fraud by examining historical data and identifying unusual activity patterns. Using predictive analytics software will be a good start for this job.
- Risk mitigation: Sometimes, it may not be clear when and where a risk will arise for a business. However, this generally applies to businesses that have not previously prepared themselves for such situations with a method such as predictive analysis. If they had done this analysis in time, they could have mitigated the risk.
- Credit scoring and rating: You can analyze credit scoring and rating with historical data not only in terms of banking but also to calculate the credit of another company. This way, you have a prediction that you can use when making decisions about prospective borrowers and business partners.
- Forecasting customer demands: You may have heard that a type of analysis, such as narrative analysis, is used to analyze customer demands. But narrative analysis is a qualitative type of analysis and won’t give you numerical statistics like predictive analysis does. Therefore, you can solve the supply-demand relationship more easily with predictive analysis.
- Operation efficiency: Businesses can benefit from predictive analysis tools to direct work and resource flow correctly and efficiently. For example, if you make a detailed analysis of the supply chain, you can make your inventory management easier.
- Overall decision-making insight: Of course, all this data analysis is to enable businesses to have a better decision-making process. You can use many different analysis types for this, but eventually, you will use one of the main analysis types: descriptive, predictive, and prescriptive analysis. And among these, predictive analysis gives you insights in a quantitative way.
These were some of the benefits of predictive analytics. It is a very useful method that provides reliable data as it can be used in many different areas of your business. However, since how it is performed here is not explained, predictive analysis techniques will be explained in the next title.
Techniques & methods of predictive analysis
There is a wide range of predictive analysis techniques you can use to turn your big data into actionable insights. These various methods are generally integrated with software and artificial intelligence models. In this way, they can make effective statistical modeling that is free from errors that humans can make manually.
Without further ado, you can read the common techniques of predictive analysis with examples in the following articles:
Regression analysis
Regression analysis is used as a predictive analysis method to explore the relationship between a dependent variable and one or more independent variables. It provides a numerical prediction value as a result of the calculation of these variables.
Example: You plan to sell a product (dependent variable). Therefore, you want to estimate the television advertising expenses and billboard expenses (independent variables) for this sale. If you apply the regression model, you can evaluate the impact of each of these factors with quantitative values. As a result of this model, if a positive correlation is found between independent and dependent variables, you can spend the necessary expenses on advertising for your business.
Decision trees
Decision trees visually show decision-making processes with a tree diagram using data-mining algorithms. The branches of the tree represent an idea, and the leaves of these branches become an outcome segment. Therefore, it is a suitable method for classification-based predictions.
Example: When you create a sales decision tree, it will have branches like this: marketing, customer satisfaction, wholesale, retail, etc. By evaluating these branches, you can see possible predictions about the sales situation for your business at a specific time or place.
Clustering
Clustering is a method used to group inherent patterns or typical characteristics of data. It is an element that helps in naturally examining the data and breaking it into segments for a more detailed analysis.
Example: Your business has an e-commerce application. You can divide your customers here into segments and group them according to their common points. In this way, you can better serve customers' preferences and offer them suitable opportunities more easily.
Classification models
Classification models actually follow a similar method to clustering. It basically classifies data through defined patterns or specified classes. Although it is usually binary, it can also be multiclass. If it is binary, it can show results such as yes-no, while in multiclass, it can show results such as small, medium, or large.
Example: It can be used in customer churn prediction. When you make classification models with appropriate data, you can reveal your customers' churn patterns. This will help you take appropriate strategies to reduce potential churn risks in the future.
Time series forecasting
Time series forecasting is a modeling method used to reveal connections and patterns between data collected at different time intervals. It is important to examine a situation at different time intervals, as the results obtained by evaluating data all alone from a certain time may be misleading.
Example: You can use this to predict the differences in your sales between years, seasons, and months. Or to analyze when your sales are in demand and when they are in decline.
Frequently asked questions about predictive analysis
If you have questions in your mind because you are wondering but need help finding the answer or are just confused about some parts, you can take a look at the FAQ. Here, you can find a short and concise answer about the information you are looking for without going into too much detail.
Outlining the goal, collecting the data, using algorithms and techniques to analyze the data, and lastly, deploying the predictive model.
The most common tools in predictive analysis are machine learning algorithms and programming languages such as Python and R. Apart from this, many different tools such as RapidMiner, MonkeyLearn, and Rattle can be used to collect data. MC Power Bl, Tableau, and SAS Bl can also be used as business intelligence tools.
First of all, you should clearly define your objectives and start collecting relevant data for your analysis. Then, identify the patterns in the data and choose appropriate modeling methods. And lastly, evaluate the model and use it in your decision-making process.
Although they resemble each other in the fact that they are used to estimate future outcomes based on historical data, predictive analytics has a broader scope. At the same time, forecasting focuses on a narrower result. Predictive analytics uses data to model various areas, but forecasting doesn't have such a comprehensive specialization.
Conclusion
All in all, it can be said that predictive analysis is an important basis for businesses. And it's also a great way to keep up with changes. Of course, it achieves this with accurate historical data using advanced algorithms and artificial intelligence. Thus, a business continues to exist in the competitive market. And it solves, at least to some extent, the unknown complexity of the future. Because of these benefits, it is very necessary for businesses that want to grow and constantly strengthen their place in the market. In this article, what predictive analysis is, its benefits, and methods are explained under separate headings so that you can benefit from it. From now on, it is up to your initiative whether to use it to develop further.
Atakan is a content writer at forms.app. He likes to research various fields like history, sociology, and psychology. He knows English and Korean. His expertise lies in data analysis, data types, and methods.


