Analyzing and using data correctly is vital for companies. Data visualization is crucial for businesses faced with the complex world of data. It is very important in an increasingly digitized world. It allows one to analyze data correctly and make decisions based on data.
The increasing production and utilization of data have also created complexity. Managing this complexity and making effective use of data is possible through data visualization. In this article, we have compiled 20+ data visualization statistics for you to understand the subject better. Let's move on to our eye-opening article without wasting any more time:
Why do you need data visualization?
Analyzing and interpreting data is crucial for a company's success. Data visualization allows one to analyze data effectively and make inferences from it. Data visualization aims to present data in a more understandable and engaging way to the target audience. In addition, some of the benefits of data visualization can be listed as follows:
Pros of using data visualization
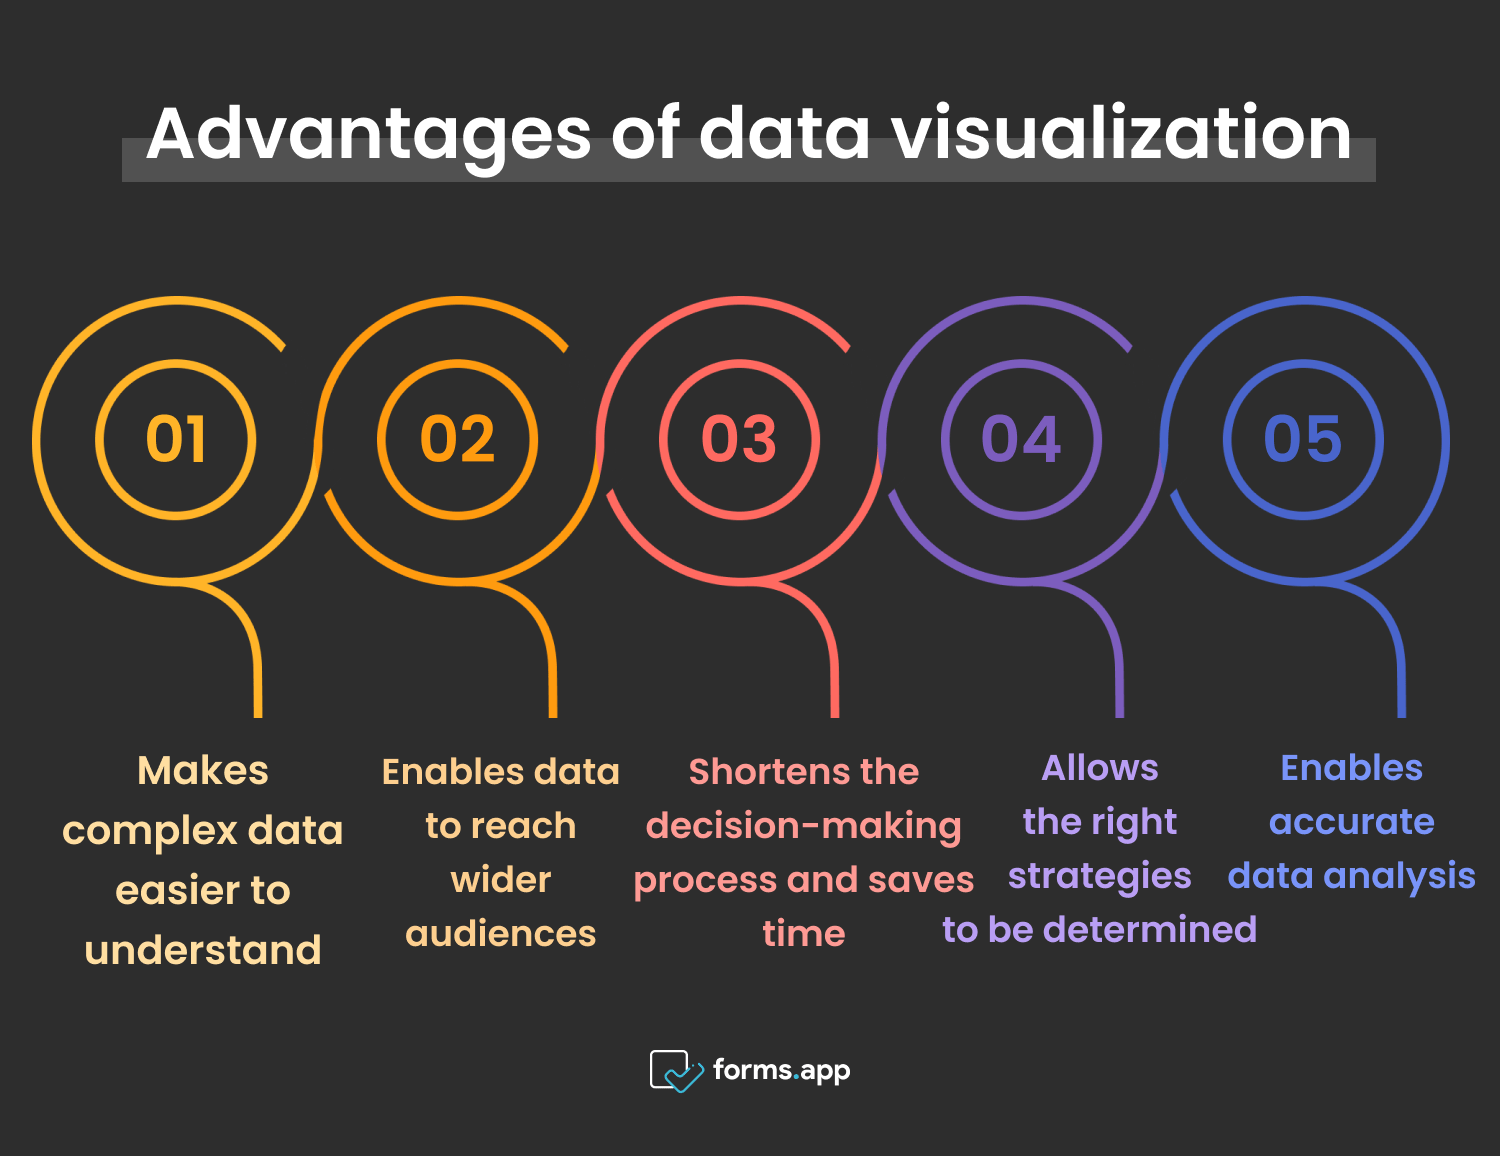
- Makes complex data easier to understand
- Enables data to reach wider audiences
- Shortens the decision-making process and saves time
- Allows the right strategies to be determined
- Enables data to be analyzed and accurate results to be obtained
20+ Eye-opening data visualization statistics
Data visualization statistics and branding statistics will give you insights about the topic and encourage you to use visual data. You will also find out why you should use data visualization and the best data visualization tools. Now, let's move on to our 20+ data visualization statistics, where you will see data visualization examples:
1. Data visualization saves time.
Data visualization allows you to understand and interpret information quickly and clearly. When a data visualization strategy is used consistently and correctly, it makes information memorable. According to the American Management Association, using data visualizations could shorten business meetings by 24%.
As you can see from this useful statistic, data visualization can help companies save time. It makes complex data easily understandable in meetings and increases efficiency. This is why you should consider using data visualization software before your next business meeting.
2. More than half of businesses think that poor-quality data leads to failure.
Companies with ineffective data utilization will have ineffective marketing strategies. Invesp shared an interesting fact that can help you understand the importance of data and data visualization in marketing. 54% of businesses claim that incomplete and poor-quality data is their most significant obstacle to successful data-driven marketing.
Companies that cannot effectively utilize the correct data cannot achieve the desired results from their marketing campaigns. They cannot correctly identify their target audience and determine their needs. Therefore, companies should get help from data analysts and data visualization before determining their marketing strategies.
3. Companies prioritize the use of data.
According to a survey conducted in 2023 by Statista, most firms stated that investing in data and analytics was their top priority. Only 37% of respondents claimed that their attempts to enhance data quality had been successful, underscoring a persistent problem that businesses in all industry sectors face.
As can be seen from this statistic, companies have prioritized their investments in data and analytics. This shows that data science and data scientists play a significant role in the success of companies. In addition, the overall failure to enhance data quality shows that data analysis and visualization need to be utilized more.
4. Using visual data helps you get the results you want from the target audience.
If you want to encourage the audience to take a specific action in your presentation, you should use data visualization. The American Management Association proved that presenters who used visual aids were 43% more successful in getting their listeners to act in a certain way.
Presentations that utilize visual data are more successful in motivating the target audience. Data visualization increases the impact of presentations on the audience and allows you to get positive feedback. With data visualization, you can present especially big data to your target audience in the most efficient way.
5. Data generation per day has increased significantly in the last 10 years.
The growing use of the internet each day leads to an increase in the amount of data generated and used. A study conducted by SG Analytics proved that 2.5 quintillion bytes of data are generated daily by the approximately 4.66 billion active Internet users worldwide, which is a significant increase from the mere 2.6 billion in 2013.
The increasing usage of open-source data has also increased the importance of data visualization. Data visualization makes it possible to manage and understand this data. By using data visualization strategies widely, companies can avoid confusion and grow their business.
6. The data visualization market is growing rapidly.
A statistic by Statista displays the revenue from the global data visualization market in 2017 and 2023. The data visualization market was expected to be worth 4.51 billion US dollars in 2017. It is anticipated to grow at a compound annual growth rate (CAGR) of 9.47% to reach 7.76 billion US dollars by 2023.
With the understanding of the benefits of data visualization, its use has increased day by day. Companies have often encouraged the use of this strategy and increased their investments in this area. Data visualization benefits almost every field and plays a vital role in many industries.
7. Images increase conversion rates for businesses.
Data visualization makes a significant contribution to determining strategies to improve companies' situations. It also enables companies to improve their online presence. Jeff Bullas proves that images in local search results increase a business's chances of being considered or contacted by 60% of customers.
Data visualization increases engagement and ensures that the messages you want to convey reach the intended audience. By creating visuals, you can attract the attention of your target audience and make them prefer your brand.
8. The use of data is underutilized by marketers.
Using data in marketing is crucial to accurately analyze and understand the industry, competitors, and target audience. However, data analysis and visualization is not as common as it should be in the marketing sector. According to Invesp, data is seen by 87% of marketers as the most underutilized resource in their business.
It should be a priority for brands to identify customer profiles and habits and determine their sales strategies accordingly. To better understand this type of data, it is important to use elements such as scatter plots and data points. In short, data usage and visualization will put you ahead of your competitors.
9. Almost half of companies use data visualization to track user activity.
Companies are using different data visualization models more and more commonly. According to Content Square, 42% of brands use heatmaps to examine user activity on their mobile and online sites. At the same time, an additional 21% intend to use this technology within the next one to two years.
Brands use the heat map method to analyze user activity data on their sites and apps, making it easier to interpret this data. In this way, they can better optimize their sites and mobile apps and make it more user friendly by making accurate inferences about user activity.
10. Using verbal elements with visual elements is persuasive.
Visual data allows you to better reflect data sources to the target audience in presentations. According to the American Management Association survey, presenters who used both verbal and visual signals were viewed as 17% more persuasive than those who only utilized verbal cues.
Data visualization makes the data you convey to the target audience more remarkable and understandable. This is because data visualization makes data more likely for our minds to perceive. Therefore, if you want to be more successful in your presentations and want the target audience to understand you better, you should use data visualization.
11. Most of the information sent to the brain is visual.
Visual data is always more eye-catching than written data. Visual information constitutes most of the data transmitted to the human brain. The International Forum of Visual Practitioners has obtained data that proves this in an article they published. According to them, visual information makes up 90% of the information sent to the brain.
Data visualization is used to make data more accessible to perceive and understand. Presenting data with the help of data visualization tools such as pie charts and line graphs makes it easier for the brain to perceive. This creates an accurate and effective transfer of information.
12. Data usage is very important for companies.
A global survey conducted by Statista in 2023 found that many companies claim they are using data effectively. More than 75% of participants stated they were using data to drive innovation, and 50% thought their companies were competing on the basis of data and analytics.
Companies' use of raw data for reasons such as driving innovation has brought with it the need to be able to transfer and disclose the data accurately. With visualized data, you can make more accurate predictions and draw a route for your company.
13. Data visualization helps to reach common decisions.
The American Management Association revealed that compared to groups that did not employ visuals, groups that used visual language were 21% more successful in reaching consensus. One of the most critical components of a successful business is the capacity to come to decisions and act fast.
Data visualization helps groups make faster decisions in meetings. It saves time by enabling faster understanding and interpretation of the analyzed data. Faster decisions made thanks to data visualization are of great importance for companies.
14. 49% of marketers think they need to increase their use of data.
The use of data in marketing is crucial for developing the right strategies and addressing the target audience accurately. Invesp proved that 49% of marketing professionals feel they need to increase the role of data in their current strategy.
Accurately analyzing data about customers helps brands to increase sales and be successful. Increasing customer satisfaction and achieving customer loyalty is possible through accurate interpretation of data about customers. At this point, getting help from data visualization will make your job easier.
15. Data visualization improves decision-making.
Many different models can be used for data visualization. An overview map is an essential virtual language tool that can help individuals organize and understand information more quickly. According to the American Management Association, after presentations that included an overview map, 64% of participants immediately made a decision.
Data visualization increases engagement by presenting data in an engaging way to the target audience. It also saves time by making the data more easily understood. Thanks to data visualization and data analysis, decisions can be easily made and implemented.
16. Articles with images attract more attention.
Data visualization can be defined as articulating data in a compelling way. It makes it possible to communicate information effectively to a broader audience. A study conducted by Jeff Bullas proves that compared to articles without any visual components, articles with images get 94% more views.
Visual representations make data more interesting and easier to understand. The use of interactive data visualization methods, such as line charts, reflects the data more clearly and makes it easier to understand. If you haven't used data visualization before, you should definitely give it a chance.
17. The data visualization market will grow by 10% in the next three years.
Fortune Business Insights revealed an interesting statistic that explains the expectations for the growth of the data visualization market. By 2027, the size of the global data visualization market is expected to have grown to 19.20 billion dollars, with a compound annual growth rate of 10.2%.
The numerous benefits of data visualization have made it widely used in almost every industry. Its use is expected to increase every year. If you haven't used data visualization in your company yet, now is the time to do so.
18. 39.7% of US marketers use online tools for data visualization.
You may be curious about the frequency of using online tools to generate visual data. An impressive study by Demandsage has answered this question. 39.7% of US marketers use online tools to produce infographics and other visual data.
Online tools for data visualization will guide you and provide you with helpful assistance in this regard. The graphs and charts you obtain in this way will help you reach potential customers and increase your sales.
19. The majority of marketers are considering increasing their investment in data visualization.
Data visualization has become a must-have in the marketing industry. It enables you to recognize your target audience by making data about the target audience more understandable. A study by Hubspot in 2024 revealed that 88% of marketers plan to either raise or maintain their investment in infographics.
Using visual data while planning marketing strategies has accelerated the decision-making processes of companies and carried them one step ahead. For these reasons, the use of data visualization in the marketing sector is becoming widespread.
20. Access to usable data is increasing over the years.
Invesp reports that 49% of respondents said they were partially or very effective at using data-informed insights to influence future strategy, despite the fact that more than three-quarters of respondents (77%) reported a somewhat or significantly increased access to usable data compared to the previous year.
The use of data allows companies to understand the wants and needs of their customers and address them in the right way. Therefore, the use of data will increase the conversion rate. Companies that interpret data correctly will be ahead of the competition.

💡 If you are curious about mobile statistics, check out our article for more information.
5 Data visualization tools
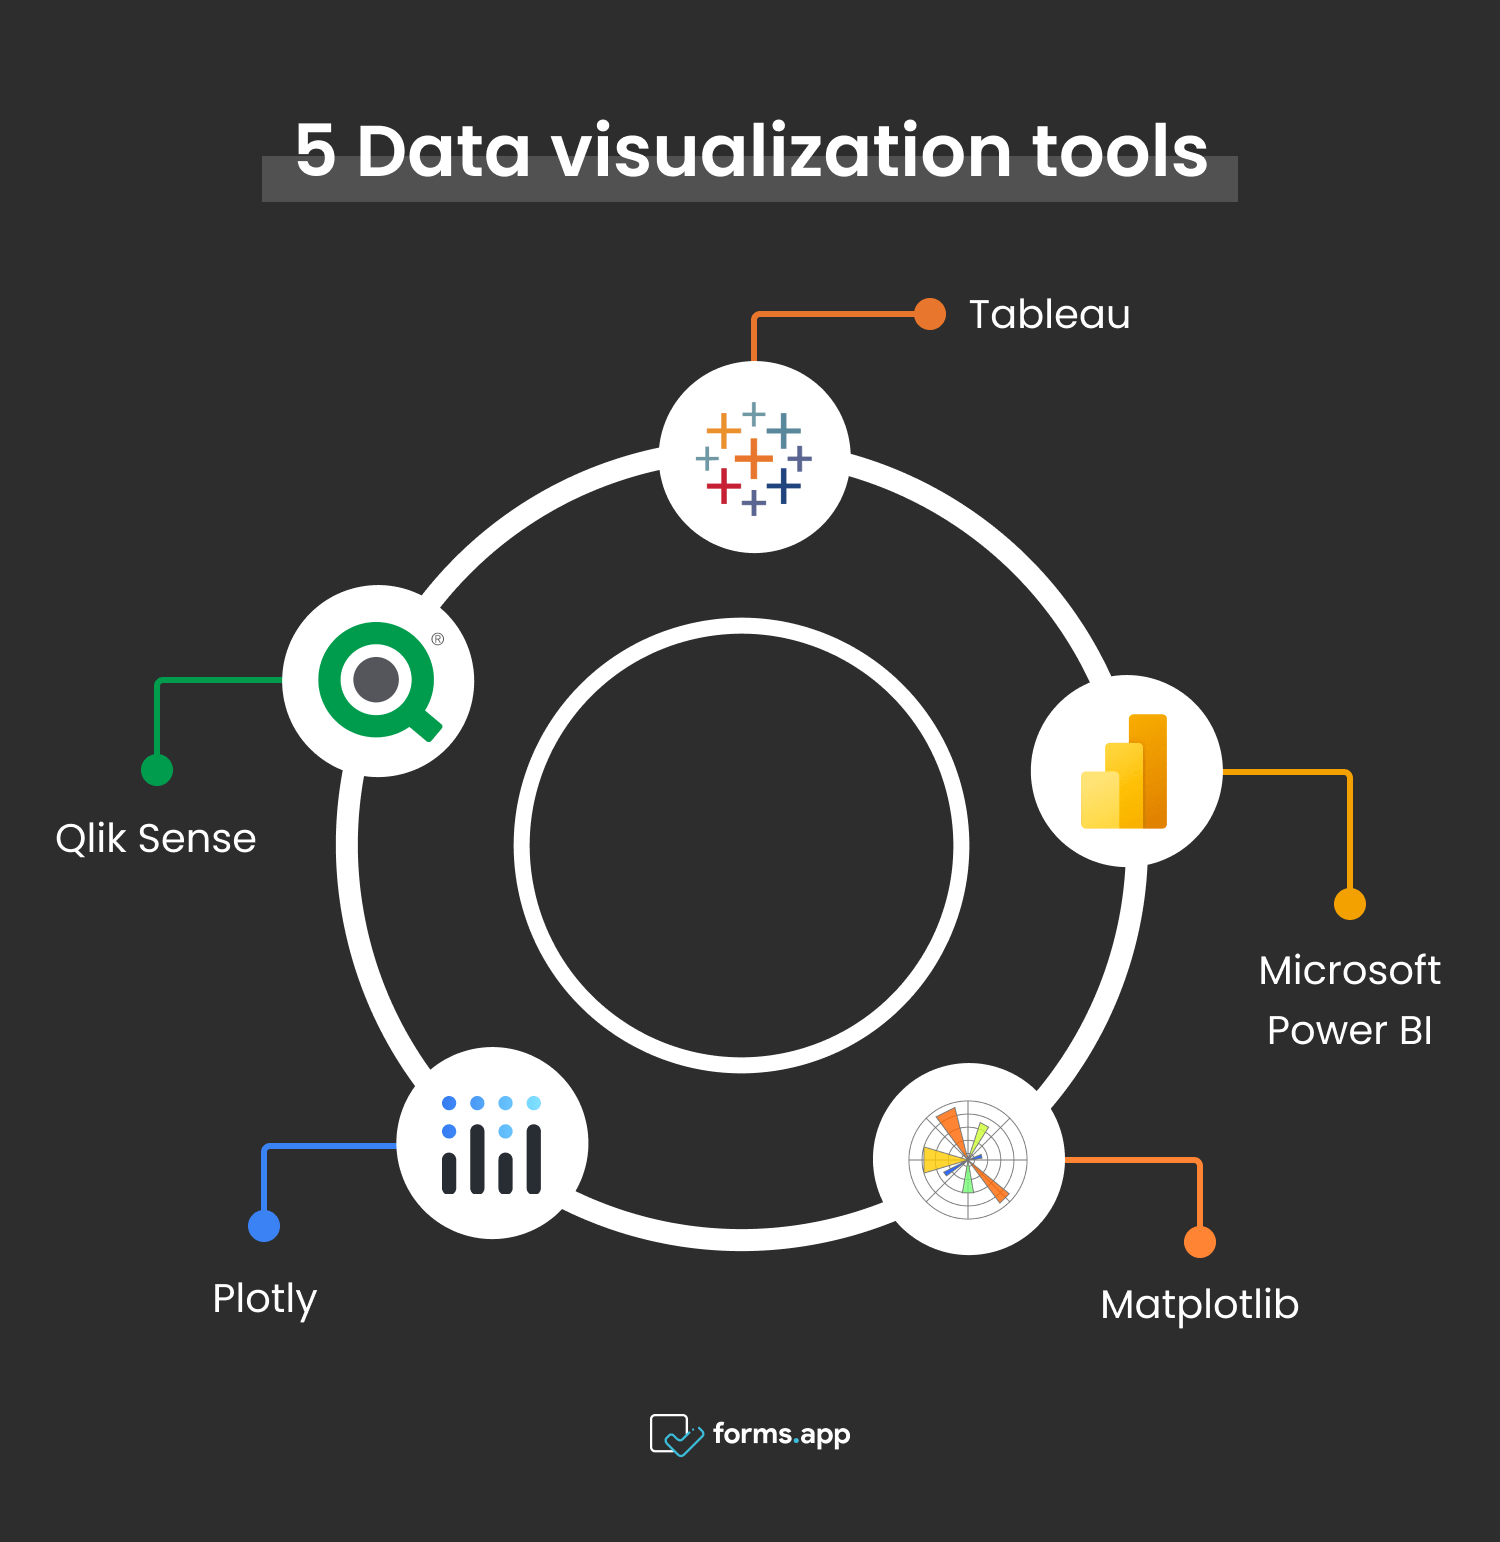
Data visualization tools allow companies to analyze data quickly and easily. With these tools, you can accurately interpret data and determine marketing strategies. In this way, you can make the most efficient planning for your company and address your target audience in line with their needs. Here are 5 of the best data visualization tools:
Tools for data visualization
- Tableau: Tableau is one of the most commonly used data visualization tools. It helps to analyze data and present it in various visual forms. It allows for easy data analysis and mobile-friendly work.
- Microsoft Power BI: Microsoft Power BI is a practical and secure data visualization tool. It serves different platforms and helps you create dashboards.
- Matplotlib: Matplotlib is one of the basic tools frequently used in data visualization. It allows 2 and 3 dimensional drawings. Can transfer different visualization styles to different formats.
- Plotly: Plotly is a library that can work with different programming languages. It includes various functions for creating dashboards. It allows you to create interactive charts quickly.
- Qlik Sense: Qlik Sense is a tool for personalized data visualization that allows you to work across multiple data sources. It enables you to utilize the data visualization strategy without losing time and making inferences.
Key points to take away
In conclusion, data visualization should be used by every company that aims to serve its customers better in the light of data. Thanks to 20+ data visualization statistics, you've seen what data visualization is and why it should be used. You have also seen the best data visualization tools.
Now you know everything you need to know, and you are ready to use data visualization in your company!
Fatih is a content writer at forms.app. He is also a translator and interpreter. Fatih loves reading and writing. He is passionate about exercising and traveling. His specialties are surveys, statistics, and translation.


 11 min lesen