![]()
- Çözümler
- Şablonlar
- Entegrasyonlar
- Fiyatlandırma
- Kurumsal
- Kaynaklar

 5 dakikalık okuma
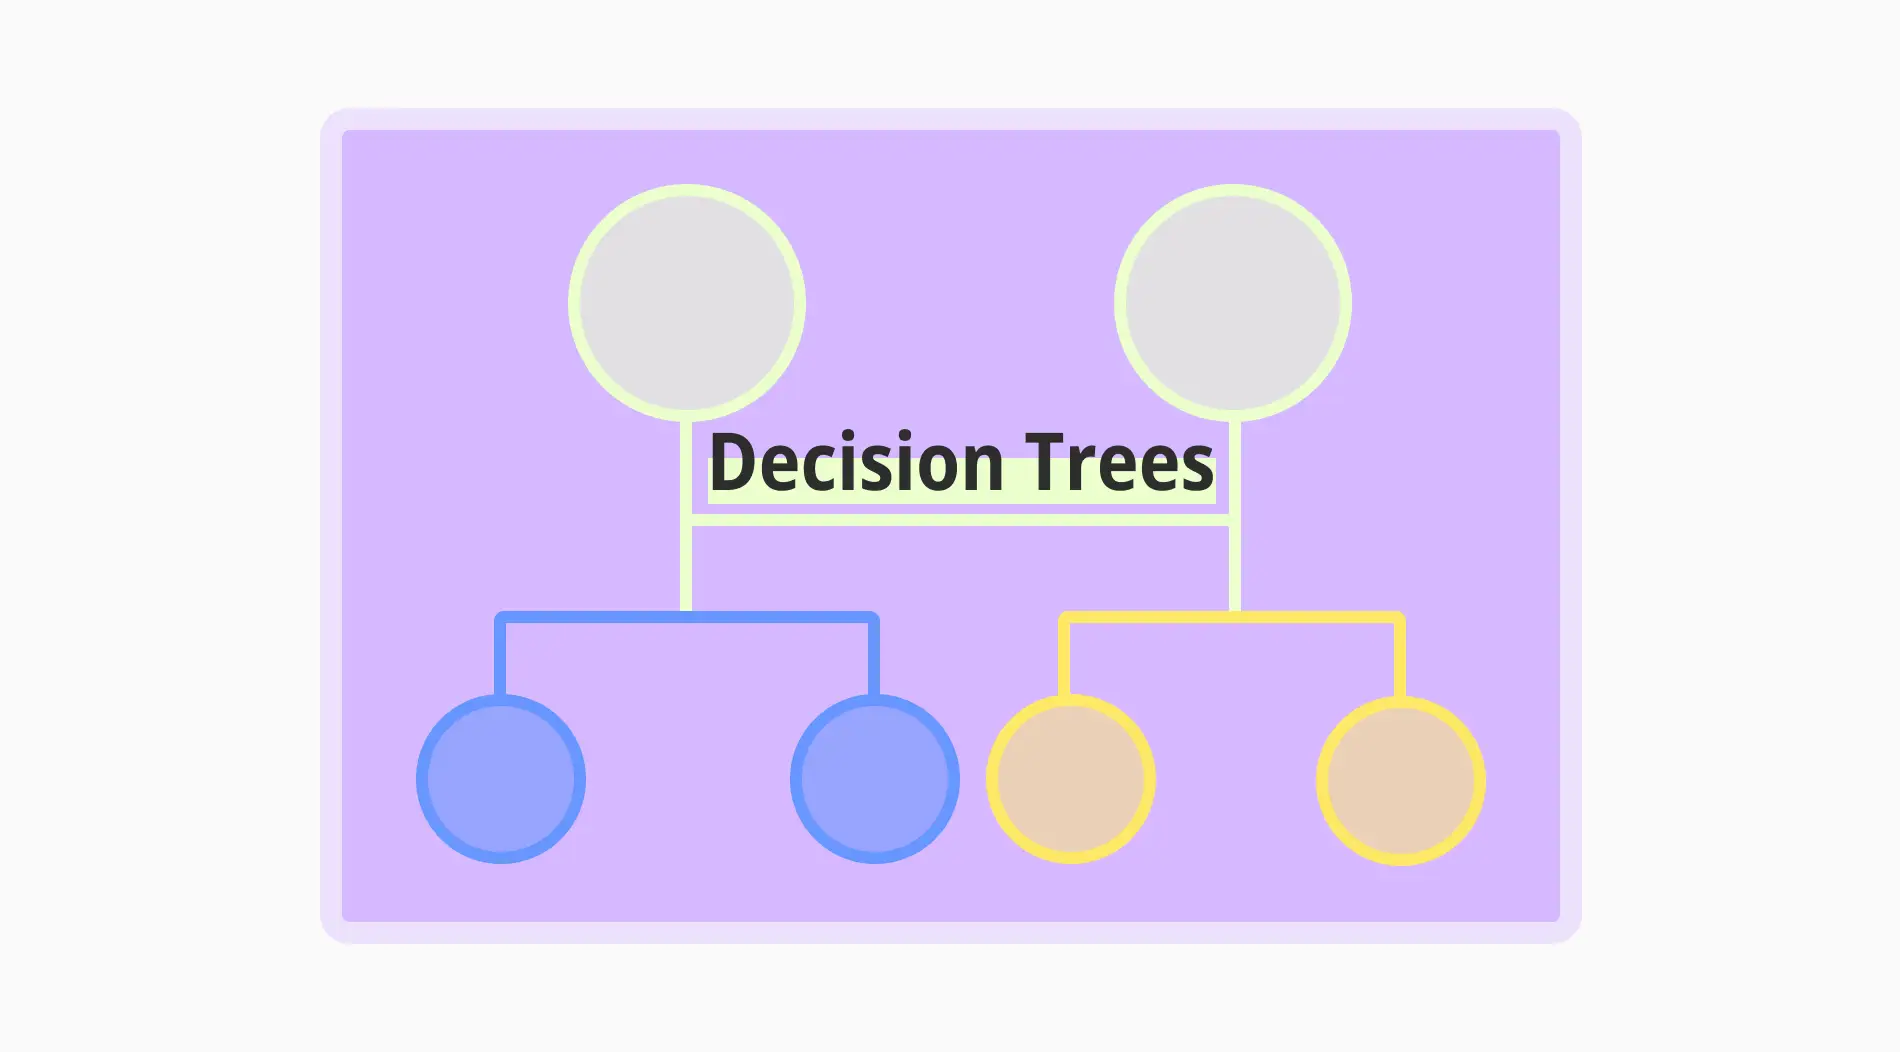
Do you know how companies manage to get so many variables into one decision? Or how they accurately identify fraudulent transactions? Decision trees are the answer to all this. Basically, decision trees break down decisions into more observable and manageable pieces, providing the framework for data analysis and insight into your decisions accordingly.
What is a decision tree?

A decision tree is a diagram used as a data analysis tool to enhance the decision-making process.
The reason for the tree structure analogy is that the nodes consist of roots, branches, and leaves, which represent the initial decision or problem, different opinions or tests, and final results and classifications, respectively.
Decision trees are powerful and simple tools that segment complex decisions into smaller, manageable parts. This allows easy visualization of the data analysis used to make accurate predictions, thereby allowing strategizing in many diversified fields accordingly.
When to use a decision tree
There is no specific time or situation for you to use a decision tree. It is a simple tool that can help you cope with most situations, even everyday problems. However, some situations under which the decision tree would be an appropriate inference procedure include:
⏰When explanations and interpretability of the results are of main concern
⏰When using it on the classification task (identifying spam emails and fraudulent transactions)
⏰When doing a regression analysis
⏰When preparing a predictive model
⏰When discovering non-linear relationships
⏰When turning insights into actions
Use cases of decision trees
Decision trees are versatile tools that can be used in various domains, such as healthcare, education, finance, marketing, and human resources. Here are two common use cases:
1. Churn prediction
Decision trees in the business world are used especially to offer subscription-based products or services. The churn event takes its place as the initial node; then, branches are created to list the factors that can cause churn.
In addition, statistical data such as customer satisfaction, the company's communication with customers, the user purchase rate, and the number of regular and abandoned customers are placed in the appropriate branches of your tree. When the decision tree is complete, churn patterns will emerge. Then, suggestions are made for measures to prevent churn.
2. Medical diagnosis
In the health field, diagnosing patients simply by using a decision tree is possible. You place the patient's height, weight, age, history, symptoms, test results, etc., into branches to do this. Then, you make predictions by creating probability branches. Finally, you compare the probabilities, determine your final decision, and diagnose the patient.
How to create a decision tree (step-by-step)
Creating a decision tree is a fairly simple process. You can either use technology programs or simply draw with a pen on paper. If we assume that you have a specific research purpose or problem and that your data has already been collected, you can create a decision tree in three steps.
1. Drawing the initial node: First, select the most important attribute affecting your decision, which will be your root node. Start creating branches based on the root node attribute and divide the data you have prepared before. Continue by labeling the branches as you create them.
2. Expanding nodes: Create branches that include different decisions by considering the next steps of the branches you have labeled. These branches represent probabilities and definitive results. You should draw two of them in different ways so that it will be easier to interpret later.
3. Reaching final nodes: Continue doing step two until you don’t need to add new branches. Then, each of these branches will end with a result node. This is necessary to facilitate comparison between result nodes and to perform the evaluation.
Examples of the decision tree
Here are two sample cases to give you an idea of how to create nodes in a typical decision tree. Although the examples here are in the field of market research, you can think of them as a decision tree template and adapt them to your own field of work.
Example #1
A game company aims to release a new type of game to the market. However, they want to find the target audience of the game by placing the data they collect into nodes in a decision tree to reach a final decision.
Root node: Age
Branch 1: Under 18s
Internal node: Gaming Platform Preference
Branch a: PC
Leaf node: Interest in sandbox games
Branch b: Mobile
Leaf node: Interest in casual games
Branch 2: Age 18-30
Internal node: Gaming experience history
Branch a: Role-play games
Leaf node: Interest in online role-play games
Branch b: Strategy games
Leaf node: Low interest in general
Example #2
A clothing company wants to learn about its customers' purchasing habits to provide them with better service.
Root node: Shopping Frequency
Branch 1: Frequent buyers
Internal node: Types of products purchased
Branch a: T-shirts
Leaf node: Increased rates, especially in summer
Branch b: Jeans
Leaf node: Increased rates, especially in autumn
Branch 2: Rare buyers
Internal node: Types of products purchased
Branch a: Bags
Leaf node: Increased rates, especially in spring
Branch b: Coats
Leaf node: Increased rates, especially in winter
Pros & cons of using the decision tree
Decision trees have advantages and disadvantages, as is the case with any analytical tool. Knowing what these are aids in deciding when and how to effectively implement a decision tree in various scenarios.

Advantages and disadvantages of using decision trees
➕Simple and easy to understand: Decision trees require no expertise, so they are easy to use when making a decision.
➕Being visual makes interpretation easier: It facilitates comprehension thanks to its visuality when sharing information with others.
➕Qualitative or quantitative data types can be examined: Examining two different types of data provides a more comprehensive analysis opportunity.
➖Making changes leads to mass changes: It is sensitive to data variations; be careful when making significant changes.
➖There may be bias in feature selection: Certain branches and features may become particularly prominent, inadvertently shaping decision-making.
➖If the data is low quality, the schema is also low quality: If your data collection step is incomplete or incorrect, you will not get an efficient result.
Frequently asked questions about the decision trees
You can take a look at the FAQ below to read answers to questions directly related to decision trees.
Bir karar ağacı, bir diyagram olarak kullanılan ağaç benzeri bir yapıdır. Temel olarak, amaçları ve karar verme sürecinin doğası gereği farklı olan birkaç tür karar ağacı vardır. Bunlar arasında sınıflandırma ağaçları ve regresyon ağaçları bulunur. Sınıflandırma ağaçları, sonuç değişkeni kategorik olduğunda kullanılır. Verileri belirli gruplara ayırır, örneğin bir işlemin meşru mu yoksa sahte mi olduğunu belirler.
Öte yandan regresyon ağaçları, sonuç değişkeni sürekli olduğunda kullanılır. Sayısal değerlerin tahminine yardımcı olur. Bu özellikle, çeşitli girdi faktörlerine dayanarak satış gelirlerini tahmin etmek gibi durumlarda kullanışlıdır. Her iki tür karar ağacı da verileri analiz etmek için açık ve yapılandırılmış bir yöntem sunar. Bilinçli karar verme için kullanılabilirler.
Bir karar ağacı, bir şirketin yeni bir ürün veya hizmet piyasaya sürmenin iyi bir fikir olup olmadığına karar vermek için kullandığı bir araç olabilir. Bu tür bir örnekte, kök düğüm ilk karar veya sorudur. "Ürün veya hizmeti piyasaya sürüyor muyuz?" İç düğümler ise bu karar veya sorun etrafındaki faktörlerdir. Bu aşamada özellikle, pazar araştırması, ürün/hizmet üretim ve tedarik maliyetleri ve müşteri memnuniyeti gibi faktörler listelenir.
Bu iç düğümler ayrıca farklı sonuçlar gösterebilir. "Üretim maliyetleri düşük" veya "Müşteri memnuniyeti yüksek" gibi dallar mevcut olabilir. Son kararlar yaprak düğümlerinde bulunur. "Ürünü iptal etmek", "Ürünü hemen piyasaya sürmek" veya "Ürünü gecikmeli olarak piyasaya sürmek" gibi kararlarla ağaç tüm karar yapısını ortaya çıkararak tüm faktörleri kolayca değerlendirmenizi sağlar.
Bir karar ağacı üç ana daldan oluşur: kök düğüm, iç düğümler ve yaprak düğümleri.
- Ağacın kök düğümü, ilk kararı simgeler ve tüm veri kümesini temsil eder.
- İç düğümler, aynı zamanda karar düğümleri olarak da bilinir, farklı kararlar veya özellik testlerini temsil eder ve daha fazla dallanma sağlar.
- Yaprak düğümleri ise (aynı zamanda terminal düğümleri olarak da bilinir) nihai sonucu veya tahmini temsil eder.
Bu bağlamda, karar ağacının her bir dalı, karmaşık kararları daha basit ve yönetilebilir bileşenlere bölerek düzenli ve sistemli bir şekilde karar almaya yardımcı olur.
Key points to take away
All in all, decision trees offer a simple visual method in the decision-making process. They can be utilized in more complex data analysis techniques to enhance stability. They are capable of representing qualitative and quantitative data so that they can be used in many different disciplines.
Although it has some disadvantages, such as instability, it is a tool that will always continue to be used with its simplicity and usability. This article explains decision tree examples with solutions so that you can now be informed and take action. It is your turn now.
Atakan is a content writer at forms.app. He likes to research various fields like history, sociology, and psychology. He knows English and Korean. His expertise lies in data analysis, data types, and methods.
İlgili Yazılar